Schematic overview of the cellular and molecular mechanisms involved in the cancer progression, including the proposed cellular and molecular mechanisms in cancer cells trajectory. AT1: alveolar type 1 cells; AT2: alveolar type 2 cells; AAH: atypical adenomatous hyperplasia; AIS: adenocarcinoma in situ; MIA: minimally invasive adenocarcinoma; IA: invasive adenocarcinoma; EMT: epithelial-mesenchymal transition

Home

Download

Statistics

Help

Contact

Center for Computational Systems Medicine
leaf

Gene summary

leaf

Malignant transformation analysis

leaf

Malignant transformation related pathway analysis

leaf

Cell-cell communication analysis

leaf

Single-cell gene regulatory network inference analysis

leaf

Somatic mutation of malignant transformation related genes

leaf

Related drugs of malignant transformation related genes

Gene: PPARD

Gene summary for PPARD

check button Gene summary.

Gene informationSpeciesHuman
Gene symbol

PPARD

Gene ID

5467

Gene nameperoxisome proliferator activated receptor delta
Gene AliasFAAR
Cytomap6p21.31
Gene Typeprotein-coding
GO ID

GO:0000003

UniProtAcc

A0A024RCW6


Top

Malignant transformation analysis

check button Identification of the aberrant gene expression in precancerous and cancerous lesions by comparing the gene expression of stem-like cells in diseased tissues with normal stem cells
check button Malignant transformation involving gene list.
Entrez IDSymbolReplicatesSpeciesOrganTissueAdj P-valueLog2FCMalignancy
5467PPARDCCI_1HumanCervixCC7.82e-099.89e-010.528
5467PPARDCCI_2HumanCervixCC1.81e-056.11e-010.5249
5467PPARDCCI_3HumanCervixCC4.06e-034.22e-010.516
5467PPARDAEH-subject1HumanEndometriumAEH7.84e-042.07e-01-0.3059
5467PPARDAEH-subject5HumanEndometriumAEH8.35e-123.13e-01-0.2953
5467PPARDEEC-subject1HumanEndometriumEEC3.53e-093.91e-01-0.2682
5467PPARDEEC-subject4HumanEndometriumEEC5.61e-042.38e-01-0.2571
5467PPARDEEC-subject5HumanEndometriumEEC8.05e-062.77e-01-0.249
5467PPARDGSM6177620_NYU_UCEC1_lib1_lib1HumanEndometriumEEC4.54e-03-1.40e-02-0.1869
5467PPARDGSM6177620_NYU_UCEC1_lib2_lib2HumanEndometriumEEC4.46e-022.38e-02-0.1875
5467PPARDGSM6177622_NYU_UCEC3_lib1_lib1HumanEndometriumEEC2.14e-045.00e-02-0.1917
5467PPARDGSM6177622_NYU_UCEC3_lib2_lib2HumanEndometriumEEC1.03e-021.25e-02-0.1916
5467PPARDLZE4THumanEsophagusESCC2.56e-031.56e-010.0811
5467PPARDLZE8THumanEsophagusESCC1.03e-038.61e-020.067
5467PPARDLZE24THumanEsophagusESCC1.77e-091.72e-010.0596
5467PPARDLZE21THumanEsophagusESCC1.43e-093.61e-010.0655
5467PPARDLZE6THumanEsophagusESCC8.07e-072.04e-010.0845
5467PPARDP1T-EHumanEsophagusESCC4.86e-092.66e-010.0875
5467PPARDP2T-EHumanEsophagusESCC5.67e-102.29e-010.1177
5467PPARDP4T-EHumanEsophagusESCC9.97e-111.03e-010.1323
Page: 1 2 3 4 5 

check button Transcriptomic changes along malignancy continuum.
TissueExpression DynamicsAbbreviation
CervixThe image shows the transcriptomic changes along malignancy continuum.log2FC in expression of this searched gene in stem-like cells from each diseased tissue sample relative to stem-like cells in normal samples in each tissue plotted against the malignancy continuum. Samples are colored based on if they are from different disease stage.CC: Cervix cancer
HSIL_HPV: HPV-infected high-grade squamous intraepithelial lesions
N_HPV: HPV-infected normal cervix
EndometriumThe image shows the transcriptomic changes along malignancy continuum.log2FC in expression of this searched gene in stem-like cells from each diseased tissue sample relative to stem-like cells in normal samples in each tissue plotted against the malignancy continuum. Samples are colored based on if they are from different disease stage.AEH: Atypical endometrial hyperplasia
EEC: Endometrioid Cancer
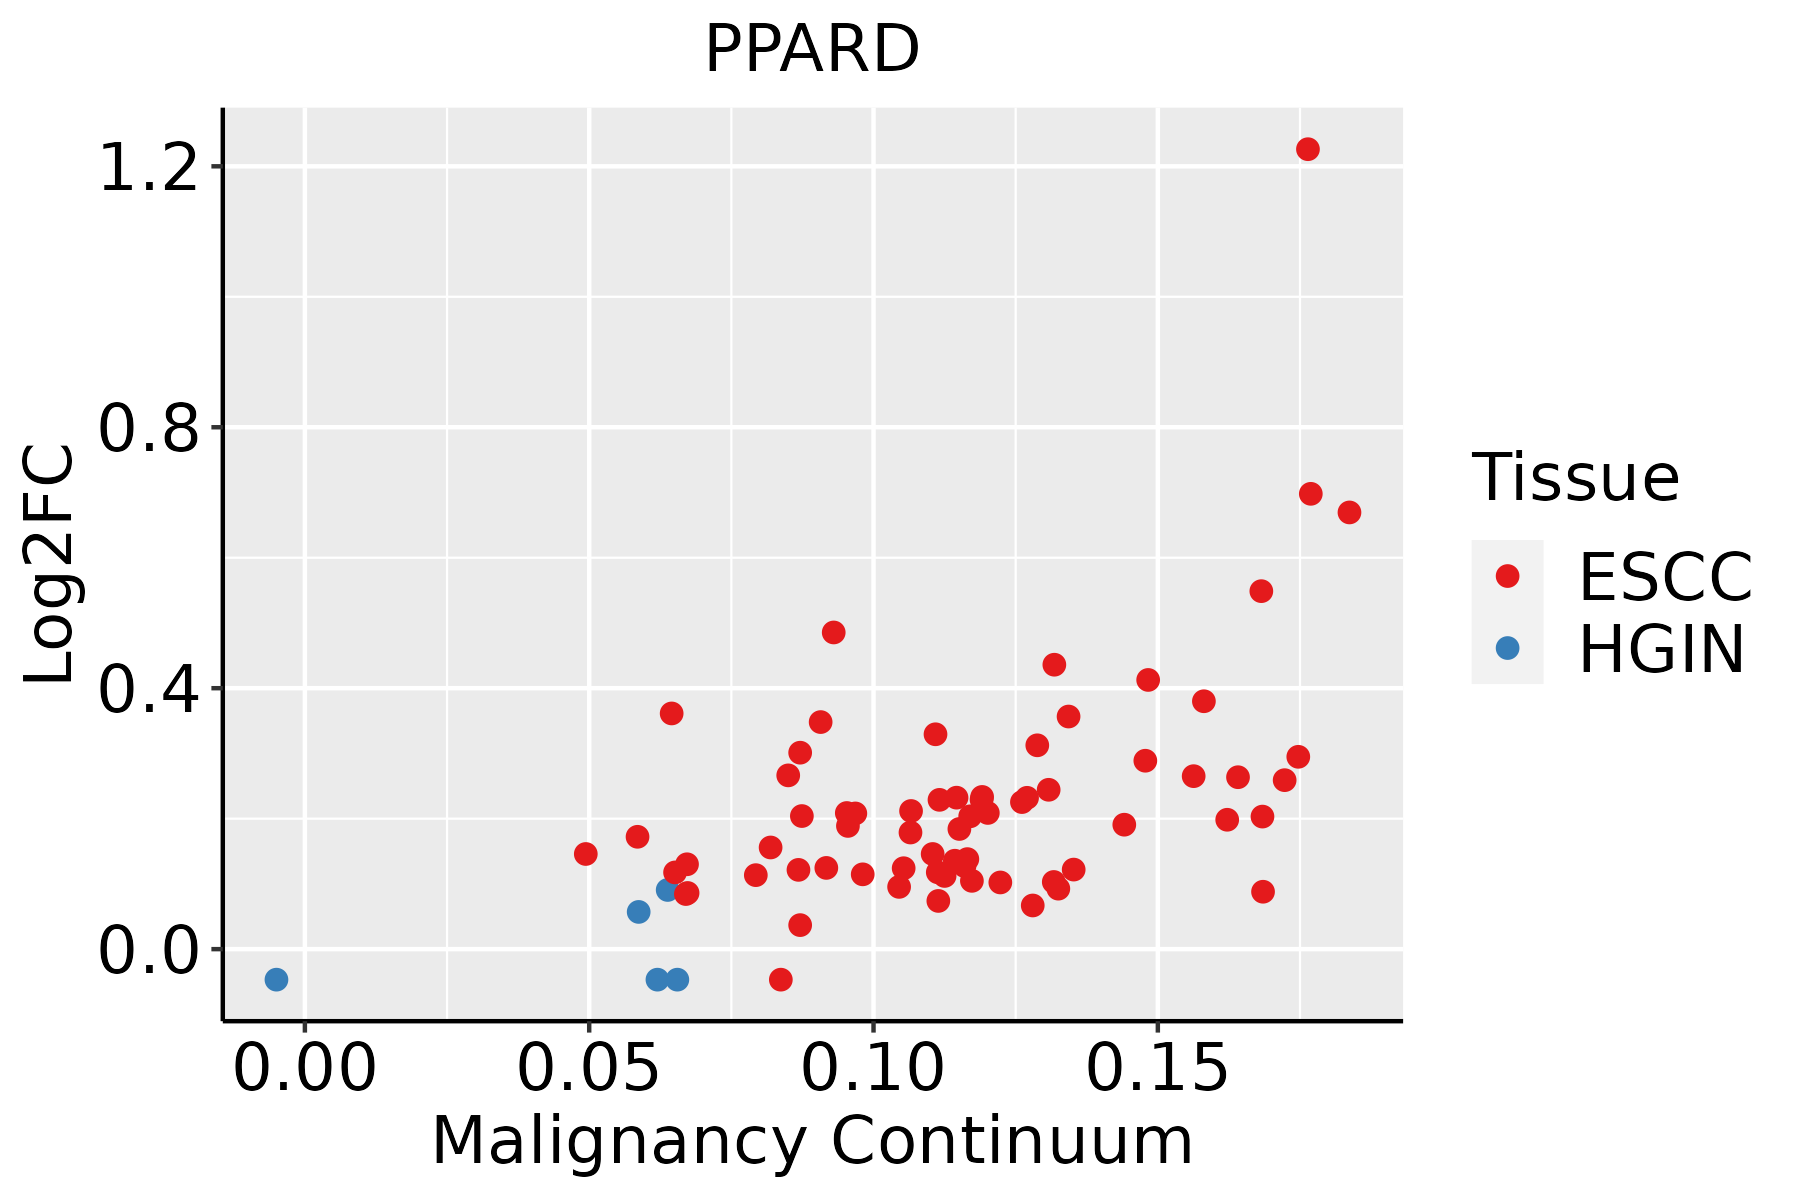
EsophagusThe image shows the transcriptomic changes along malignancy continuum.log2FC in expression of this searched gene in stem-like cells from each diseased tissue sample relative to stem-like cells in normal samples in each tissue plotted against the malignancy continuum. Samples are colored based on if they are from different disease stage.ESCC: Esophageal squamous cell carcinoma
HGIN: High-grade intraepithelial neoplasias
LGIN: Low-grade intraepithelial neoplasias
LiverThe image shows the transcriptomic changes along malignancy continuum.log2FC in expression of this searched gene in stem-like cells from each diseased tissue sample relative to stem-like cells in normal samples in each tissue plotted against the malignancy continuum. Samples are colored based on if they are from different disease stage.HCC: Hepatocellular carcinoma
NAFLD: Non-alcoholic fatty liver disease
LungThe image shows the transcriptomic changes along malignancy continuum.log2FC in expression of this searched gene in stem-like cells from each diseased tissue sample relative to stem-like cells in normal samples in each tissue plotted against the malignancy continuum. Samples are colored based on if they are from different disease stage.AAH: Atypical adenomatous hyperplasia
AIS: Adenocarcinoma in situ
IAC: Invasive lung adenocarcinoma
MIA: Minimally invasive adenocarcinoma
Oral CavityThe image shows the transcriptomic changes along malignancy continuum.log2FC in expression of this searched gene in stem-like cells from each diseased tissue sample relative to stem-like cells in normal samples in each tissue plotted against the malignancy continuum. Samples are colored based on if they are from different disease stage.EOLP: Erosive Oral lichen planus
LP: leukoplakia
NEOLP: Non-erosive oral lichen planus
OSCC: Oral squamous cell carcinoma
∗log2FC in expression of this searched gene in stem-like cells from each diseased tissue sample relative to stem-like cells in normal samples in each tissue plotted against the malignancy continuum. Samples are colored based on if they are from different disease stage.

Top

Malignant transformation related pathway analysis

check buttonFind out the enriched GO biological processes and KEGG pathways involved in transition from healthy to precancer to cancer
check button Figure of enriched GO biological processes.
TissueDisease StageEnriched GO biological Processes
ColorectumADGO analysis - Figure of enriched GO biological processes: Top 15 enriched GO BP terms are showed in the bar plot of each disease state in each tissue. Each row represents a significant GO biological process which is colored according to the -log10(p.adjust).
ColorectumSERGO analysis - Figure of enriched GO biological processes: Top 15 enriched GO BP terms are showed in the bar plot of each disease state in each tissue. Each row represents a significant GO biological process which is colored according to the -log10(p.adjust).
ColorectumMSSGO analysis - Figure of enriched GO biological processes: Top 15 enriched GO BP terms are showed in the bar plot of each disease state in each tissue. Each row represents a significant GO biological process which is colored according to the -log10(p.adjust).
ColorectumMSI-HGO analysis - Figure of enriched GO biological processes: Top 15 enriched GO BP terms are showed in the bar plot of each disease state in each tissue. Each row represents a significant GO biological process which is colored according to the -log10(p.adjust).
ColorectumFAPGO analysis - Figure of enriched GO biological processes: Top 15 enriched GO BP terms are showed in the bar plot of each disease state in each tissue. Each row represents a significant GO biological process which is colored according to the -log10(p.adjust).
∗Top 15 enriched GO BP terms are showed in the bar plot of each disease state in each tissue. Each row represents a significant GO biological process which is colored according to the -log10(p.adjust).
Page: 1 2 3 4 5 6 7 8 9 

check button Enriched GO biological processes.
GO IDTissueDisease StageDescriptionGene RatioBg Ratiopvaluep.adjustCount
GO:0030336LungIACnegative regulation of cell migration54/2061344/187234.65e-033.66e-0254
GO:0051271LungIACnegative regulation of cellular component movement57/2061367/187234.67e-033.67e-0257
GO:0040013LungIACnegative regulation of locomotion60/2061391/187234.94e-033.78e-0260
GO:00085444LungIACepidermis development51/2061324/187235.51e-034.11e-0251
GO:00310994LungIACregeneration34/2061198/187235.73e-034.18e-0234
GO:00022377LungIACresponse to molecule of bacterial origin56/2061363/187235.78e-034.21e-0256
GO:00199153LungIAClipid storage18/206187/187235.97e-034.33e-0218
GO:00506785LungIACregulation of epithelial cell proliferation58/2061381/187236.67e-034.67e-0258
GO:00324967LungIACresponse to lipopolysaccharide53/2061343/187236.87e-034.75e-0253
GO:000609118Oral cavityOSCCgeneration of precursor metabolites and energy286/7305490/187231.45e-181.71e-16286
GO:190495119Oral cavityOSCCpositive regulation of establishment of protein localization196/7305319/187232.89e-162.20e-14196
GO:005122219Oral cavityOSCCpositive regulation of protein transport187/7305303/187237.37e-165.49e-14187
GO:001604917Oral cavityOSCCcell growth268/7305482/187236.55e-143.51e-12268
GO:004206020Oral cavityOSCCwound healing237/7305422/187234.51e-132.18e-11237
GO:007048219Oral cavityOSCCresponse to oxygen levels200/7305347/187231.17e-125.13e-11200
GO:000155816Oral cavityOSCCregulation of cell growth228/7305414/187231.74e-116.09e-10228
GO:000166619Oral cavityOSCCresponse to hypoxia177/7305307/187232.21e-117.50e-10177
GO:003629319Oral cavityOSCCresponse to decreased oxygen levels182/7305322/187231.14e-103.41e-09182
GO:005123518Oral cavityOSCCmaintenance of location182/7305327/187236.16e-101.58e-08182
GO:004854520Oral cavityOSCCresponse to steroid hormone186/7305339/187231.86e-094.42e-08186
Page: 1 2 3 4 5 6 7 8 9 10 11 12 13 14 15 16 17 18 19 20 21 22 23 24 25 26 27 28 29 30 31 32 33 34 35 36 37 38 39 

check button Enriched KEGG pathways.
Pathway IDTissueDisease StageDescriptionGene RatioBg Ratiopvaluep.adjustqvalueCount
hsa043109CervixCCWnt signaling pathway43/1267171/84653.03e-041.64e-039.68e-0443
hsa0431012CervixCCWnt signaling pathway43/1267171/84653.03e-041.64e-039.68e-0443
hsa0431010EndometriumAEHWnt signaling pathway37/1197171/84654.68e-032.53e-021.86e-0237
hsa0431013EndometriumAEHWnt signaling pathway37/1197171/84654.68e-032.53e-021.86e-0237
hsa0431022EndometriumEECWnt signaling pathway40/1237171/84651.37e-038.99e-036.70e-0340
hsa0431032EndometriumEECWnt signaling pathway40/1237171/84651.37e-038.99e-036.70e-0340
hsa052215EsophagusESCCAcute myeloid leukemia49/420567/84657.43e-053.07e-041.57e-0449
hsa0522113EsophagusESCCAcute myeloid leukemia49/420567/84657.43e-053.07e-041.57e-0449
hsa033204LiverHCCPPAR signaling pathway48/402075/84652.83e-039.37e-035.21e-0348
hsa05221LiverHCCAcute myeloid leukemia41/402067/84651.64e-023.90e-022.17e-0241
hsa033205LiverHCCPPAR signaling pathway48/402075/84652.83e-039.37e-035.21e-0348
hsa052211LiverHCCAcute myeloid leukemia41/402067/84651.64e-023.90e-022.17e-0241
hsa043108LungIACWnt signaling pathway40/1053171/84654.56e-057.06e-044.69e-0440
hsa0431011LungIACWnt signaling pathway40/1053171/84654.56e-057.06e-044.69e-0440
hsa052214Oral cavityOSCCAcute myeloid leukemia42/370467/84651.34e-033.75e-031.91e-0342
hsa0522112Oral cavityOSCCAcute myeloid leukemia42/370467/84651.34e-033.75e-031.91e-0342
hsa0522121Oral cavityEOLPAcute myeloid leukemia19/121867/84652.20e-037.32e-034.32e-0319
hsa0431016Oral cavityEOLPWnt signaling pathway37/1218171/84656.23e-031.83e-021.08e-0237
hsa052213Oral cavityEOLPAcute myeloid leukemia19/121867/84652.20e-037.32e-034.32e-0319
hsa0431017Oral cavityEOLPWnt signaling pathway37/1218171/84656.23e-031.83e-021.08e-0237
Page: 1 2 

Top

Cell-cell communication analysis

check buttonIdentification of potential cell-cell interactions between two cell types and their ligand-receptor pairs for different disease states
LigandReceptorLRpairPathwayTissueDisease Stage
Page: 1 

Top

Single-cell gene regulatory network inference analysis

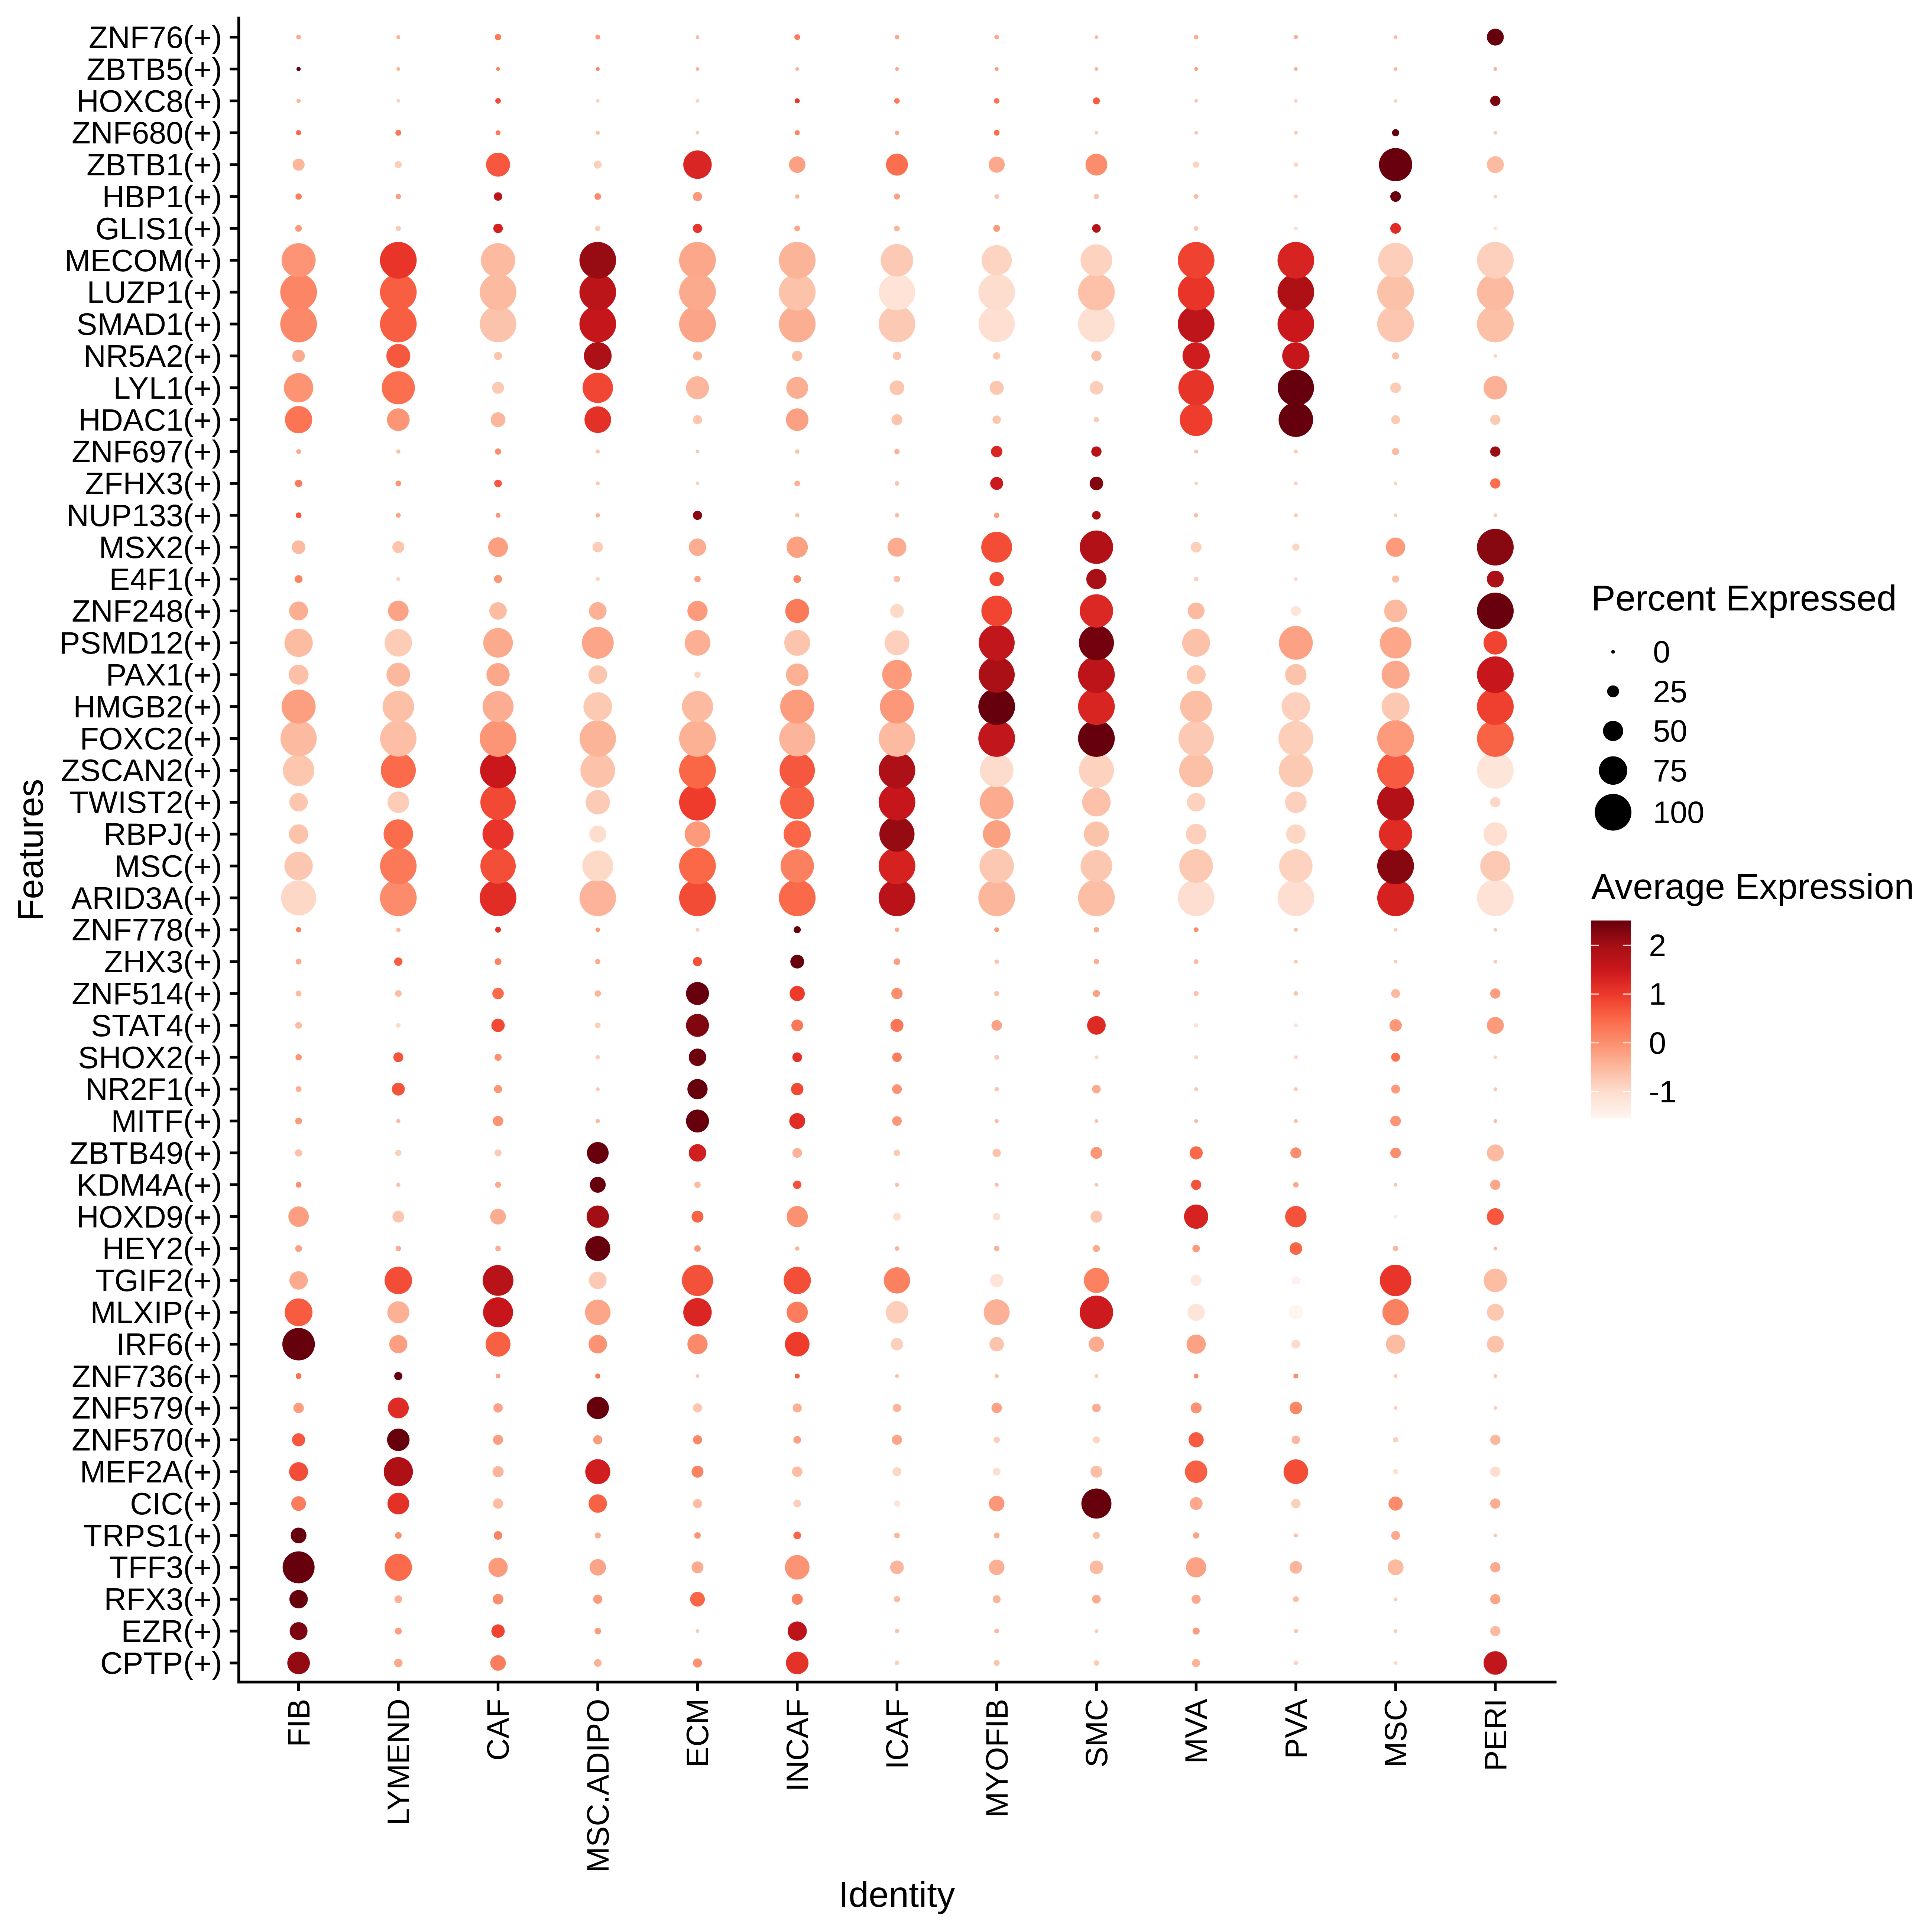
check buttonFind out the significant the regulons (TFs) and the target genes of each regulon across cell types for different disease states
TFCell TypeTissueDisease StageTarget GeneRSSRegulon Activity
PPARDTFHBreastADJCTH,SF3A3,ZNF532, etc.7.27e-02The dot plots of a searched regulon are shown for all cell subpopulations in each disease state of each tissue based on the regulon specific score inferred using pySCENIC and by calculating the average expression.
PPARDCAFBreastIDCHK2,FSTL1,SLC2A3, etc.3.29e-02The dot plots of a searched regulon are shown for all cell subpopulations in each disease state of each tissue based on the regulon specific score inferred using pySCENIC and by calculating the average expression.
PPARDM2MACCervixCCDOCK4,PFKFB3,RAPGEF1, etc.2.77e-01The dot plots of a searched regulon are shown for all cell subpopulations in each disease state of each tissue based on the regulon specific score inferred using pySCENIC and by calculating the average expression.
PPARDMONColorectumHealthyCREM,NAMPT,DOCK4, etc.1.38e-01The dot plots of a searched regulon are shown for all cell subpopulations in each disease state of each tissue based on the regulon specific score inferred using pySCENIC and by calculating the average expression.
PPARDCFIBColorectumADJTGFB1,ANKRD13C,PCNX4, etc.4.46e-01The dot plots of a searched regulon are shown for all cell subpopulations in each disease state of each tissue based on the regulon specific score inferred using pySCENIC and by calculating the average expression.
PPARDM2MACEndometriumADJLRMDA,DOCK4,NFKB1, etc.2.47e-01The dot plots of a searched regulon are shown for all cell subpopulations in each disease state of each tissue based on the regulon specific score inferred using pySCENIC and by calculating the average expression.
PPARDINMONEndometriumADJLRMDA,DOCK4,NFKB1, etc.1.04e-01The dot plots of a searched regulon are shown for all cell subpopulations in each disease state of each tissue based on the regulon specific score inferred using pySCENIC and by calculating the average expression.
PPARDINMONEndometriumEECLRMDA,DOCK4,NFKB1, etc.8.16e-02The dot plots of a searched regulon are shown for all cell subpopulations in each disease state of each tissue based on the regulon specific score inferred using pySCENIC and by calculating the average expression.
PPARDCD8TEFFEndometriumHealthyLRMDA,DOCK4,NFKB1, etc.1.92e-02The dot plots of a searched regulon are shown for all cell subpopulations in each disease state of each tissue based on the regulon specific score inferred using pySCENIC and by calculating the average expression.
PPARDMASTLungMIACMAML3,AREG,F8, etc.8.18e-02The dot plots of a searched regulon are shown for all cell subpopulations in each disease state of each tissue based on the regulon specific score inferred using pySCENIC and by calculating the average expression.
∗The dot plots of a searched regulon are shown for all cell subpopulations in each disease state of each tissue based on the regulon specific score inferred using pySCENIC and by calculating the average expression.
Page: 1 2 3 4 

Top

Somatic mutation of malignant transformation related genes

check buttonAnnotation of somatic variants for genes involved in malignant transformation
Hugo SymbolVariant ClassVariant ClassificationdbSNP RSHGVScHGVSpHGVSp ShortSWISSPROTBIOTYPESIFTPolyPhenTumor Sample BarcodeTissueHistologySexAgeStageTherapy TypesDrugsOutcome
PPARDSNVMissense_Mutationrs767428713c.941N>Ap.Arg314Hisp.R314HQ03181protein_codingtolerated(0.06)benign(0.082)TCGA-A8-A07U-01Breastbreast invasive carcinomaFemale>=65III/IVChemotherapy5-fluorouracilSD
PPARDSNVMissense_Mutationc.448G>Cp.Glu150Glnp.E150QQ03181protein_codingtolerated(1)possibly_damaging(0.826)TCGA-D8-A1JA-01Breastbreast invasive carcinomaFemale<65III/IVChemotherapyadriamycinPD
PPARDinsertionIn_Frame_Insnovelc.666_667insAAAGCCAGCCACACGGCGGTGAGTp.Ala222_Glu223insLysAlaSerHisThrAlaValSerp.A222_E223insKASHTAVSQ03181protein_codingTCGA-A2-A0EO-01Breastbreast invasive carcinomaFemale<65I/IIHormone TherapytamoxiphenSD
PPARDinsertionIn_Frame_Insnovelc.1108_1109insCTTGGTCTGTCACGGCCAAGGAGGCCTGCCGTCCCCp.Val370delinsAlaTrpSerValThrAlaLysGluAlaCysArgProLeup.V370delinsAWSVTAKEACRPLQ03181protein_codingTCGA-A8-A09T-01Breastbreast invasive carcinomaFemale>=65I/IIHormone TherapyanastrozoleSD
PPARDinsertionFrame_Shift_Insnovelc.1139_1140insATCATTCTGTGTGGAGGTGAGTGAGAGTGGGGCAGGTGGGCTGGp.Leu381SerfsTer51p.L381Sfs*51Q03181protein_codingTCGA-B6-A0IA-01Breastbreast invasive carcinomaFemale<65I/IIUnknownUnknownSD
PPARDSNVMissense_Mutationnovelc.136T>Cp.Ser46Prop.S46PQ03181protein_codingtolerated(0.11)benign(0)TCGA-2W-A8YY-01Cervixcervical & endocervical cancerFemale<65I/IIChemotherapycisplatinCR
PPARDSNVMissense_Mutationrs765360583c.308G>Ap.Arg103Hisp.R103HQ03181protein_codingdeleterious(0)probably_damaging(0.999)TCGA-2W-A8YY-01Cervixcervical & endocervical cancerFemale<65I/IIChemotherapycisplatinCR
PPARDSNVMissense_Mutationc.431N>Ap.Arg144Hisp.R144HQ03181protein_codingdeleterious(0)probably_damaging(0.998)TCGA-FU-A3HZ-01Cervixcervical & endocervical cancerFemale<65I/IIChemotherapycisplatinCR
PPARDSNVMissense_Mutationnovelc.684N>Cp.Trp228Cysp.W228CQ03181protein_codingtolerated(0.31)probably_damaging(0.98)TCGA-JW-A5VL-01Cervixcervical & endocervical cancerFemale<65I/IIUnknownUnknownSD
PPARDSNVMissense_Mutationc.592N>Tp.Arg198Cysp.R198CQ03181protein_codingdeleterious(0.02)benign(0.409)TCGA-A6-2686-01Colorectumcolon adenocarcinomaFemale>=65I/IIUnknownUnknownSD
Page: 1 2 3 4 5 6 

Top

Related drugs of malignant transformation related genes

check buttonIdentification of chemicals and drugs interact with genes involved in malignant transfromation
(DGIdb 4.0)
Entrez IDSymbolCategoryInteraction TypesDrug Claim NameDrug NamePMIDs
5467PPARDNUCLEAR HORMONE RECEPTOR, DRUGGABLE GENOME, TRANSCRIPTION FACTORPROPACHLORPROPACHLOR
5467PPARDNUCLEAR HORMONE RECEPTOR, DRUGGABLE GENOME, TRANSCRIPTION FACTORDICHLOROPHENDICHLOROPHEN
5467PPARDNUCLEAR HORMONE RECEPTOR, DRUGGABLE GENOME, TRANSCRIPTION FACTORBISPHENOL ABISPHENOL A
5467PPARDNUCLEAR HORMONE RECEPTOR, DRUGGABLE GENOME, TRANSCRIPTION FACTORTCMDC-123920CHEMBL1606
5467PPARDNUCLEAR HORMONE RECEPTOR, DRUGGABLE GENOME, TRANSCRIPTION FACTORGW7647GW764718162399
5467PPARDNUCLEAR HORMONE RECEPTOR, DRUGGABLE GENOME, TRANSCRIPTION FACTORHYDRAMETHYLNONHYDRAMETHYLNON
5467PPARDNUCLEAR HORMONE RECEPTOR, DRUGGABLE GENOME, TRANSCRIPTION FACTORagonistCHEMBL3544958CER-002
5467PPARDNUCLEAR HORMONE RECEPTOR, DRUGGABLE GENOME, TRANSCRIPTION FACTOR12-HYDROXY-OCTADECANOIC ACIDCHEMBL292352
5467PPARDNUCLEAR HORMONE RECEPTOR, DRUGGABLE GENOME, TRANSCRIPTION FACTORL-165041CHEMBL153057
5467PPARDNUCLEAR HORMONE RECEPTOR, DRUGGABLE GENOME, TRANSCRIPTION FACTORCLOTRIMAZOLECLOTRIMAZOLE
Page: 1 2 3 4 5 6 7 8 9 10 11 12 13 14 15 16