
|
|||||
|
 | |
| |
| |
| |
| |
| |
|
Gene: PMAIP1 |
Gene summary for PMAIP1 |
| Gene information | Species | Human | Gene symbol | PMAIP1 | Gene ID | 5366 |
| Gene name | phorbol-12-myristate-13-acetate-induced protein 1 | |
| Gene Alias | APR | |
| Cytomap | 18q21.32 | |
| Gene Type | protein-coding | GO ID | GO:0001666 | UniProtAcc | A0A0S2Z490 |
Top |
Malignant transformation analysis |
| Identification of the aberrant gene expression in precancerous and cancerous lesions by comparing the gene expression of stem-like cells in diseased tissues with normal stem cells |
| Entrez ID | Symbol | Replicates | Species | Organ | Tissue | Adj P-value | Log2FC | Malignancy |
| 5366 | PMAIP1 | GSM4909280 | Human | Breast | Precancer | 4.79e-03 | 5.32e-01 | 0.0305 |
| 5366 | PMAIP1 | GSM4909282 | Human | Breast | IDC | 1.57e-25 | 7.28e-01 | -0.0288 |
| 5366 | PMAIP1 | GSM4909286 | Human | Breast | IDC | 1.20e-03 | -3.68e-01 | 0.1081 |
| 5366 | PMAIP1 | GSM4909287 | Human | Breast | IDC | 5.61e-07 | 4.21e-01 | 0.2057 |
| 5366 | PMAIP1 | GSM4909290 | Human | Breast | IDC | 9.55e-06 | -4.00e-01 | 0.2096 |
| 5366 | PMAIP1 | GSM4909291 | Human | Breast | IDC | 3.86e-06 | -4.25e-01 | 0.1753 |
| 5366 | PMAIP1 | GSM4909294 | Human | Breast | IDC | 8.31e-13 | -4.30e-01 | 0.2022 |
| 5366 | PMAIP1 | GSM4909296 | Human | Breast | IDC | 1.81e-07 | -3.20e-01 | 0.1524 |
| 5366 | PMAIP1 | GSM4909297 | Human | Breast | IDC | 1.25e-09 | -2.50e-01 | 0.1517 |
| 5366 | PMAIP1 | GSM4909306 | Human | Breast | IDC | 4.61e-02 | -2.93e-01 | 0.1564 |
| 5366 | PMAIP1 | GSM4909307 | Human | Breast | IDC | 1.55e-03 | -3.30e-01 | 0.1569 |
| 5366 | PMAIP1 | GSM4909311 | Human | Breast | IDC | 2.53e-19 | -4.48e-01 | 0.1534 |
| 5366 | PMAIP1 | GSM4909312 | Human | Breast | IDC | 4.33e-13 | -4.03e-01 | 0.1552 |
| 5366 | PMAIP1 | GSM4909319 | Human | Breast | IDC | 5.48e-20 | -4.35e-01 | 0.1563 |
| 5366 | PMAIP1 | GSM4909320 | Human | Breast | IDC | 4.22e-03 | -4.29e-01 | 0.1575 |
| 5366 | PMAIP1 | GSM4909321 | Human | Breast | IDC | 9.42e-04 | -4.56e-02 | 0.1559 |
| 5366 | PMAIP1 | NCCBC14 | Human | Breast | DCIS | 1.32e-06 | -3.82e-01 | 0.2021 |
| 5366 | PMAIP1 | NCCBC3 | Human | Breast | DCIS | 2.85e-12 | -4.19e-01 | 0.1198 |
| 5366 | PMAIP1 | NCCBC5 | Human | Breast | DCIS | 9.09e-05 | -1.48e-01 | 0.2046 |
| 5366 | PMAIP1 | P1 | Human | Breast | IDC | 1.23e-10 | -3.25e-01 | 0.1527 |
| Page: 1 2 3 4 5 6 7 8 |
| Tissue | Expression Dynamics | Abbreviation |
| Breast | 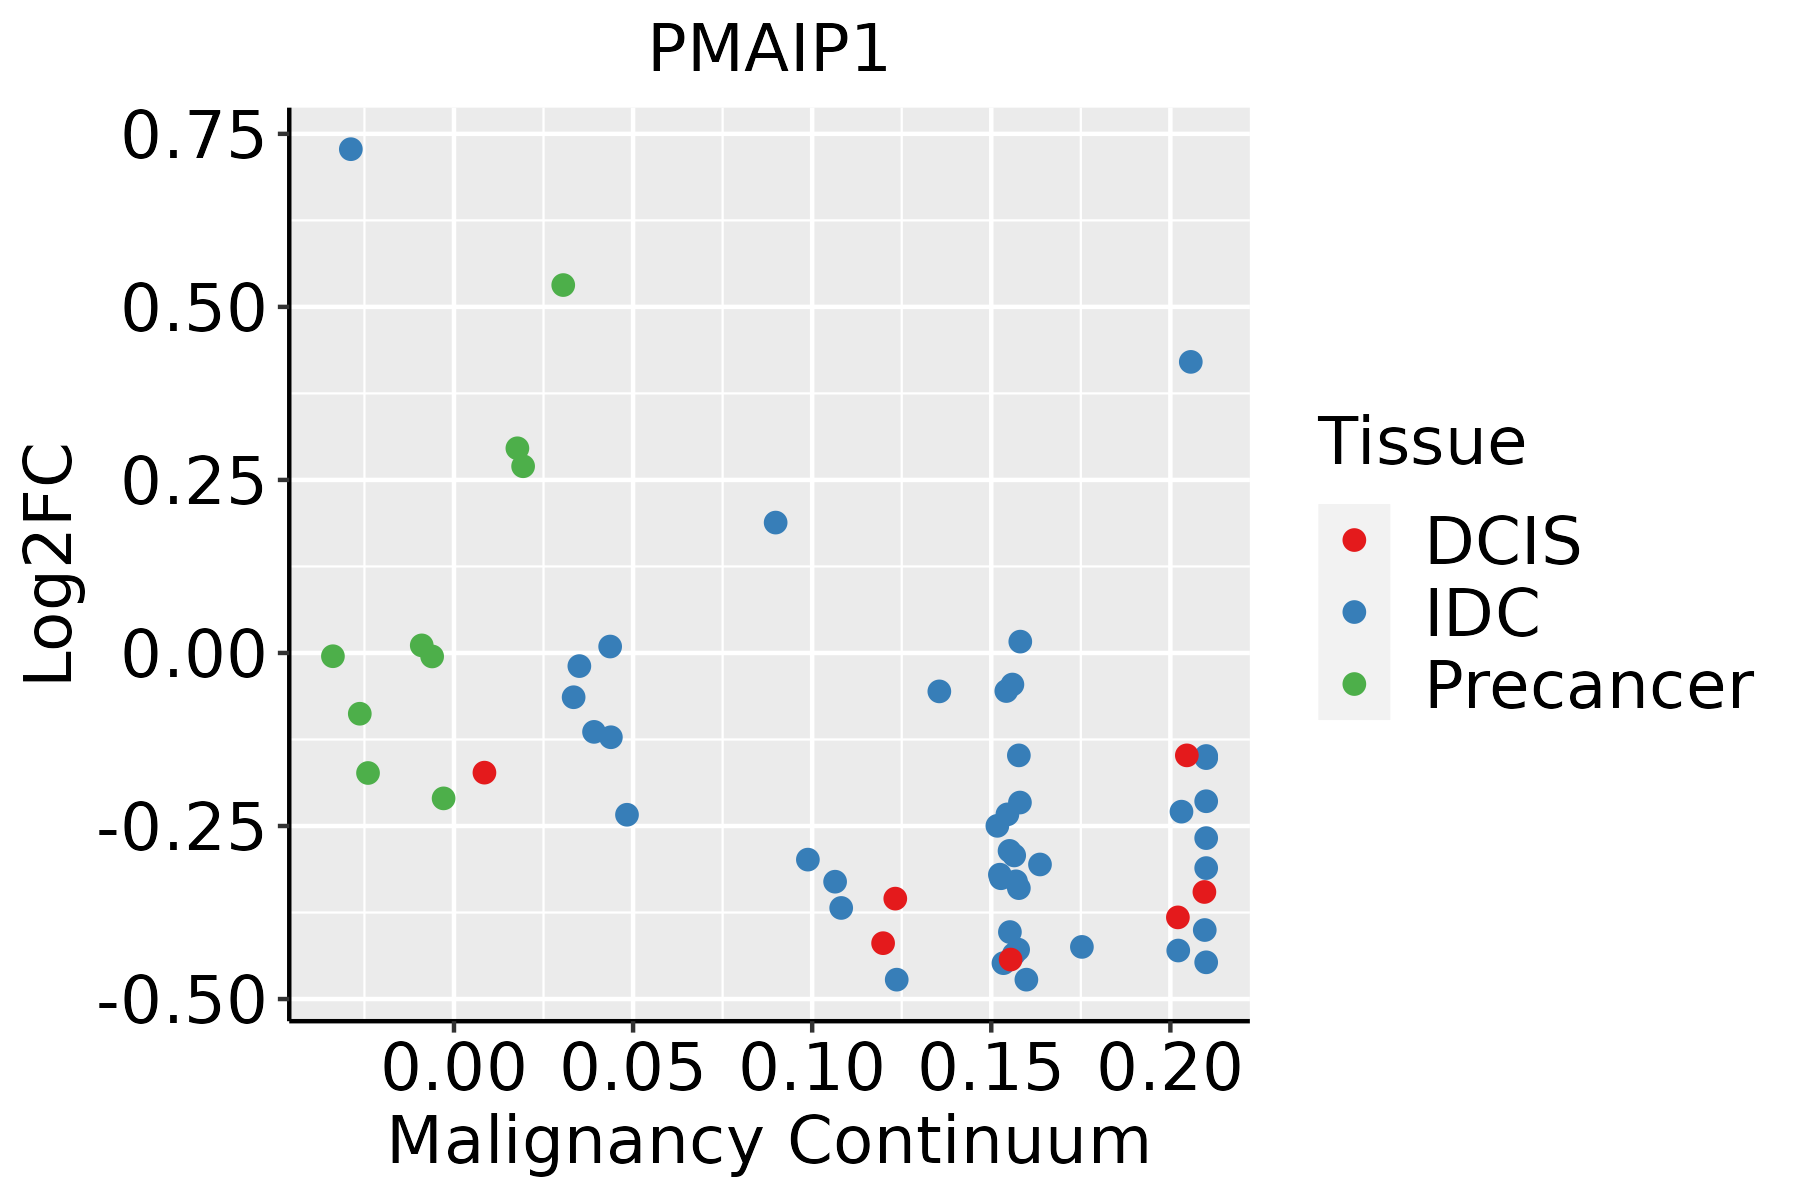 | IDC: Invasive ductal carcinoma |
| DCIS: Ductal carcinoma in situ | ||
| Precancer(BRCA1-mut): Precancerous lesion from BRCA1 mutation carriers | ||
| Cervix | 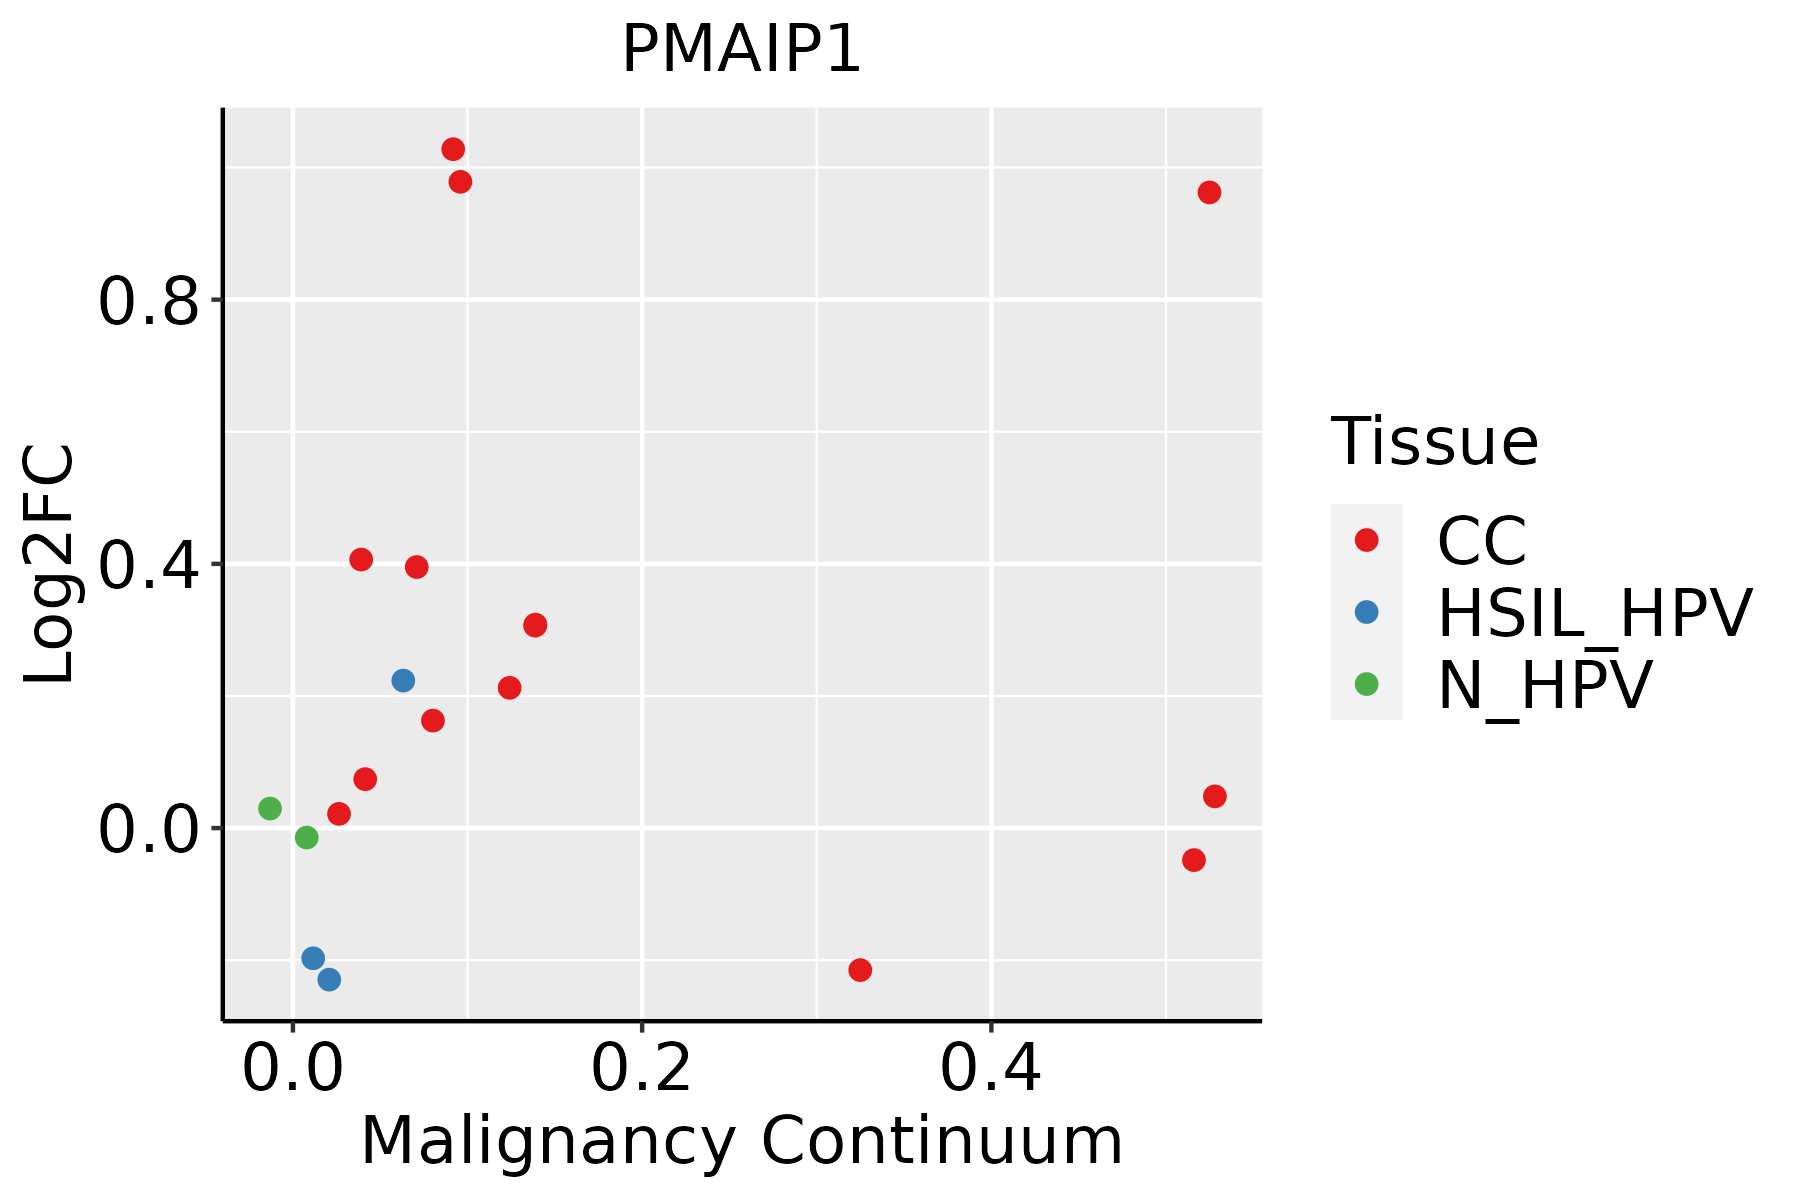 | CC: Cervix cancer |
| HSIL_HPV: HPV-infected high-grade squamous intraepithelial lesions | ||
| N_HPV: HPV-infected normal cervix | ||
| Esophagus |  | ESCC: Esophageal squamous cell carcinoma |
| HGIN: High-grade intraepithelial neoplasias | ||
| LGIN: Low-grade intraepithelial neoplasias | ||
| Lung | 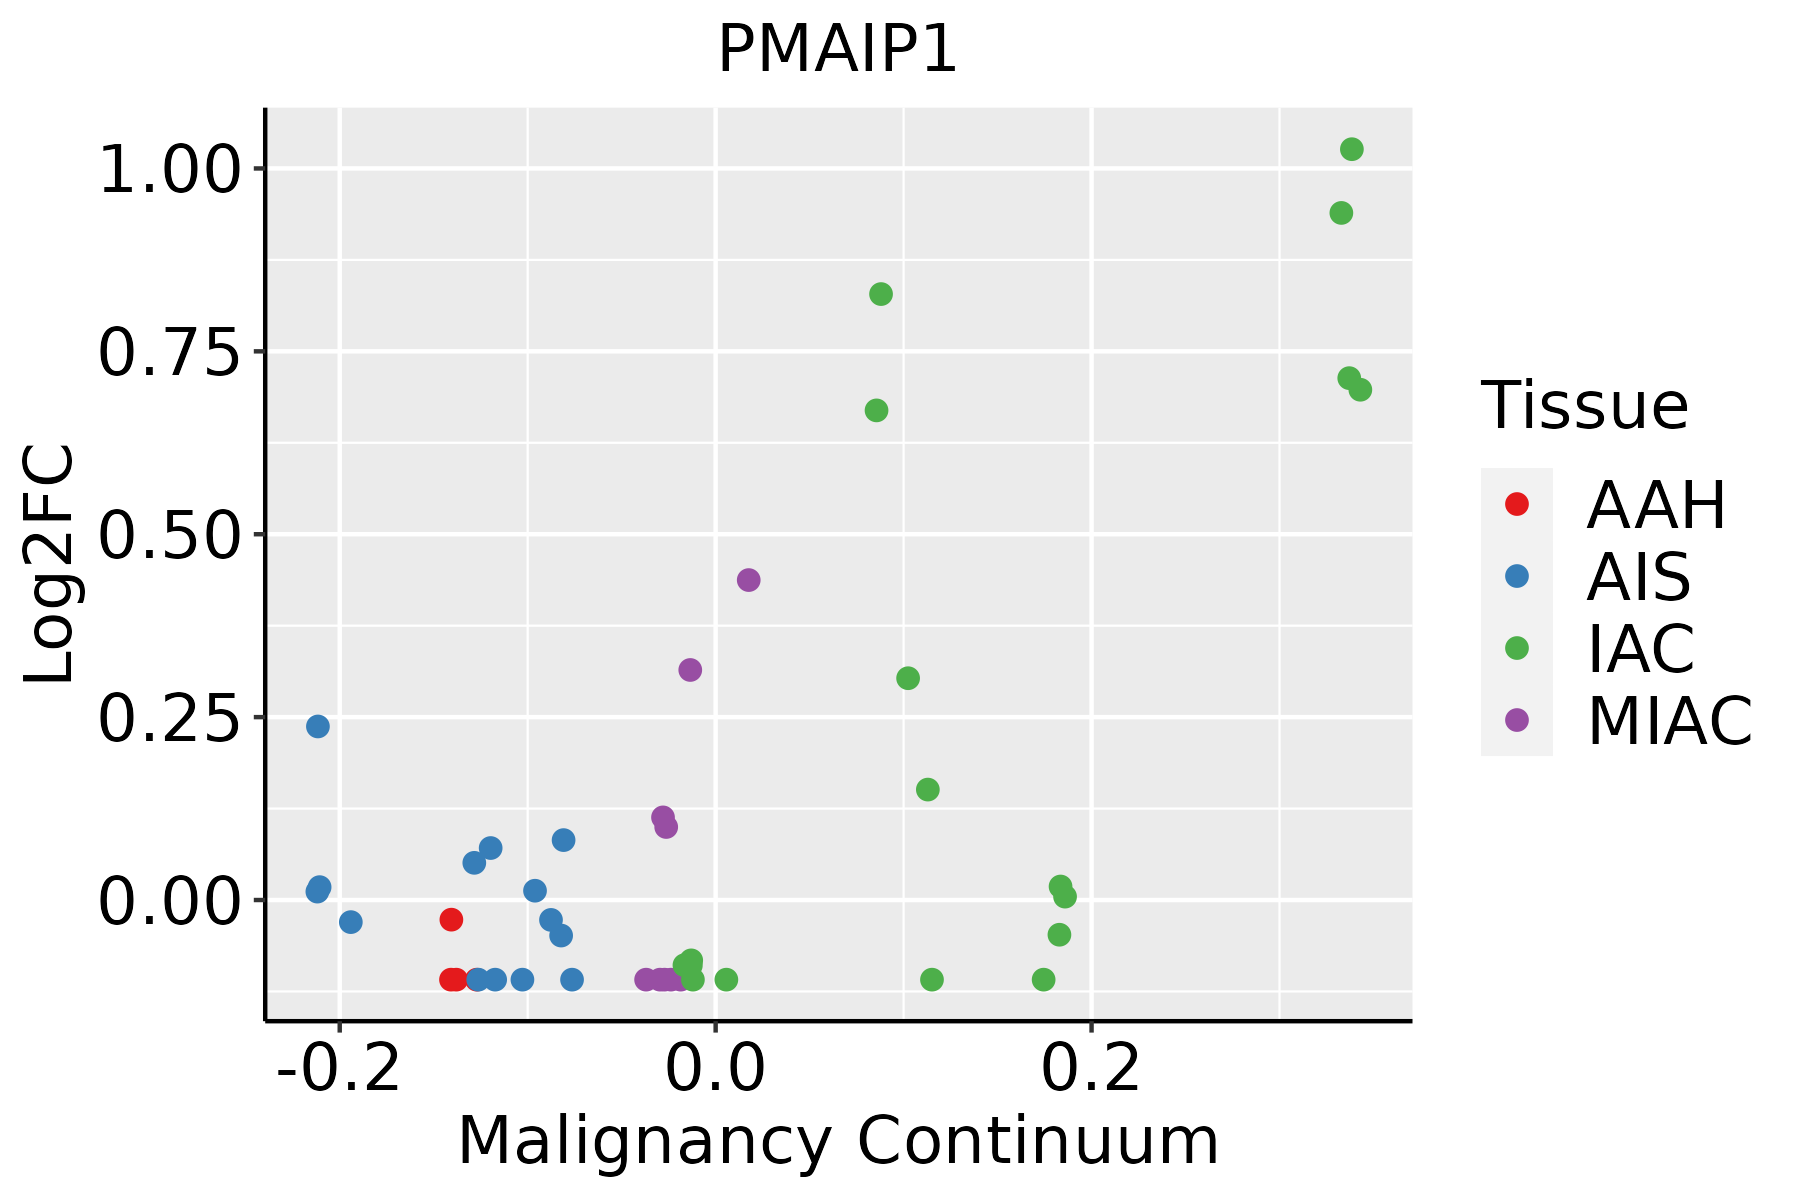 | AAH: Atypical adenomatous hyperplasia |
| AIS: Adenocarcinoma in situ | ||
| IAC: Invasive lung adenocarcinoma | ||
| MIA: Minimally invasive adenocarcinoma | ||
| Oral Cavity | 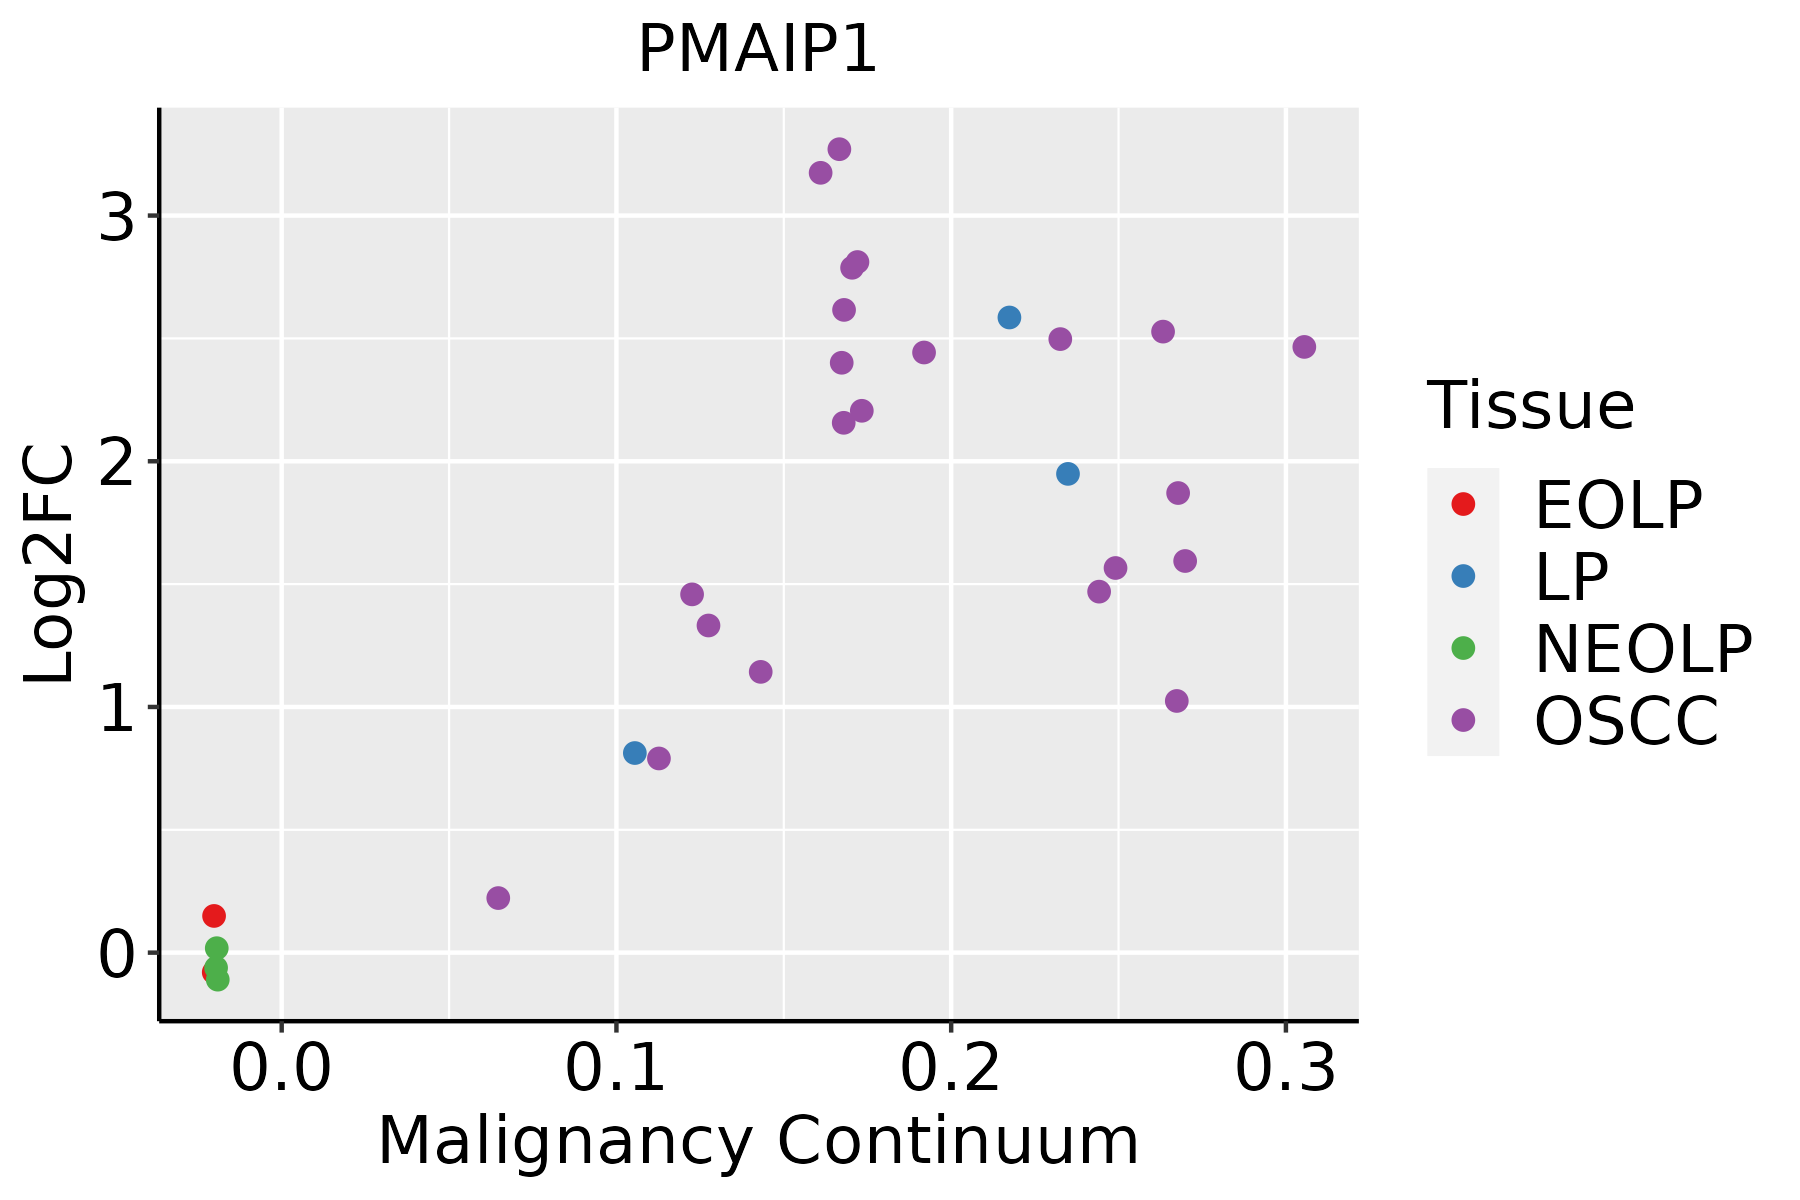 | EOLP: Erosive Oral lichen planus |
| LP: leukoplakia | ||
| NEOLP: Non-erosive oral lichen planus | ||
| OSCC: Oral squamous cell carcinoma | ||
| Prostate | 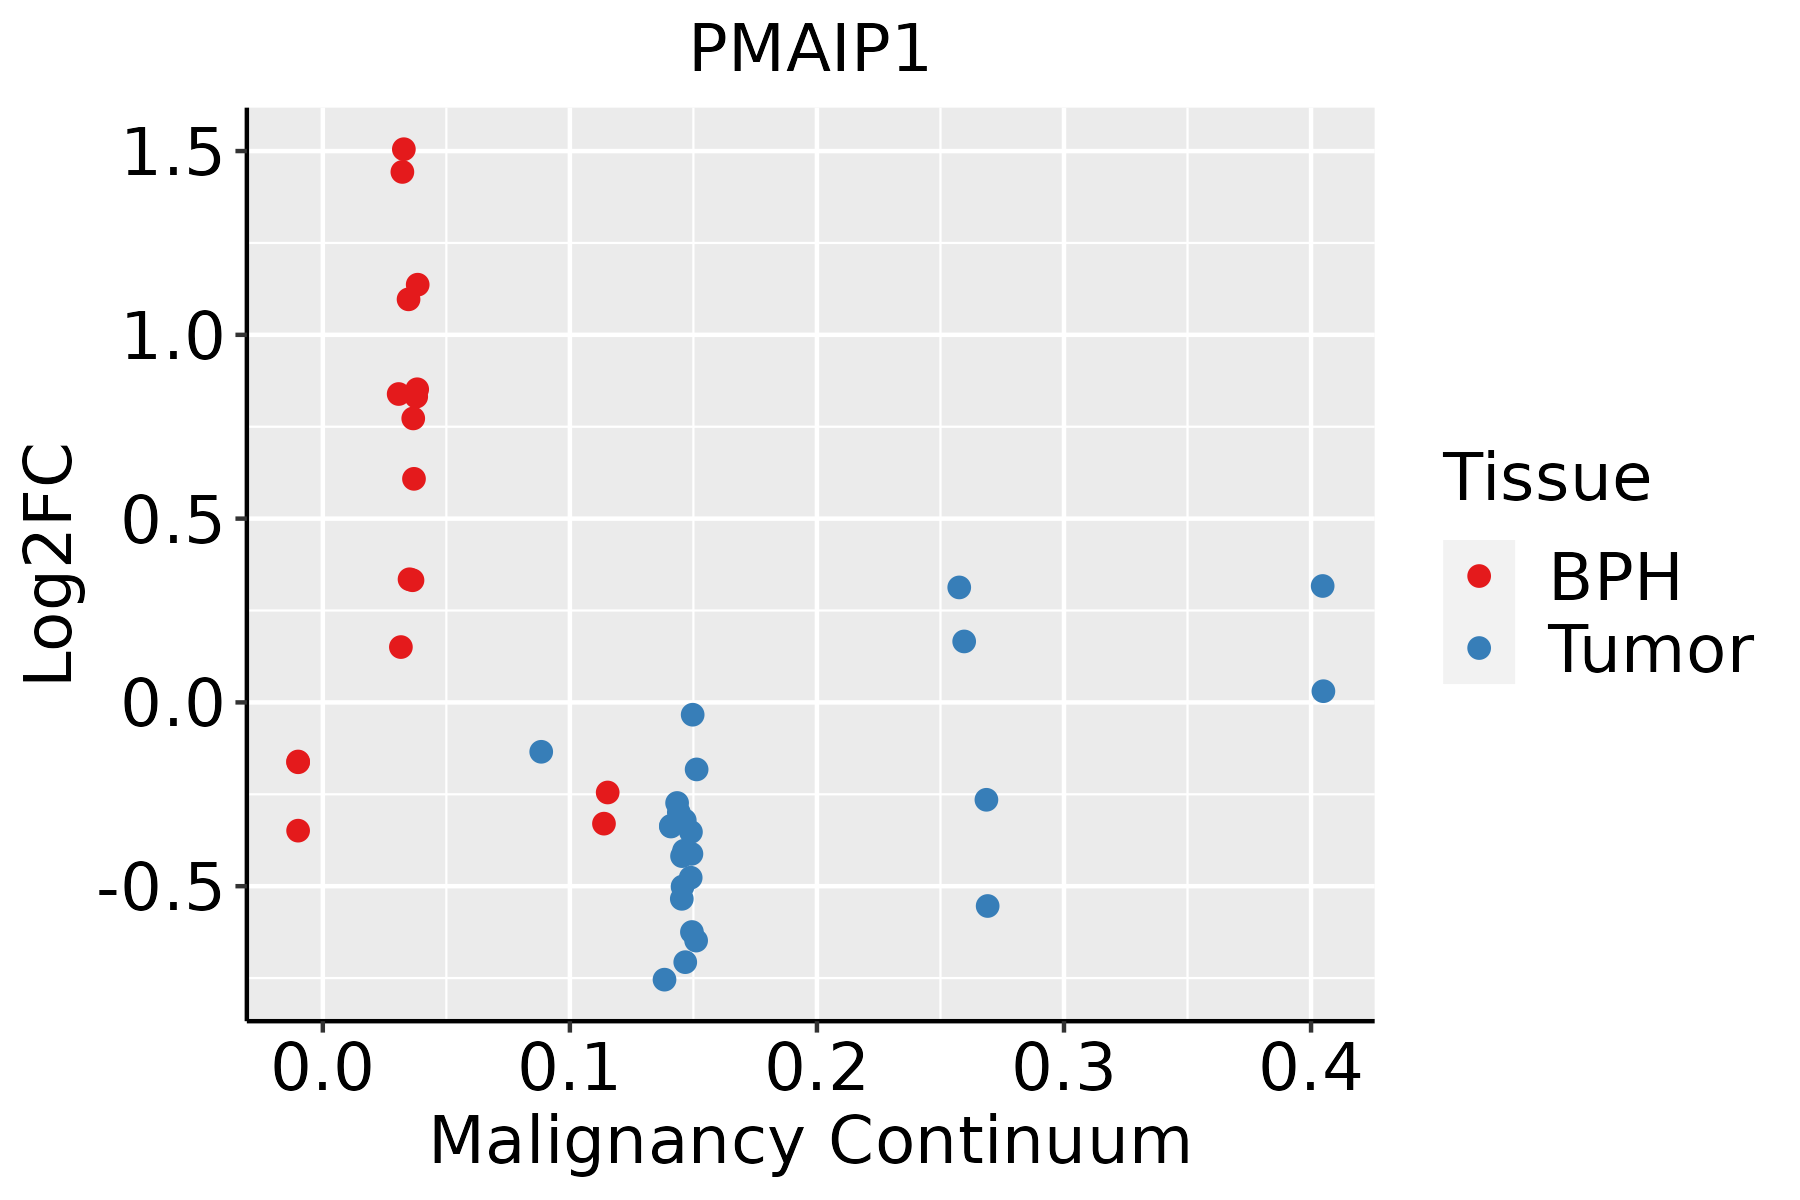 | BPH: Benign Prostatic Hyperplasia |
| Skin | 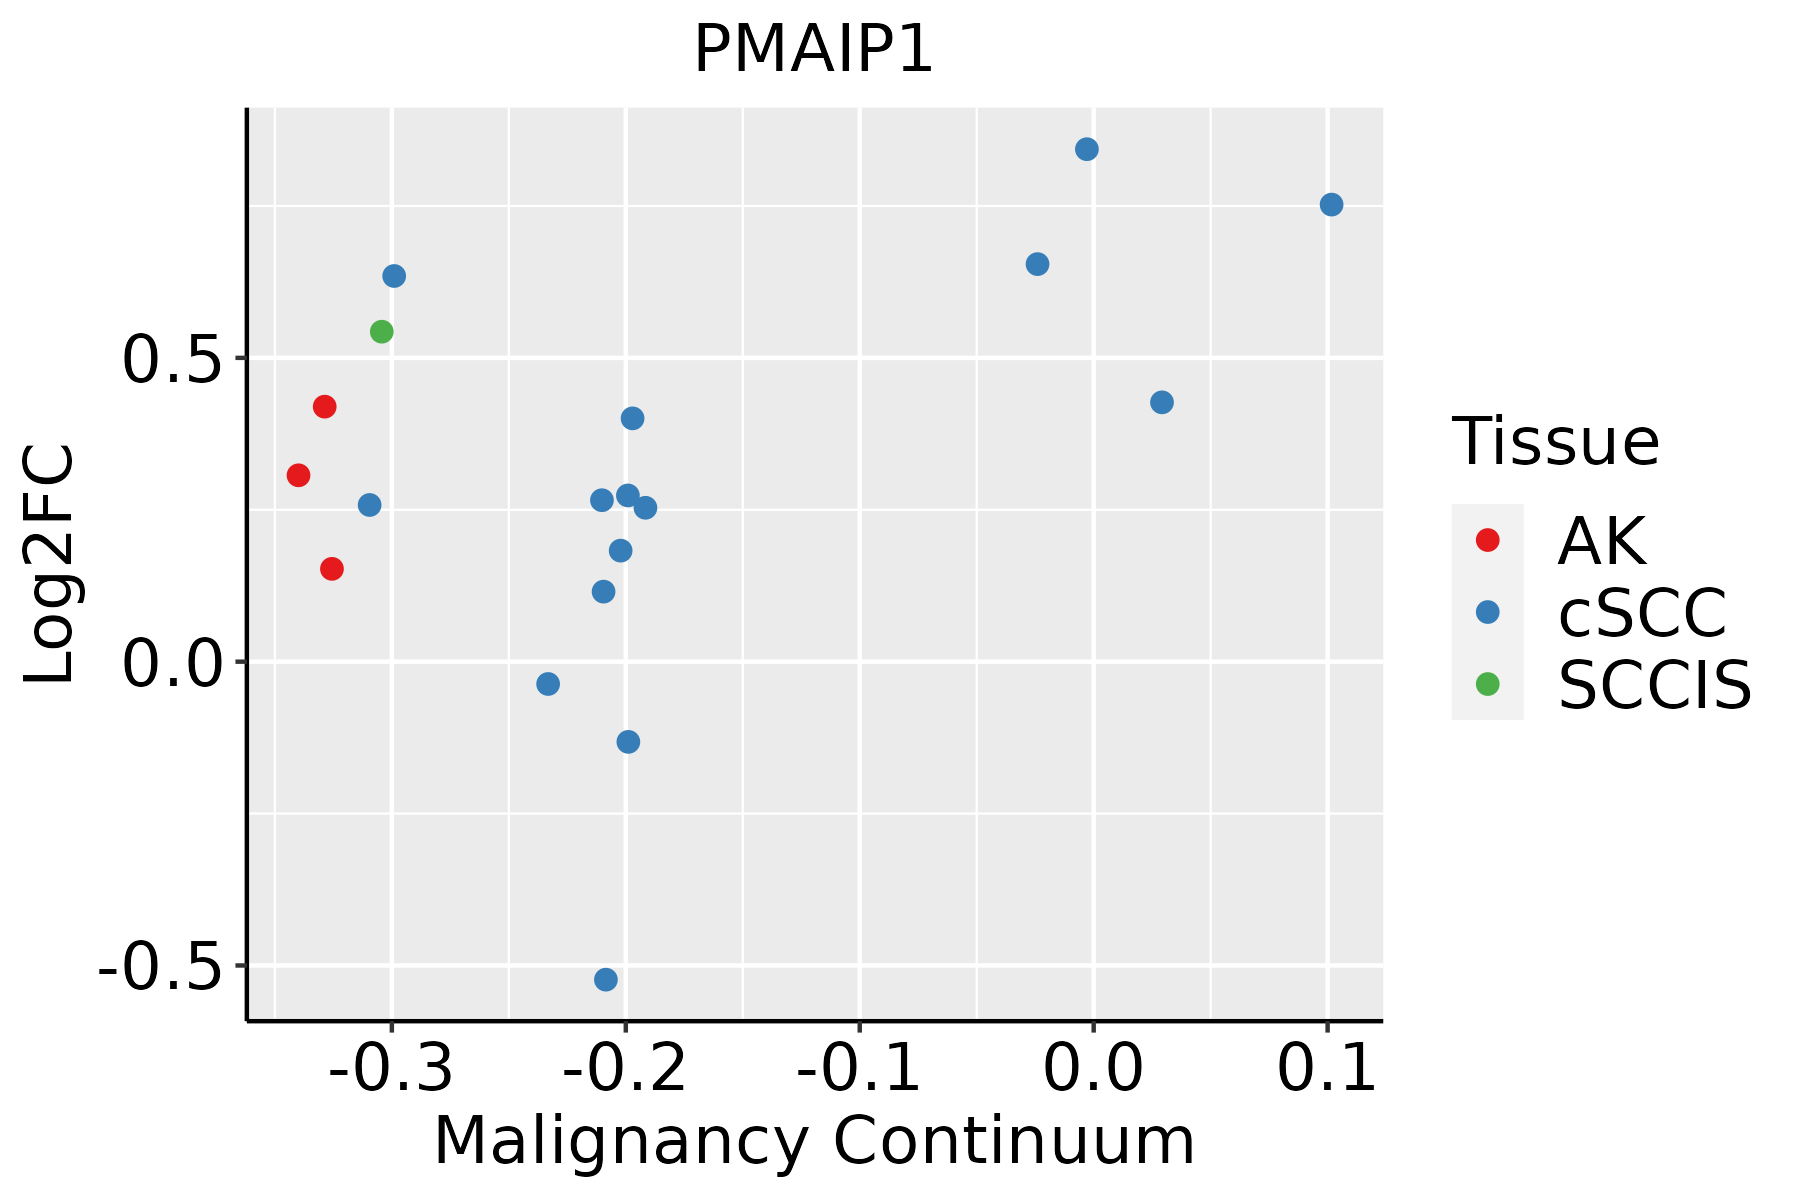 | AK: Actinic keratosis |
| cSCC: Cutaneous squamous cell carcinoma | ||
| SCCIS:squamous cell carcinoma in situ | ||
| Thyroid |  | ATC: Anaplastic thyroid cancer |
| HT: Hashimoto's thyroiditis | ||
| PTC: Papillary thyroid cancer |
| ∗log2FC in expression of this searched gene in stem-like cells from each diseased tissue sample relative to stem-like cells in normal samples in each tissue plotted against the malignancy continuum. Samples are colored based on if they are from different disease stage. |
Top |
Malignant transformation related pathway analysis |
| Find out the enriched GO biological processes and KEGG pathways involved in transition from healthy to precancer to cancer |
| Tissue | Disease Stage | Enriched GO biological Processes |
| Colorectum | AD |  |
| Colorectum | SER |  |
| Colorectum | MSS |  |
| Colorectum | MSI-H |  |
| Colorectum | FAP |  |
| ∗Top 15 enriched GO BP terms are showed in the bar plot of each disease state in each tissue. Each row represents a significant GO biological process which is colored according to the -log10(p.adjust). |
| Page: 1 2 3 4 5 6 7 8 9 |
| GO ID | Tissue | Disease Stage | Description | Gene Ratio | Bg Ratio | pvalue | p.adjust | Count |
| GO:004259417 | Oral cavity | LP | response to starvation | 71/4623 | 197/18723 | 2.36e-04 | 2.52e-03 | 71 |
| GO:000599613 | Oral cavity | LP | monosaccharide metabolic process | 86/4623 | 257/18723 | 9.13e-04 | 7.79e-03 | 86 |
| GO:003033019 | Oral cavity | LP | DNA damage response, signal transduction by p53 class mediator | 30/4623 | 72/18723 | 1.13e-03 | 9.27e-03 | 30 |
| GO:004277013 | Oral cavity | LP | signal transduction in response to DNA damage | 60/4623 | 172/18723 | 1.71e-03 | 1.31e-02 | 60 |
| GO:001931813 | Oral cavity | LP | hexose metabolic process | 78/4623 | 237/18723 | 2.55e-03 | 1.80e-02 | 78 |
| GO:0048872110 | Oral cavity | LP | homeostasis of number of cells | 87/4623 | 272/18723 | 3.75e-03 | 2.47e-02 | 87 |
| GO:190204116 | Oral cavity | LP | regulation of extrinsic apoptotic signaling pathway via death domain receptors | 21/4623 | 49/18723 | 4.00e-03 | 2.59e-02 | 21 |
| GO:000600614 | Oral cavity | LP | glucose metabolic process | 64/4623 | 196/18723 | 7.09e-03 | 3.98e-02 | 64 |
| GO:200123318 | Prostate | BPH | regulation of apoptotic signaling pathway | 134/3107 | 356/18723 | 5.06e-22 | 7.84e-19 | 134 |
| GO:009719318 | Prostate | BPH | intrinsic apoptotic signaling pathway | 110/3107 | 288/18723 | 7.36e-19 | 2.85e-16 | 110 |
| GO:001049818 | Prostate | BPH | proteasomal protein catabolic process | 153/3107 | 490/18723 | 4.13e-16 | 7.51e-14 | 153 |
| GO:003497618 | Prostate | BPH | response to endoplasmic reticulum stress | 95/3107 | 256/18723 | 1.54e-15 | 2.52e-13 | 95 |
| GO:200124218 | Prostate | BPH | regulation of intrinsic apoptotic signaling pathway | 70/3107 | 164/18723 | 2.34e-15 | 3.72e-13 | 70 |
| GO:004586218 | Prostate | BPH | positive regulation of proteolysis | 121/3107 | 372/18723 | 2.05e-14 | 2.44e-12 | 121 |
| GO:007233118 | Prostate | BPH | signal transduction by p53 class mediator | 64/3107 | 163/18723 | 3.51e-12 | 2.82e-10 | 64 |
| GO:007149618 | Prostate | BPH | cellular response to external stimulus | 102/3107 | 320/18723 | 8.99e-12 | 6.79e-10 | 102 |
| GO:009719118 | Prostate | BPH | extrinsic apoptotic signaling pathway | 77/3107 | 219/18723 | 1.67e-11 | 1.19e-09 | 77 |
| GO:005254718 | Prostate | BPH | regulation of peptidase activity | 133/3107 | 461/18723 | 2.08e-11 | 1.43e-09 | 133 |
| GO:200123618 | Prostate | BPH | regulation of extrinsic apoptotic signaling pathway | 59/3107 | 151/18723 | 3.07e-11 | 2.02e-09 | 59 |
| GO:007048217 | Prostate | BPH | response to oxygen levels | 104/3107 | 347/18723 | 3.13e-10 | 1.67e-08 | 104 |
| Page: 1 2 3 4 5 6 7 8 9 10 11 12 13 14 15 16 17 18 19 20 21 22 23 24 25 26 27 28 29 30 31 32 33 34 35 36 37 38 39 40 41 42 43 44 45 46 47 |
| Pathway ID | Tissue | Disease Stage | Description | Gene Ratio | Bg Ratio | pvalue | p.adjust | qvalue | Count |
| hsa042108 | Breast | Precancer | Apoptosis | 25/684 | 136/8465 | 7.61e-05 | 6.87e-04 | 5.26e-04 | 25 |
| hsa052036 | Breast | Precancer | Viral carcinogenesis | 27/684 | 204/8465 | 7.19e-03 | 4.06e-02 | 3.11e-02 | 27 |
| hsa0421013 | Breast | Precancer | Apoptosis | 25/684 | 136/8465 | 7.61e-05 | 6.87e-04 | 5.26e-04 | 25 |
| hsa0520312 | Breast | Precancer | Viral carcinogenesis | 27/684 | 204/8465 | 7.19e-03 | 4.06e-02 | 3.11e-02 | 27 |
| hsa0421022 | Breast | IDC | Apoptosis | 31/867 | 136/8465 | 1.34e-05 | 1.61e-04 | 1.20e-04 | 31 |
| hsa0520322 | Breast | IDC | Viral carcinogenesis | 34/867 | 204/8465 | 2.82e-03 | 1.86e-02 | 1.39e-02 | 34 |
| hsa041157 | Breast | IDC | p53 signaling pathway | 16/867 | 74/8465 | 2.86e-03 | 1.86e-02 | 1.39e-02 | 16 |
| hsa052109 | Breast | IDC | Colorectal cancer | 17/867 | 86/8465 | 5.70e-03 | 3.13e-02 | 2.34e-02 | 17 |
| hsa0421032 | Breast | IDC | Apoptosis | 31/867 | 136/8465 | 1.34e-05 | 1.61e-04 | 1.20e-04 | 31 |
| hsa0520332 | Breast | IDC | Viral carcinogenesis | 34/867 | 204/8465 | 2.82e-03 | 1.86e-02 | 1.39e-02 | 34 |
| hsa0411512 | Breast | IDC | p53 signaling pathway | 16/867 | 74/8465 | 2.86e-03 | 1.86e-02 | 1.39e-02 | 16 |
| hsa0521014 | Breast | IDC | Colorectal cancer | 17/867 | 86/8465 | 5.70e-03 | 3.13e-02 | 2.34e-02 | 17 |
| hsa0421041 | Breast | DCIS | Apoptosis | 29/846 | 136/8465 | 5.92e-05 | 5.97e-04 | 4.40e-04 | 29 |
| hsa0520341 | Breast | DCIS | Viral carcinogenesis | 34/846 | 204/8465 | 1.88e-03 | 1.27e-02 | 9.33e-03 | 34 |
| hsa0411521 | Breast | DCIS | p53 signaling pathway | 16/846 | 74/8465 | 2.23e-03 | 1.47e-02 | 1.08e-02 | 16 |
| hsa0521024 | Breast | DCIS | Colorectal cancer | 16/846 | 86/8465 | 1.03e-02 | 4.50e-02 | 3.32e-02 | 16 |
| hsa0421051 | Breast | DCIS | Apoptosis | 29/846 | 136/8465 | 5.92e-05 | 5.97e-04 | 4.40e-04 | 29 |
| hsa052035 | Breast | DCIS | Viral carcinogenesis | 34/846 | 204/8465 | 1.88e-03 | 1.27e-02 | 9.33e-03 | 34 |
| hsa0411531 | Breast | DCIS | p53 signaling pathway | 16/846 | 74/8465 | 2.23e-03 | 1.47e-02 | 1.08e-02 | 16 |
| hsa0521034 | Breast | DCIS | Colorectal cancer | 16/846 | 86/8465 | 1.03e-02 | 4.50e-02 | 3.32e-02 | 16 |
| Page: 1 2 3 4 |
Top |
Cell-cell communication analysis |
| Identification of potential cell-cell interactions between two cell types and their ligand-receptor pairs for different disease states |
| Ligand | Receptor | LRpair | Pathway | Tissue | Disease Stage |
| Page: 1 |
Top |
Single-cell gene regulatory network inference analysis |
| Find out the significant the regulons (TFs) and the target genes of each regulon across cell types for different disease states |
| TF | Cell Type | Tissue | Disease Stage | Target Gene | RSS | Regulon Activity |
| ∗The dot plots of a searched regulon are shown for all cell subpopulations in each disease state of each tissue based on the regulon specific score inferred using pySCENIC and by calculating the average expression. |
| Page: 1 |
Top |
Somatic mutation of malignant transformation related genes |
| Annotation of somatic variants for genes involved in malignant transformation |
| Hugo Symbol | Variant Class | Variant Classification | dbSNP RS | HGVSc | HGVSp | HGVSp Short | SWISSPROT | BIOTYPE | SIFT | PolyPhen | Tumor Sample Barcode | Tissue | Histology | Sex | Age | Stage | Therapy Types | Drugs | Outcome |
| PMAIP1 | SNV | Missense_Mutation | novel | c.4C>T | p.Pro2Ser | p.P2S | Q13794 | protein_coding | deleterious(0.01) | possibly_damaging(0.561) | TCGA-22-5479-01 | Lung | lung squamous cell carcinoma | Male | <65 | I/II | Chemotherapy | carboplatin | SD |
| PMAIP1 | SNV | Missense_Mutation | novel | c.97G>A | p.Gly33Arg | p.G33R | Q13794 | protein_coding | deleterious(0) | probably_damaging(1) | TCGA-CR-7383-01 | Oral cavity | head & neck squamous cell carcinoma | Female | >=65 | I/II | Chemotherapy | paclitaxel | PR |
| Page: 1 |
Top |
Related drugs of malignant transformation related genes |
| Identification of chemicals and drugs interact with genes involved in malignant transfromation |
| (DGIdb 4.0) |
| Entrez ID | Symbol | Category | Interaction Types | Drug Claim Name | Drug Name | PMIDs |
| 5366 | PMAIP1 | CLINICALLY ACTIONABLE | BORTEZOMIB | BORTEZOMIB | 16024631 |
| Page: 1 |

Copyright 2023-Present -The University of Texas Health Science Center at Houston |