
|
|||||
|
 | |
| |
| |
| |
| |
| |
|
Gene: PLEC |
Gene summary for PLEC |
| Gene information | Species | Human | Gene symbol | PLEC | Gene ID | 5339 |
| Gene name | plectin | |
| Gene Alias | EBS1 | |
| Cytomap | 8q24.3 | |
| Gene Type | protein-coding | GO ID | GO:0000902 | UniProtAcc | Q15149 |
Top |
Malignant transformation analysis |
| Identification of the aberrant gene expression in precancerous and cancerous lesions by comparing the gene expression of stem-like cells in diseased tissues with normal stem cells |
| Entrez ID | Symbol | Replicates | Species | Organ | Tissue | Adj P-value | Log2FC | Malignancy |
| 5339 | PLEC | HTA11_3410_2000001011 | Human | Colorectum | AD | 2.08e-04 | 1.89e-01 | 0.0155 |
| 5339 | PLEC | HTA11_2487_2000001011 | Human | Colorectum | SER | 1.71e-29 | 1.45e+00 | -0.1808 |
| 5339 | PLEC | HTA11_1938_2000001011 | Human | Colorectum | AD | 3.33e-10 | 6.94e-01 | -0.0811 |
| 5339 | PLEC | HTA11_78_2000001011 | Human | Colorectum | AD | 4.24e-03 | 3.71e-01 | -0.1088 |
| 5339 | PLEC | HTA11_347_2000001011 | Human | Colorectum | AD | 5.76e-22 | 6.54e-01 | -0.1954 |
| 5339 | PLEC | HTA11_411_2000001011 | Human | Colorectum | SER | 2.24e-08 | 1.69e+00 | -0.2602 |
| 5339 | PLEC | HTA11_2112_2000001011 | Human | Colorectum | SER | 1.17e-06 | 1.25e+00 | -0.2196 |
| 5339 | PLEC | HTA11_3361_2000001011 | Human | Colorectum | AD | 1.56e-09 | 7.41e-01 | -0.1207 |
| 5339 | PLEC | HTA11_696_2000001011 | Human | Colorectum | AD | 3.82e-13 | 6.87e-01 | -0.1464 |
| 5339 | PLEC | HTA11_866_2000001011 | Human | Colorectum | AD | 1.92e-05 | 3.40e-01 | -0.1001 |
| 5339 | PLEC | HTA11_1391_2000001011 | Human | Colorectum | AD | 1.86e-09 | 6.64e-01 | -0.059 |
| 5339 | PLEC | HTA11_5212_2000001011 | Human | Colorectum | AD | 2.26e-02 | 4.57e-01 | -0.2061 |
| 5339 | PLEC | HTA11_8622_2000001021 | Human | Colorectum | SER | 3.41e-02 | 4.13e-01 | 0.0528 |
| 5339 | PLEC | HTA11_10623_2000001011 | Human | Colorectum | AD | 1.76e-02 | 6.26e-01 | -0.0177 |
| 5339 | PLEC | HTA11_7696_3000711011 | Human | Colorectum | AD | 7.02e-10 | 4.81e-01 | 0.0674 |
| 5339 | PLEC | HTA11_7469_2000001011 | Human | Colorectum | AD | 6.23e-06 | 6.30e-01 | -0.0124 |
| 5339 | PLEC | HTA11_99999971662_82457 | Human | Colorectum | MSS | 1.36e-15 | 7.26e-01 | 0.3859 |
| 5339 | PLEC | HTA11_99999974143_84620 | Human | Colorectum | MSS | 8.10e-10 | 4.77e-01 | 0.3005 |
| 5339 | PLEC | A015-C-203 | Human | Colorectum | FAP | 5.95e-04 | 1.32e-01 | -0.1294 |
| 5339 | PLEC | A015-C-104 | Human | Colorectum | FAP | 9.51e-05 | 1.01e-01 | -0.1899 |
| Page: 1 2 3 4 5 6 7 8 9 10 |
| Tissue | Expression Dynamics | Abbreviation |
| Colorectum (GSE201348) | 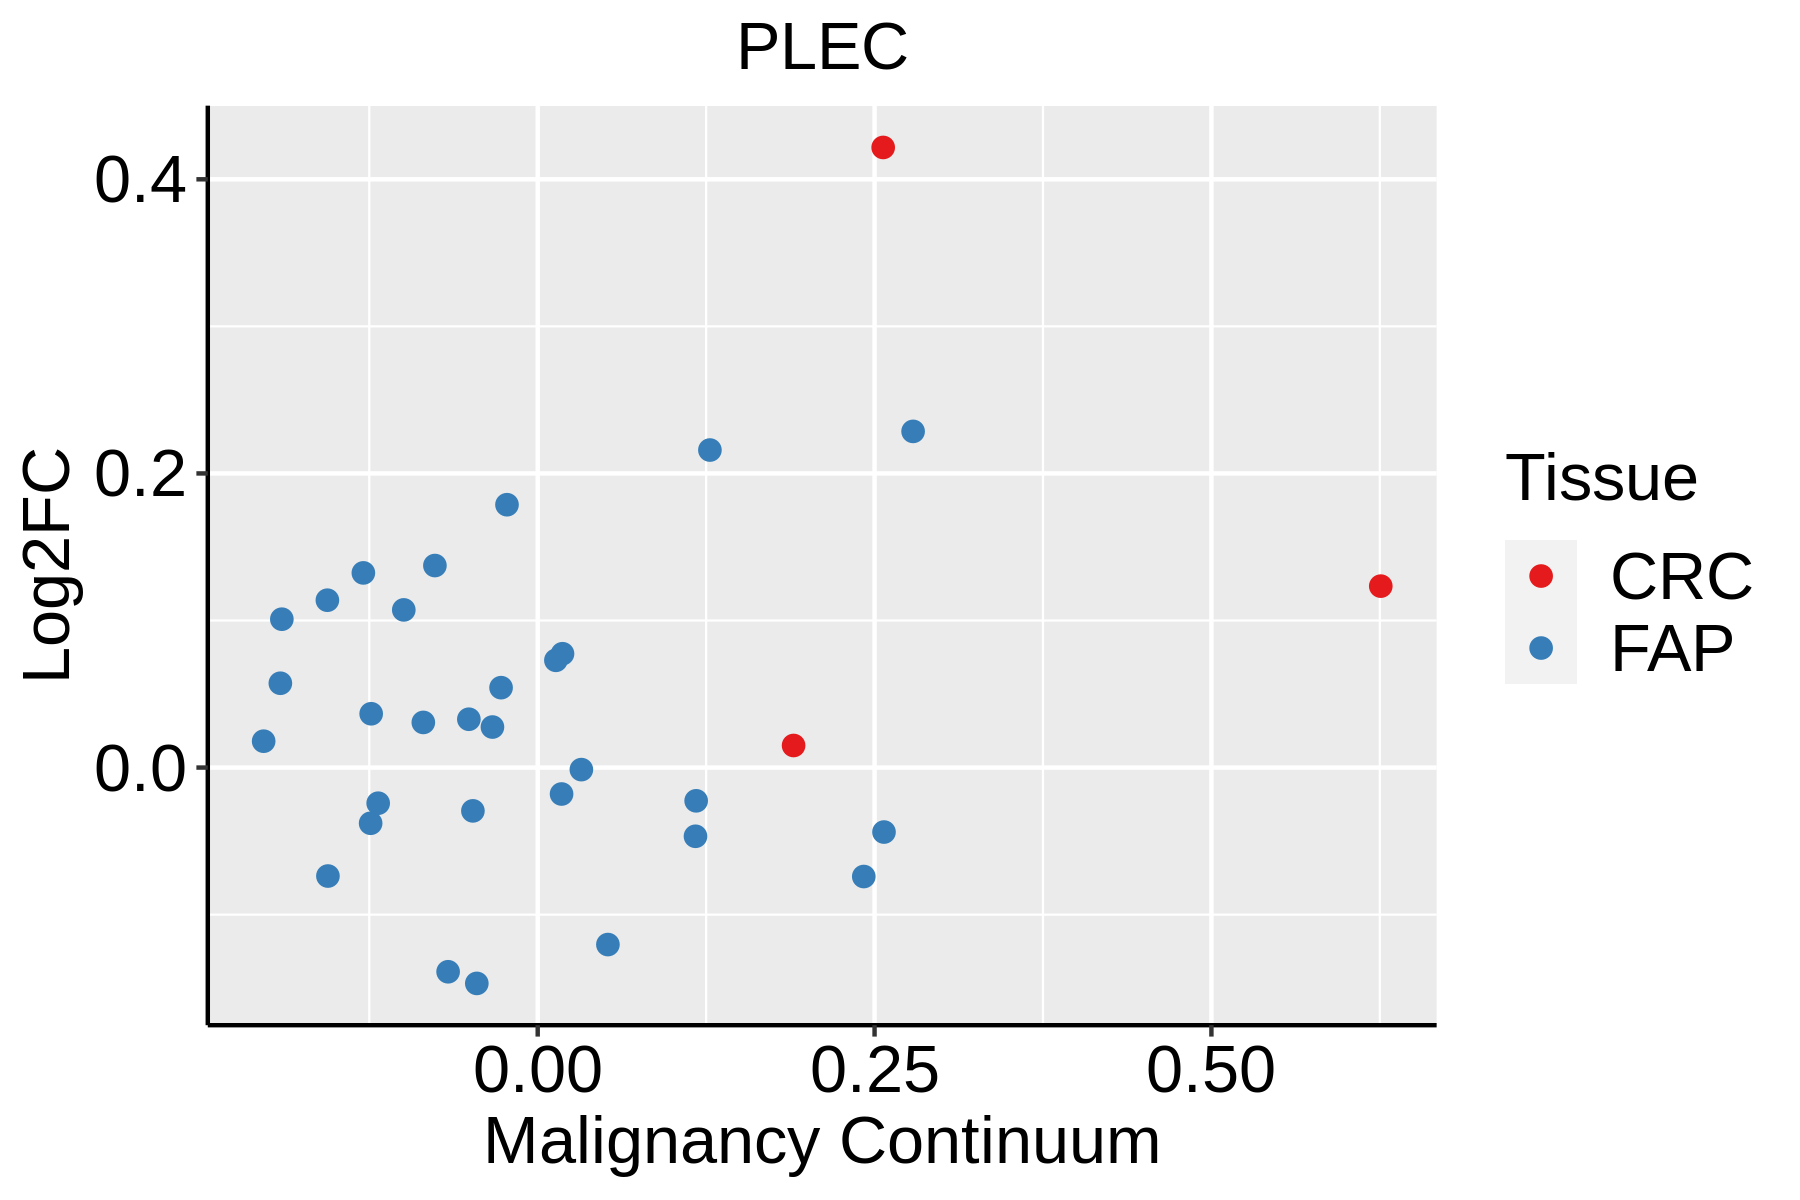 | FAP: Familial adenomatous polyposis |
| CRC: Colorectal cancer | ||
| Colorectum (HTA11) |  | AD: Adenomas |
| SER: Sessile serrated lesions | ||
| MSI-H: Microsatellite-high colorectal cancer | ||
| MSS: Microsatellite stable colorectal cancer | ||
| Esophagus | 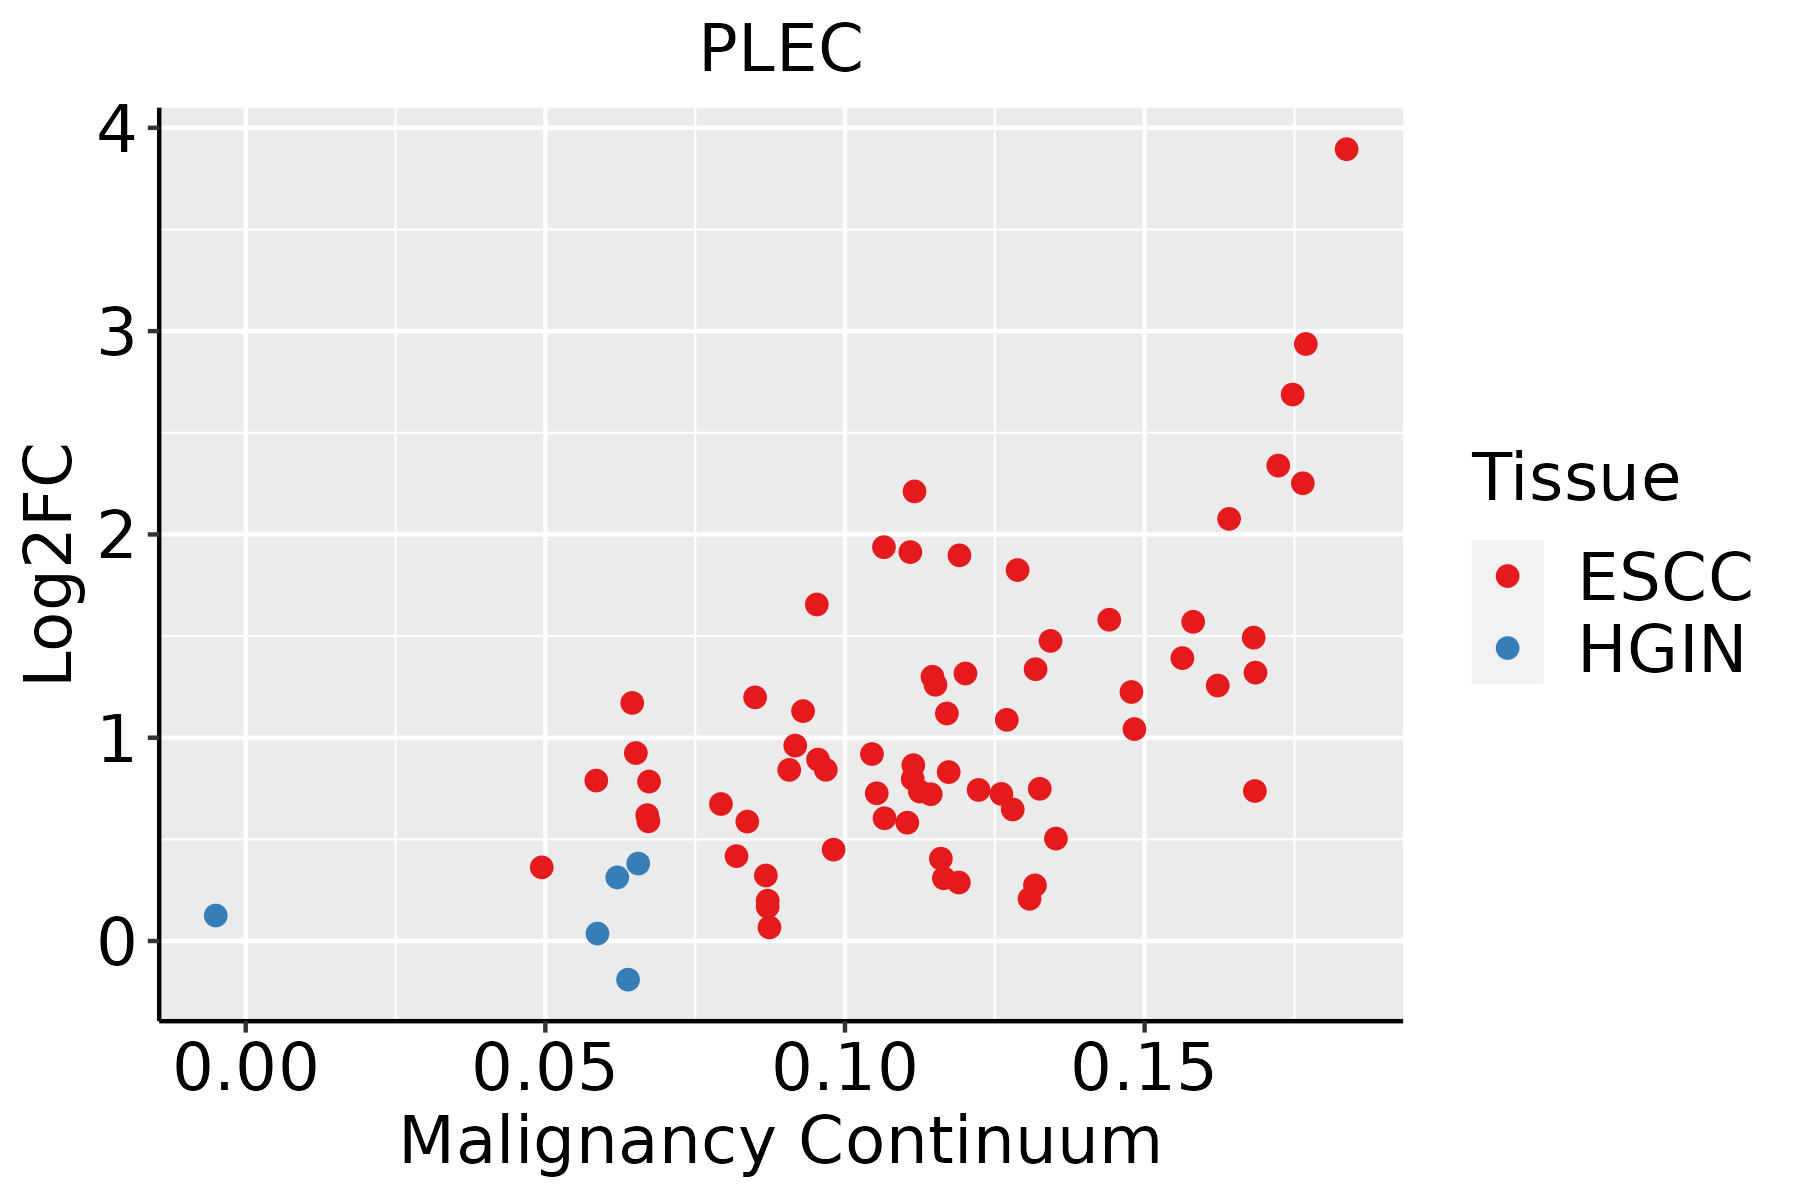 | ESCC: Esophageal squamous cell carcinoma |
| HGIN: High-grade intraepithelial neoplasias | ||
| LGIN: Low-grade intraepithelial neoplasias | ||
| GC | 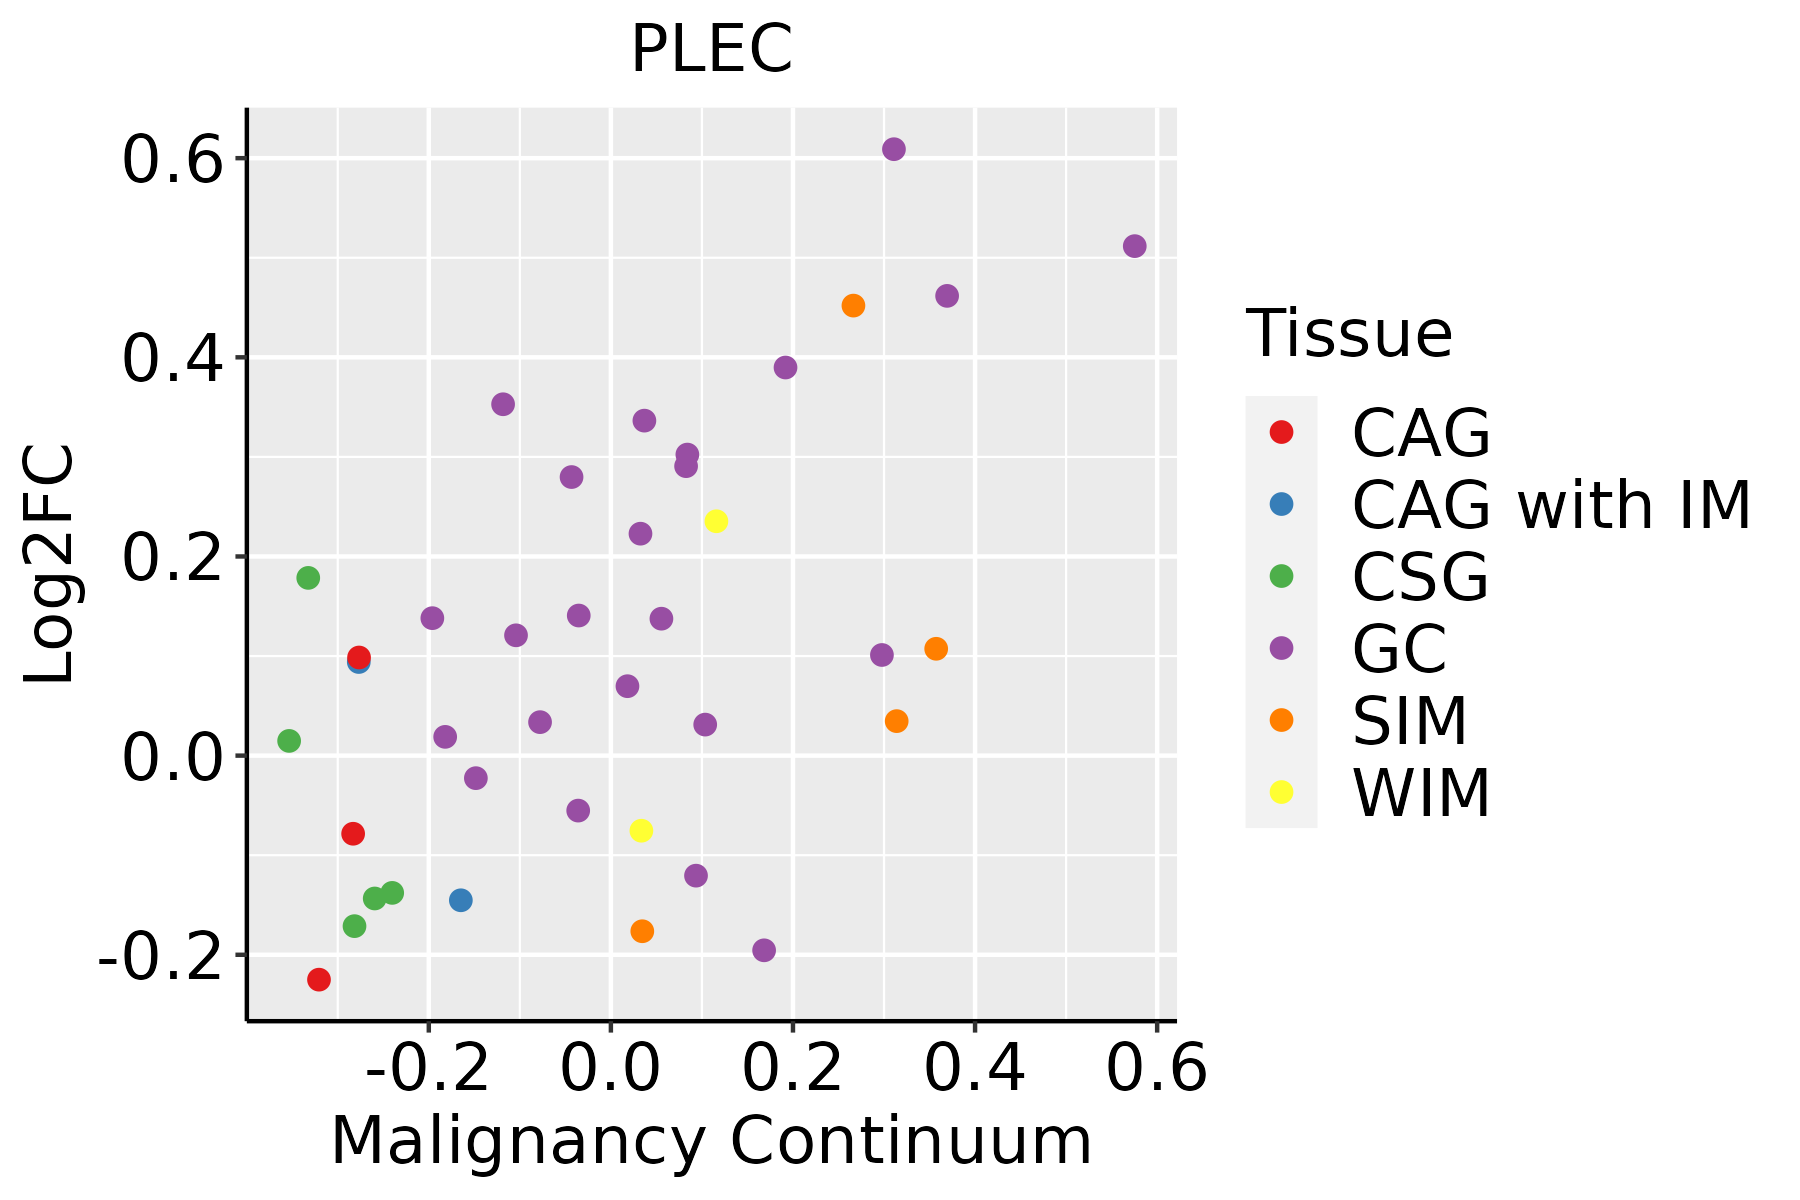 | CAG: Chronic atrophic gastritis |
| CAG with IM: Chronic atrophic gastritis with intestinal metaplasia | ||
| CSG: Chronic superficial gastritis | ||
| GC: Gastric cancer | ||
| SIM: Severe intestinal metaplasia | ||
| WIM: Wild intestinal metaplasia | ||
| Liver |  | HCC: Hepatocellular carcinoma |
| NAFLD: Non-alcoholic fatty liver disease | ||
| Oral Cavity | 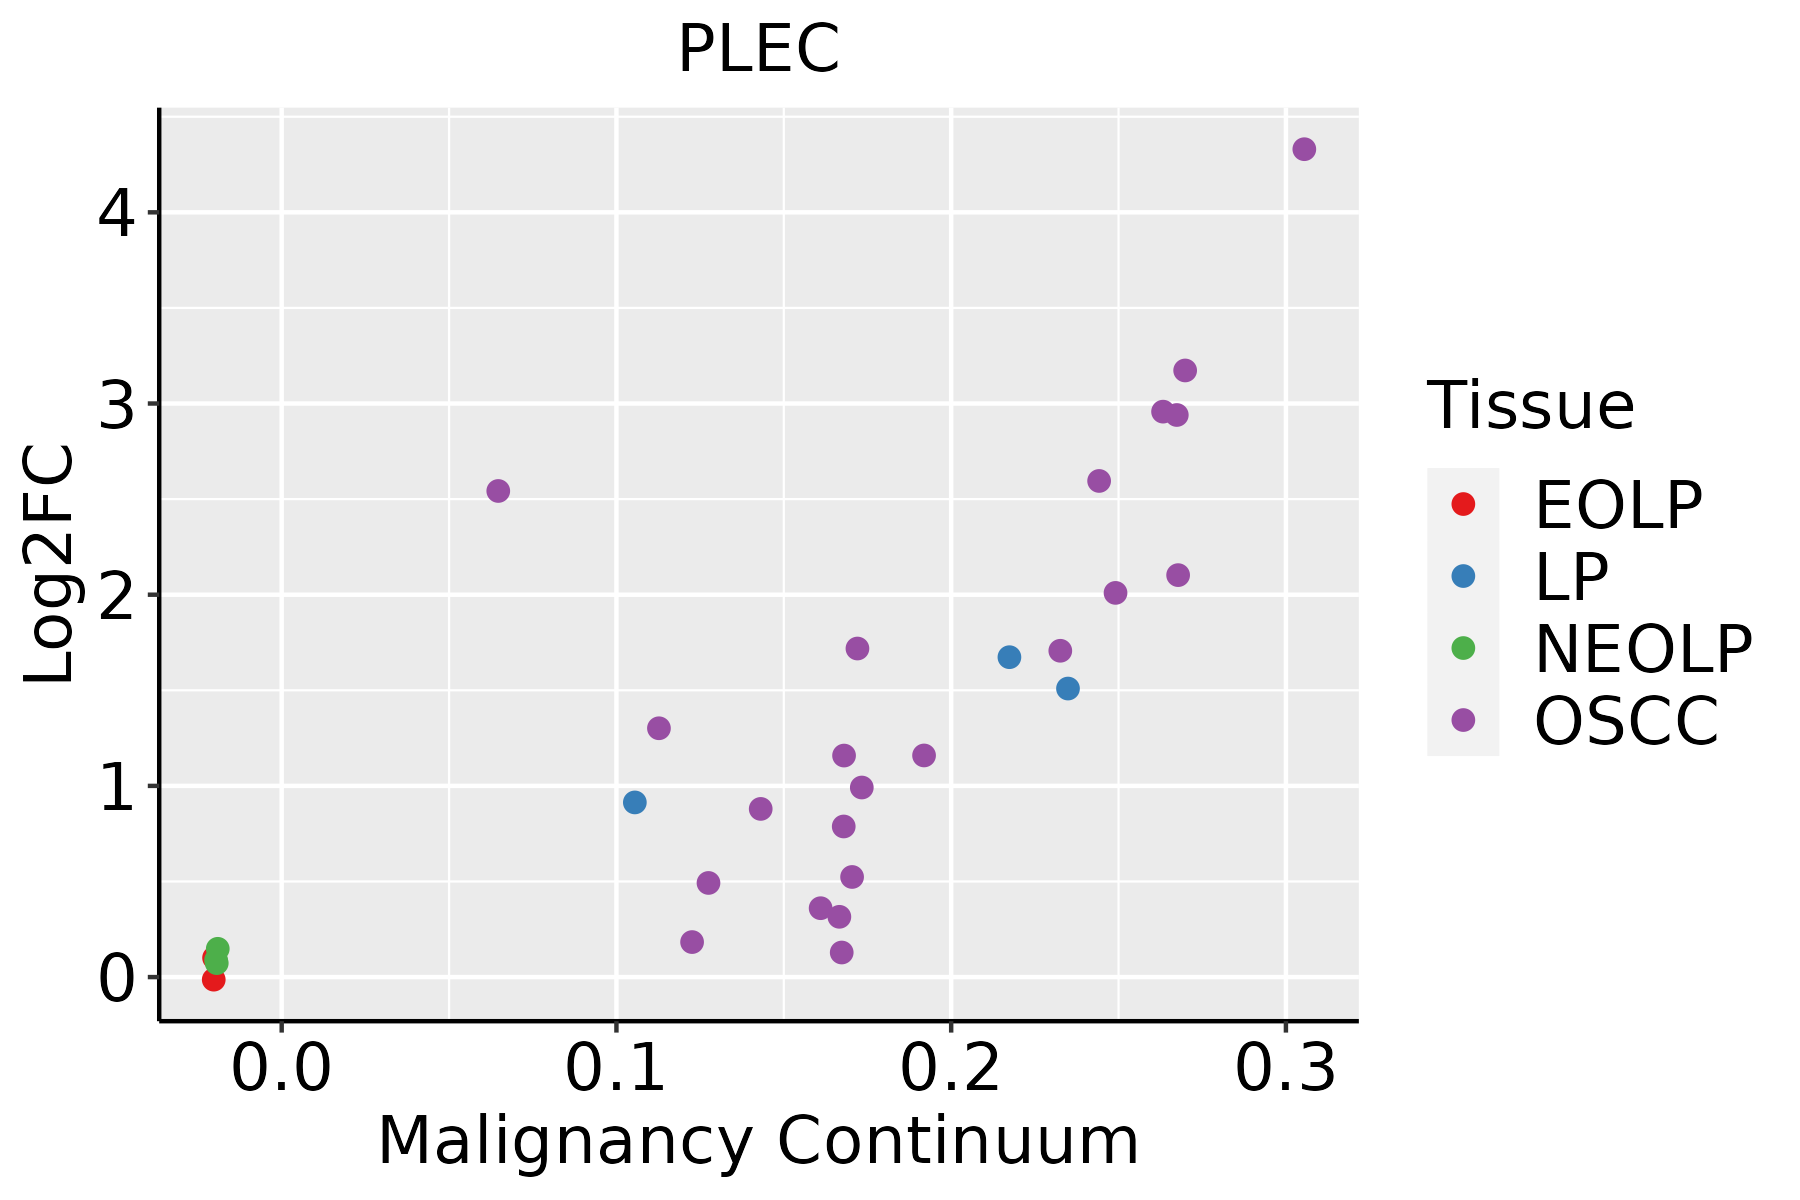 | EOLP: Erosive Oral lichen planus |
| LP: leukoplakia | ||
| NEOLP: Non-erosive oral lichen planus | ||
| OSCC: Oral squamous cell carcinoma | ||
| Prostate |  | BPH: Benign Prostatic Hyperplasia |
| Skin |  | AK: Actinic keratosis |
| cSCC: Cutaneous squamous cell carcinoma | ||
| SCCIS:squamous cell carcinoma in situ | ||
| Thyroid | 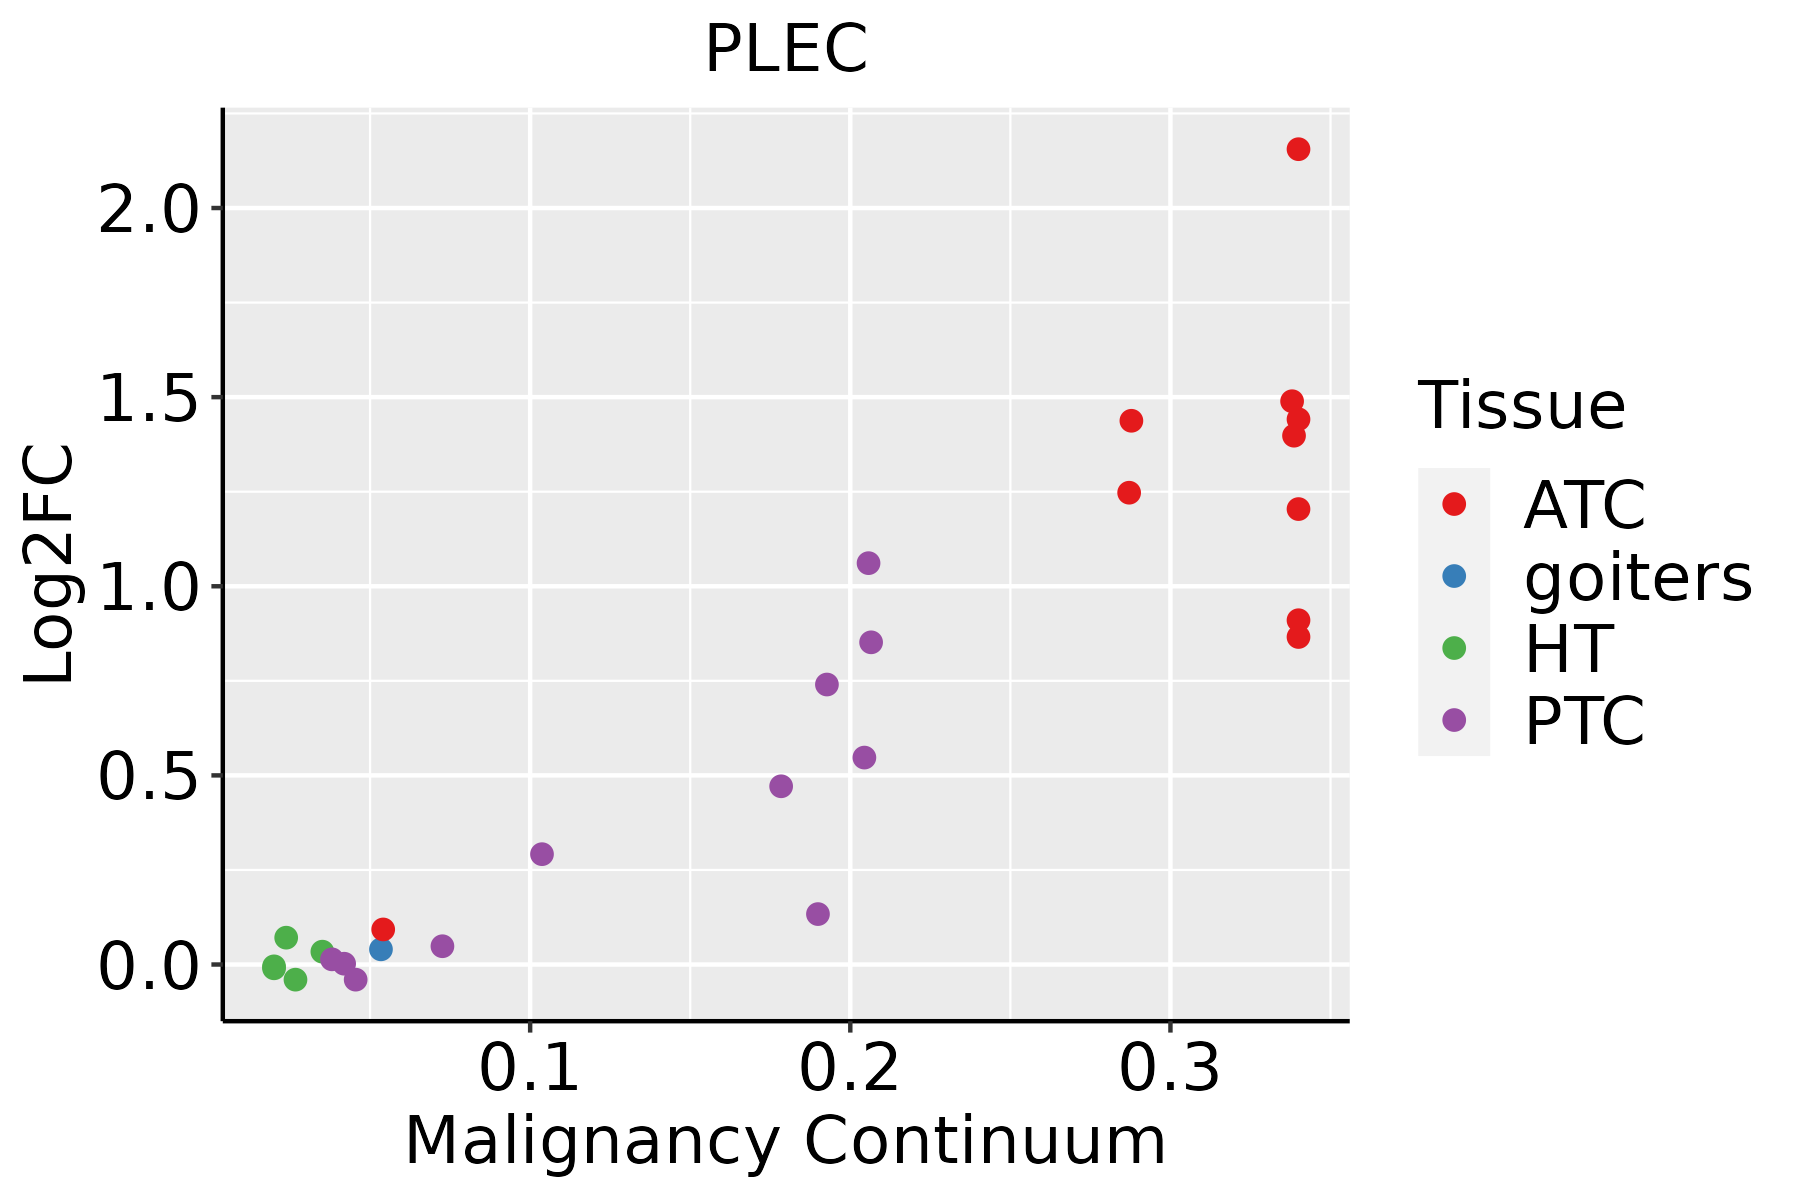 | ATC: Anaplastic thyroid cancer |
| HT: Hashimoto's thyroiditis | ||
| PTC: Papillary thyroid cancer |
| ∗log2FC in expression of this searched gene in stem-like cells from each diseased tissue sample relative to stem-like cells in normal samples in each tissue plotted against the malignancy continuum. Samples are colored based on if they are from different disease stage. |
Top |
Malignant transformation related pathway analysis |
| Find out the enriched GO biological processes and KEGG pathways involved in transition from healthy to precancer to cancer |
| Tissue | Disease Stage | Enriched GO biological Processes |
| Colorectum | AD |  |
| Colorectum | SER |  |
| Colorectum | MSS |  |
| Colorectum | MSI-H |  |
| Colorectum | FAP |  |
| ∗Top 15 enriched GO BP terms are showed in the bar plot of each disease state in each tissue. Each row represents a significant GO biological process which is colored according to the -log10(p.adjust). |
| Page: 1 2 3 4 5 6 7 8 9 |
| GO ID | Tissue | Disease Stage | Description | Gene Ratio | Bg Ratio | pvalue | p.adjust | Count |
| GO:00616404 | Prostate | BPH | cytoskeleton-dependent cytokinesis | 31/3107 | 100/18723 | 2.63e-04 | 2.06e-03 | 31 |
| GO:005087817 | Prostate | BPH | regulation of body fluid levels | 89/3107 | 379/18723 | 3.08e-04 | 2.37e-03 | 89 |
| GO:00069972 | Prostate | BPH | nucleus organization | 38/3107 | 133/18723 | 3.69e-04 | 2.72e-03 | 38 |
| GO:00712604 | Prostate | BPH | cellular response to mechanical stimulus | 26/3107 | 81/18723 | 4.39e-04 | 3.16e-03 | 26 |
| GO:00096129 | Prostate | BPH | response to mechanical stimulus | 55/3107 | 216/18723 | 5.61e-04 | 3.91e-03 | 55 |
| GO:00099138 | Prostate | BPH | epidermal cell differentiation | 52/3107 | 202/18723 | 5.95e-04 | 4.11e-03 | 52 |
| GO:00426926 | Prostate | BPH | muscle cell differentiation | 88/3107 | 384/18723 | 7.59e-04 | 5.01e-03 | 88 |
| GO:01201939 | Prostate | BPH | tight junction organization | 25/3107 | 80/18723 | 8.72e-04 | 5.62e-03 | 25 |
| GO:00325064 | Prostate | BPH | cytokinetic process | 15/3107 | 39/18723 | 8.91e-04 | 5.72e-03 | 15 |
| GO:00302165 | Prostate | BPH | keratinocyte differentiation | 38/3107 | 139/18723 | 9.35e-04 | 5.92e-03 | 38 |
| GO:00107617 | Prostate | BPH | fibroblast migration | 17/3107 | 47/18723 | 9.41e-04 | 5.94e-03 | 17 |
| GO:00011018 | Prostate | BPH | response to acid chemical | 37/3107 | 135/18723 | 1.03e-03 | 6.46e-03 | 37 |
| GO:00352645 | Prostate | BPH | multicellular organism growth | 36/3107 | 132/18723 | 1.31e-03 | 7.90e-03 | 36 |
| GO:0035051 | Prostate | BPH | cardiocyte differentiation | 40/3107 | 156/18723 | 2.58e-03 | 1.38e-02 | 40 |
| GO:00308668 | Prostate | BPH | cortical actin cytoskeleton organization | 14/3107 | 40/18723 | 3.68e-03 | 1.85e-02 | 14 |
| GO:00420634 | Prostate | BPH | gliogenesis | 68/3107 | 301/18723 | 4.06e-03 | 2.02e-02 | 68 |
| GO:00714984 | Prostate | BPH | cellular response to fluid shear stress | 9/3107 | 21/18723 | 4.10e-03 | 2.03e-02 | 9 |
| GO:00454452 | Prostate | BPH | myoblast differentiation | 24/3107 | 84/18723 | 4.13e-03 | 2.04e-02 | 24 |
| GO:00343328 | Prostate | BPH | adherens junction organization | 16/3107 | 49/18723 | 4.35e-03 | 2.14e-02 | 16 |
| GO:00712294 | Prostate | BPH | cellular response to acid chemical | 23/3107 | 80/18723 | 4.53e-03 | 2.19e-02 | 23 |
| Page: 1 2 3 4 5 6 7 8 9 10 11 12 13 14 15 16 17 18 19 20 21 22 23 24 25 26 27 28 29 30 31 32 33 34 35 36 37 38 39 40 41 42 43 44 45 46 47 48 |
| Pathway ID | Tissue | Disease Stage | Description | Gene Ratio | Bg Ratio | pvalue | p.adjust | qvalue | Count |
| Page: 1 |
Top |
Cell-cell communication analysis |
| Identification of potential cell-cell interactions between two cell types and their ligand-receptor pairs for different disease states |
| Ligand | Receptor | LRpair | Pathway | Tissue | Disease Stage |
| Page: 1 |
Top |
Single-cell gene regulatory network inference analysis |
| Find out the significant the regulons (TFs) and the target genes of each regulon across cell types for different disease states |
| TF | Cell Type | Tissue | Disease Stage | Target Gene | RSS | Regulon Activity |
| ∗The dot plots of a searched regulon are shown for all cell subpopulations in each disease state of each tissue based on the regulon specific score inferred using pySCENIC and by calculating the average expression. |
| Page: 1 |
Top |
Somatic mutation of malignant transformation related genes |
| Annotation of somatic variants for genes involved in malignant transformation |
| Hugo Symbol | Variant Class | Variant Classification | dbSNP RS | HGVSc | HGVSp | HGVSp Short | SWISSPROT | BIOTYPE | SIFT | PolyPhen | Tumor Sample Barcode | Tissue | Histology | Sex | Age | Stage | Therapy Types | Drugs | Outcome |
| PLEC | SNV | Missense_Mutation | c.4341N>C | p.Glu1447Asp | p.E1447D | Q15149 | protein_coding | tolerated(1) | benign(0) | TCGA-A2-A04W-01 | Breast | breast invasive carcinoma | Female | <65 | I/II | Chemotherapy | cytoxan | SD | |
| PLEC | SNV | Missense_Mutation | c.10135N>G | p.Pro3379Ala | p.P3379A | Q15149 | protein_coding | tolerated(0.06) | benign(0.006) | TCGA-A2-A0T0-01 | Breast | breast invasive carcinoma | Female | <65 | I/II | Chemotherapy | taxotere | SD | |
| PLEC | SNV | Missense_Mutation | c.8535G>C | p.Glu2845Asp | p.E2845D | Q15149 | protein_coding | deleterious(0.02) | benign(0.026) | TCGA-A7-A13D-01 | Breast | breast invasive carcinoma | Female | <65 | I/II | Chemotherapy | cytoxan | SD | |
| PLEC | SNV | Missense_Mutation | rs368982802 | c.10961N>T | p.Thr3654Met | p.T3654M | Q15149 | protein_coding | deleterious(0) | probably_damaging(0.926) | TCGA-A8-A09Z-01 | Breast | breast invasive carcinoma | Female | >=65 | I/II | Unknown | Unknown | SD |
| PLEC | SNV | Missense_Mutation | c.2672N>G | p.Ser891Cys | p.S891C | Q15149 | protein_coding | deleterious(0) | benign(0.139) | TCGA-AC-A23H-01 | Breast | breast invasive carcinoma | Female | >=65 | I/II | Unknown | Unknown | PD | |
| PLEC | SNV | Missense_Mutation | novel | c.8752N>C | p.Tyr2918His | p.Y2918H | Q15149 | protein_coding | deleterious(0.04) | possibly_damaging(0.853) | TCGA-AO-A128-01 | Breast | breast invasive carcinoma | Female | <65 | I/II | Chemotherapy | doxorubicin | SD |
| PLEC | SNV | Missense_Mutation | c.1230G>T | p.Arg410Ser | p.R410S | Q15149 | protein_coding | tolerated(0.72) | benign(0.001) | TCGA-BH-A18G-01 | Breast | breast invasive carcinoma | Female | >=65 | I/II | Unknown | Unknown | SD | |
| PLEC | SNV | Missense_Mutation | rs782166303 | c.172C>T | p.Arg58Trp | p.R58W | Q15149 | protein_coding | deleterious_low_confidence(0) | probably_damaging(1) | TCGA-BH-A18G-01 | Breast | breast invasive carcinoma | Female | >=65 | I/II | Unknown | Unknown | SD |
| PLEC | SNV | Missense_Mutation | novel | c.934N>G | p.Tyr312Asp | p.Y312D | Q15149 | protein_coding | deleterious(0) | possibly_damaging(0.615) | TCGA-BH-A1FC-01 | Breast | breast invasive carcinoma | Female | >=65 | I/II | Unknown | Unknown | SD |
| PLEC | SNV | Missense_Mutation | novel | c.4297G>T | p.Val1433Leu | p.V1433L | Q15149 | protein_coding | tolerated(0.81) | benign(0) | TCGA-BH-A42T-01 | Breast | breast invasive carcinoma | Female | >=65 | I/II | Unknown | Unknown | SD |
| Page: 1 2 3 4 5 6 7 8 9 10 11 12 13 14 15 16 17 18 19 20 21 22 23 24 25 26 27 28 29 30 31 32 33 34 35 36 37 38 39 40 41 42 43 44 45 46 47 |
Top |
Related drugs of malignant transformation related genes |
| Identification of chemicals and drugs interact with genes involved in malignant transfromation |
| (DGIdb 4.0) |
| Entrez ID | Symbol | Category | Interaction Types | Drug Claim Name | Drug Name | PMIDs |
| Page: 1 |

Copyright 2023-Present -The University of Texas Health Science Center at Houston |