| Tissue | Expression Dynamics | Abbreviation |
| Breast | 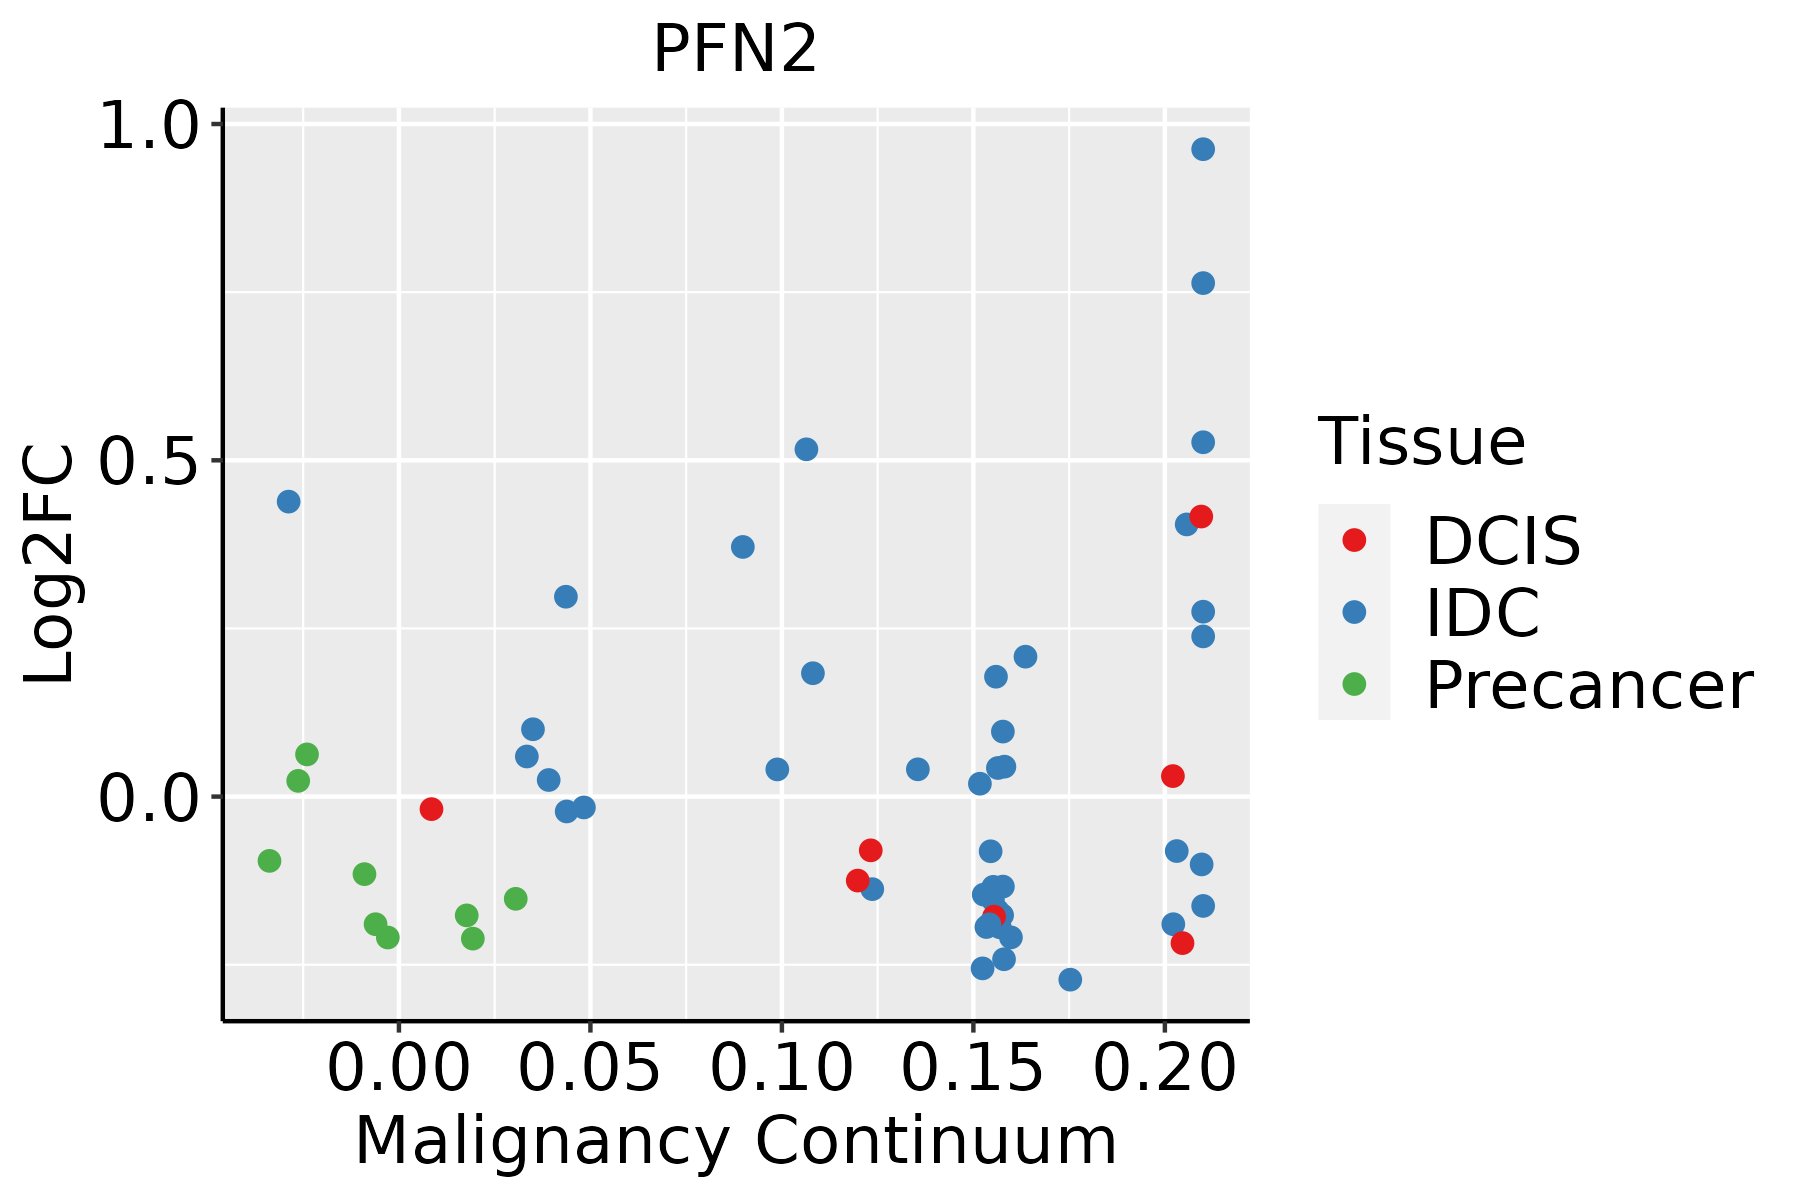 | IDC: Invasive ductal carcinoma |
| DCIS: Ductal carcinoma in situ |
| Precancer(BRCA1-mut): Precancerous lesion from BRCA1 mutation carriers |
| Colorectum (GSE201348) |  | FAP: Familial adenomatous polyposis |
| CRC: Colorectal cancer |
| Colorectum (HTA11) | 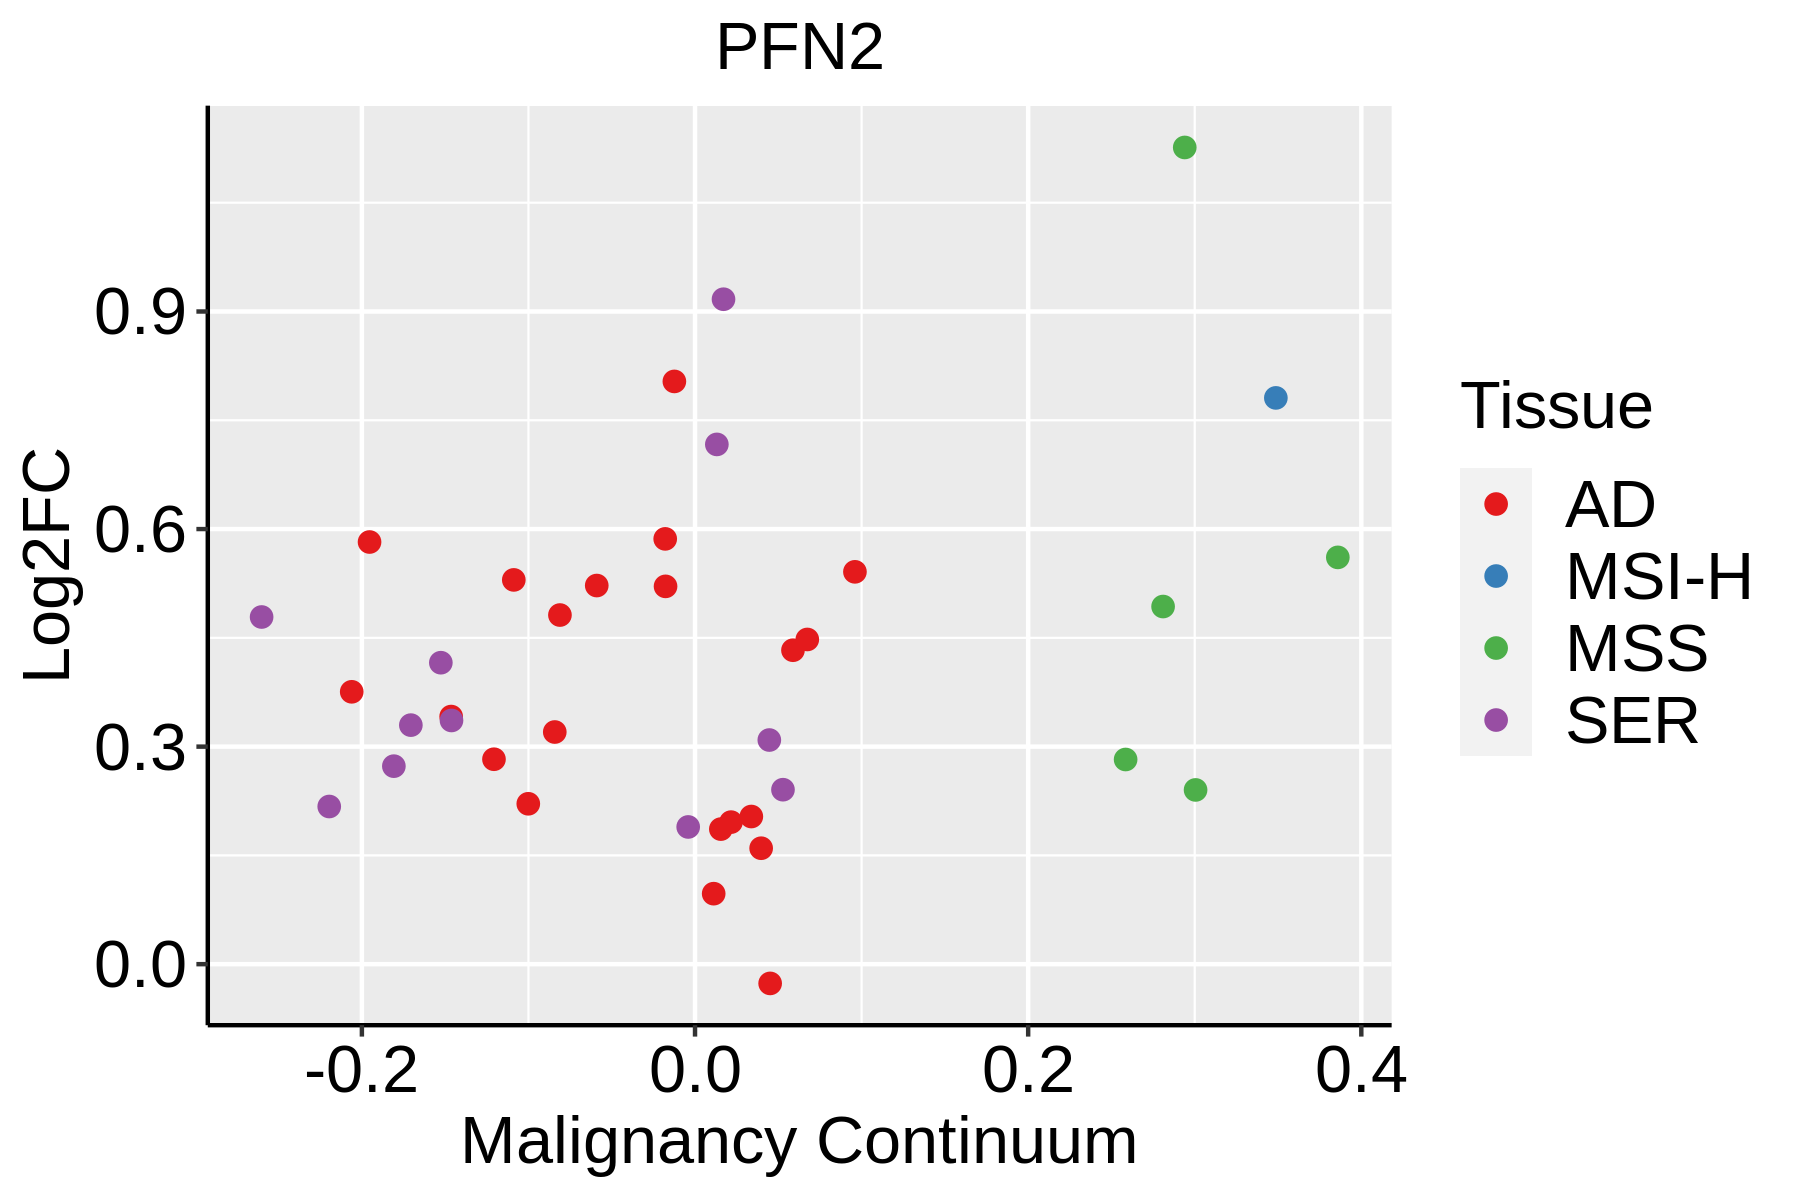 | AD: Adenomas |
| SER: Sessile serrated lesions |
| MSI-H: Microsatellite-high colorectal cancer |
| MSS: Microsatellite stable colorectal cancer |
| Esophagus | 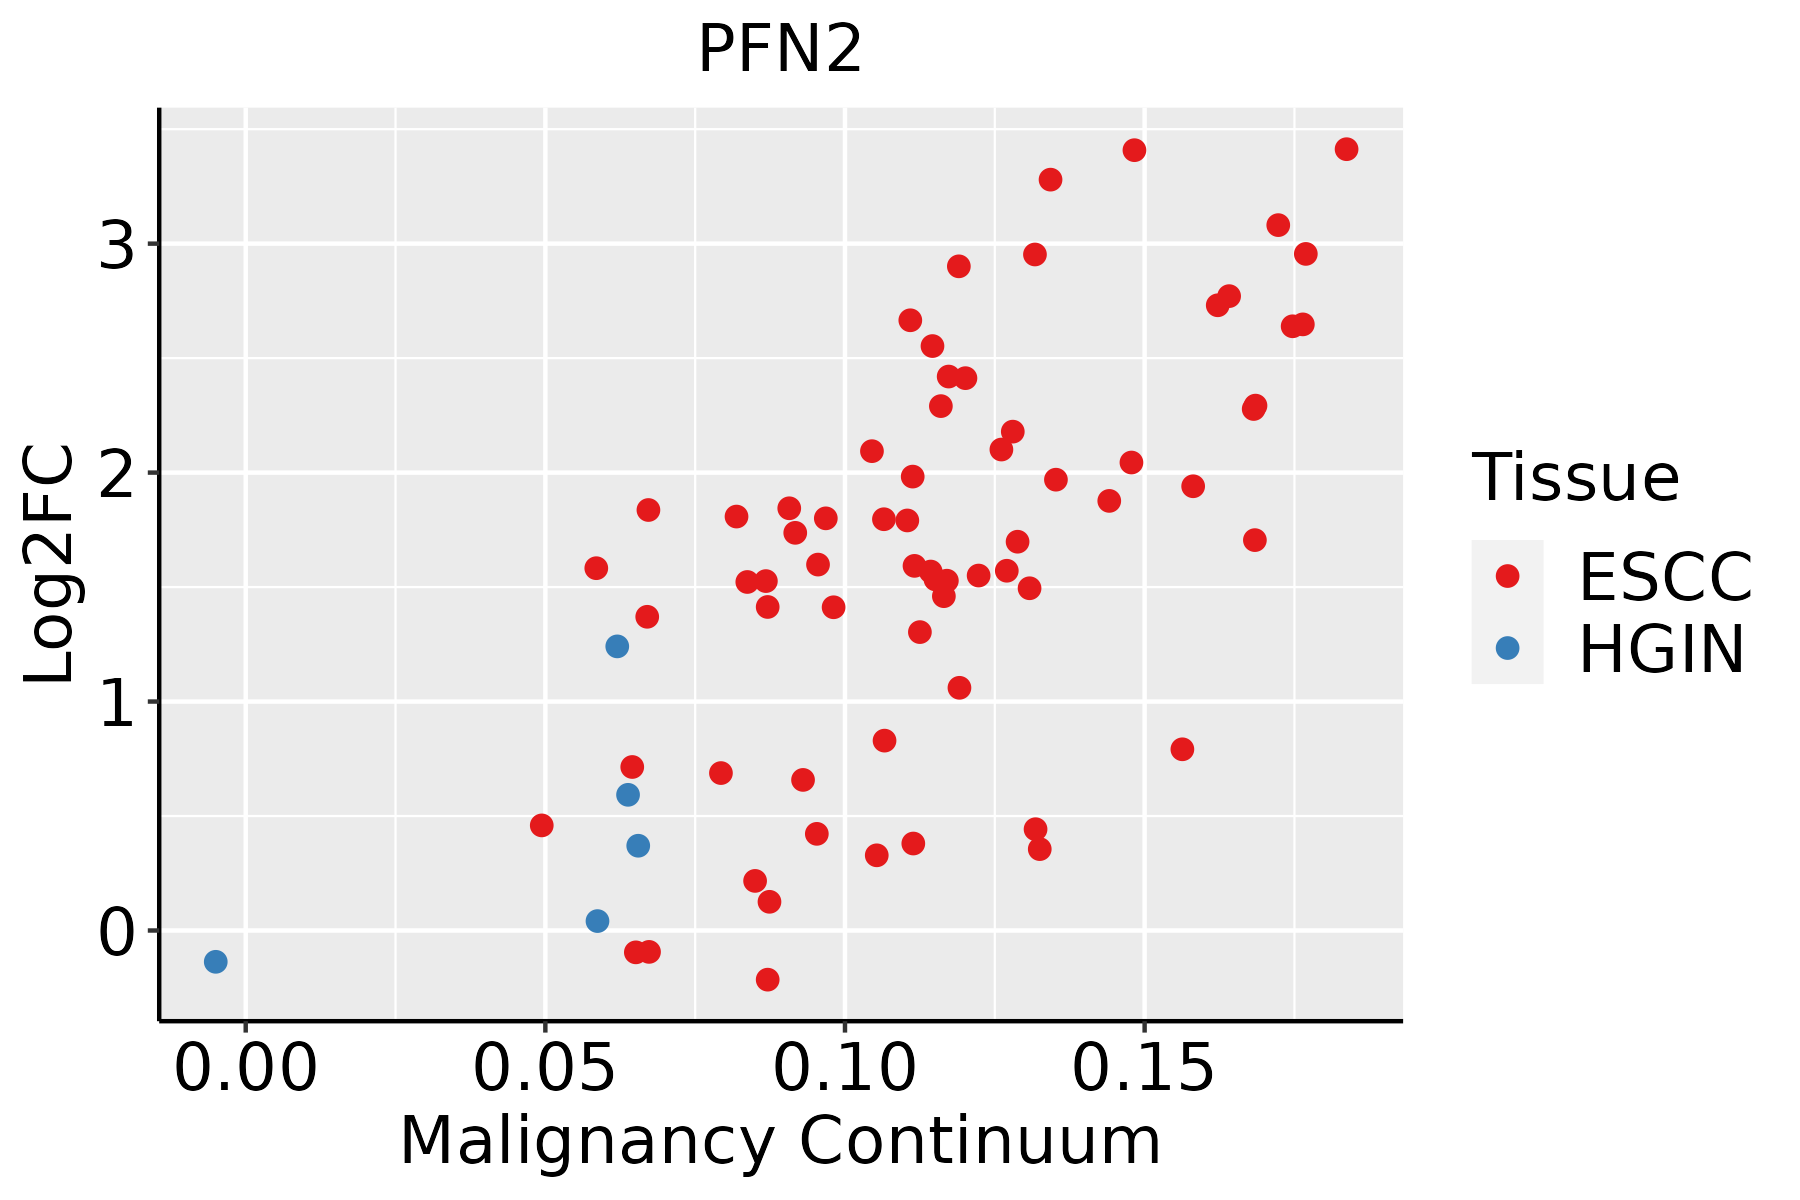 | ESCC: Esophageal squamous cell carcinoma |
| HGIN: High-grade intraepithelial neoplasias |
| LGIN: Low-grade intraepithelial neoplasias |
| Liver |  | HCC: Hepatocellular carcinoma |
| NAFLD: Non-alcoholic fatty liver disease |
| Oral Cavity |  | EOLP: Erosive Oral lichen planus |
| LP: leukoplakia |
| NEOLP: Non-erosive oral lichen planus |
| OSCC: Oral squamous cell carcinoma |
| Prostate | 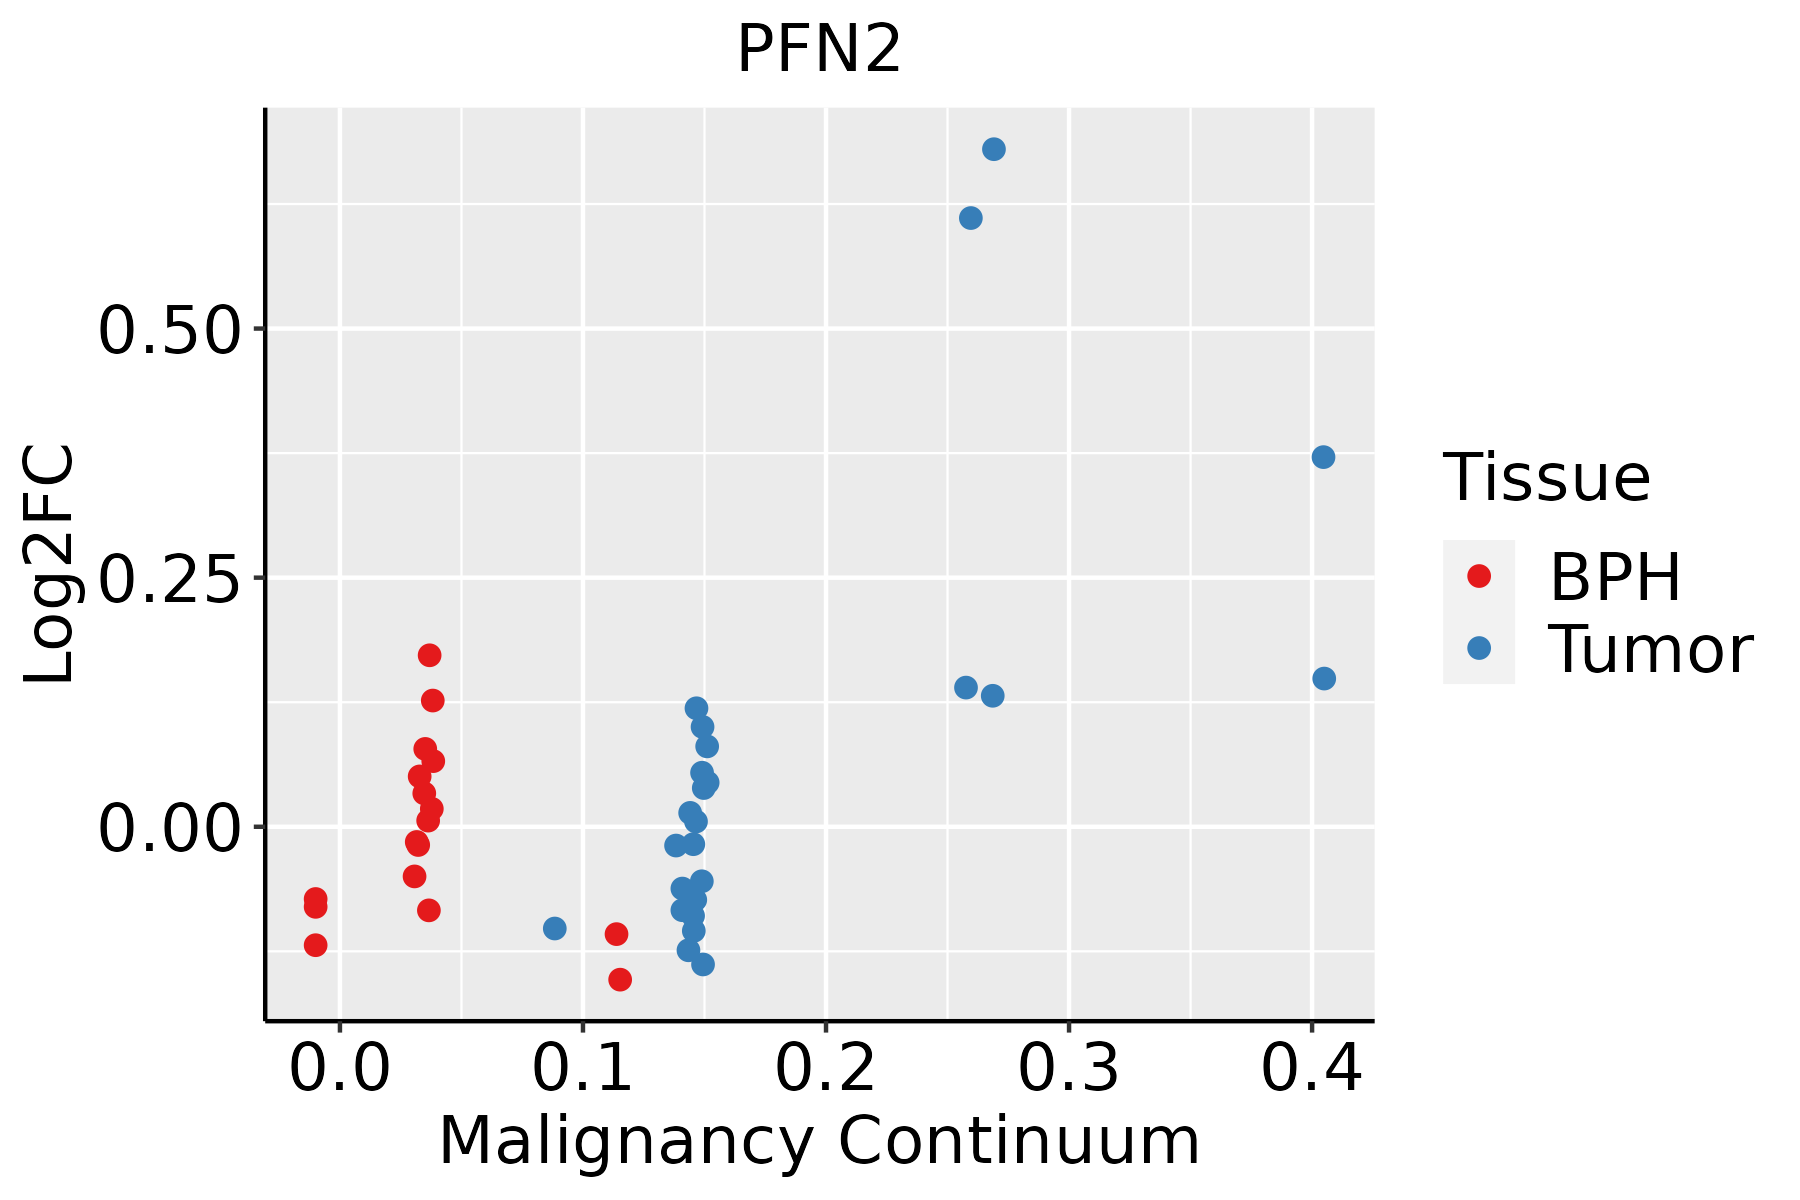 | BPH: Benign Prostatic Hyperplasia |
| Skin |  | AK: Actinic keratosis |
| cSCC: Cutaneous squamous cell carcinoma |
| SCCIS:squamous cell carcinoma in situ |
| GO ID | Tissue | Disease Stage | Description | Gene Ratio | Bg Ratio | pvalue | p.adjust | Count |
| GO:004314917 | Prostate | BPH | stress fiber assembly | 42/3107 | 106/18723 | 1.27e-08 | 4.07e-07 | 42 |
| GO:003083815 | Prostate | BPH | positive regulation of actin filament polymerization | 40/3107 | 99/18723 | 1.46e-08 | 4.62e-07 | 40 |
| GO:003004116 | Prostate | BPH | actin filament polymerization | 63/3107 | 191/18723 | 1.94e-08 | 5.98e-07 | 63 |
| GO:003223117 | Prostate | BPH | regulation of actin filament bundle assembly | 41/3107 | 105/18723 | 3.08e-08 | 8.91e-07 | 41 |
| GO:003103215 | Prostate | BPH | actomyosin structure organization | 63/3107 | 196/18723 | 5.78e-08 | 1.57e-06 | 63 |
| GO:000806415 | Prostate | BPH | regulation of actin polymerization or depolymerization | 61/3107 | 188/18723 | 6.37e-08 | 1.68e-06 | 61 |
| GO:011002018 | Prostate | BPH | regulation of actomyosin structure organization | 39/3107 | 100/18723 | 6.90e-08 | 1.82e-06 | 39 |
| GO:003083316 | Prostate | BPH | regulation of actin filament polymerization | 57/3107 | 172/18723 | 7.52e-08 | 1.92e-06 | 57 |
| GO:003083210 | Prostate | BPH | regulation of actin filament length | 61/3107 | 189/18723 | 7.89e-08 | 2.00e-06 | 61 |
| GO:005149218 | Prostate | BPH | regulation of stress fiber assembly | 36/3107 | 91/18723 | 1.43e-07 | 3.36e-06 | 36 |
| GO:190290410 | Prostate | BPH | negative regulation of supramolecular fiber organization | 55/3107 | 167/18723 | 1.60e-07 | 3.63e-06 | 55 |
| GO:003223315 | Prostate | BPH | positive regulation of actin filament bundle assembly | 26/3107 | 63/18723 | 2.96e-06 | 4.67e-05 | 26 |
| GO:00512715 | Prostate | BPH | negative regulation of cellular component movement | 94/3107 | 367/18723 | 6.18e-06 | 9.00e-05 | 94 |
| GO:003133316 | Prostate | BPH | negative regulation of protein-containing complex assembly | 44/3107 | 141/18723 | 1.28e-05 | 1.70e-04 | 44 |
| GO:005149410 | Prostate | BPH | negative regulation of cytoskeleton organization | 49/3107 | 163/18723 | 1.32e-05 | 1.74e-04 | 49 |
| GO:20001465 | Prostate | BPH | negative regulation of cell motility | 91/3107 | 359/18723 | 1.34e-05 | 1.76e-04 | 91 |
| GO:00400135 | Prostate | BPH | negative regulation of locomotion | 96/3107 | 391/18723 | 3.11e-05 | 3.54e-04 | 96 |
| GO:001063916 | Prostate | BPH | negative regulation of organelle organization | 87/3107 | 348/18723 | 3.56e-05 | 3.90e-04 | 87 |
| GO:00303365 | Prostate | BPH | negative regulation of cell migration | 86/3107 | 344/18723 | 3.93e-05 | 4.25e-04 | 86 |
| GO:00181059 | Prostate | BPH | peptidyl-serine phosphorylation | 79/3107 | 315/18723 | 7.09e-05 | 6.96e-04 | 79 |
| Pathway ID | Tissue | Disease Stage | Description | Gene Ratio | Bg Ratio | pvalue | p.adjust | qvalue | Count |
| hsa0501423 | Breast | IDC | Amyotrophic lateral sclerosis | 102/867 | 364/8465 | 1.29e-22 | 5.22e-21 | 3.91e-21 | 102 |
| hsa0513224 | Breast | IDC | Salmonella infection | 55/867 | 249/8465 | 2.07e-08 | 4.49e-07 | 3.36e-07 | 55 |
| hsa0513124 | Breast | IDC | Shigellosis | 47/867 | 247/8465 | 1.78e-05 | 2.00e-04 | 1.49e-04 | 47 |
| hsa0481014 | Breast | IDC | Regulation of actin cytoskeleton | 36/867 | 229/8465 | 5.79e-03 | 3.13e-02 | 2.34e-02 | 36 |
| hsa0501433 | Breast | IDC | Amyotrophic lateral sclerosis | 102/867 | 364/8465 | 1.29e-22 | 5.22e-21 | 3.91e-21 | 102 |
| hsa0513234 | Breast | IDC | Salmonella infection | 55/867 | 249/8465 | 2.07e-08 | 4.49e-07 | 3.36e-07 | 55 |
| hsa0513134 | Breast | IDC | Shigellosis | 47/867 | 247/8465 | 1.78e-05 | 2.00e-04 | 1.49e-04 | 47 |
| hsa0481015 | Breast | IDC | Regulation of actin cytoskeleton | 36/867 | 229/8465 | 5.79e-03 | 3.13e-02 | 2.34e-02 | 36 |
| hsa0501443 | Breast | DCIS | Amyotrophic lateral sclerosis | 101/846 | 364/8465 | 7.14e-23 | 2.88e-21 | 2.12e-21 | 101 |
| hsa0513243 | Breast | DCIS | Salmonella infection | 55/846 | 249/8465 | 8.71e-09 | 1.87e-07 | 1.38e-07 | 55 |
| hsa0513144 | Breast | DCIS | Shigellosis | 46/846 | 247/8465 | 2.06e-05 | 2.38e-04 | 1.75e-04 | 46 |
| hsa0481023 | Breast | DCIS | Regulation of actin cytoskeleton | 35/846 | 229/8465 | 6.89e-03 | 3.37e-02 | 2.48e-02 | 35 |
| hsa0501453 | Breast | DCIS | Amyotrophic lateral sclerosis | 101/846 | 364/8465 | 7.14e-23 | 2.88e-21 | 2.12e-21 | 101 |
| hsa0513253 | Breast | DCIS | Salmonella infection | 55/846 | 249/8465 | 8.71e-09 | 1.87e-07 | 1.38e-07 | 55 |
| hsa0513154 | Breast | DCIS | Shigellosis | 46/846 | 247/8465 | 2.06e-05 | 2.38e-04 | 1.75e-04 | 46 |
| hsa0481033 | Breast | DCIS | Regulation of actin cytoskeleton | 35/846 | 229/8465 | 6.89e-03 | 3.37e-02 | 2.48e-02 | 35 |
| hsa05014 | Colorectum | AD | Amyotrophic lateral sclerosis | 164/2092 | 364/8465 | 4.28e-18 | 1.27e-16 | 8.09e-17 | 164 |
| hsa05131 | Colorectum | AD | Shigellosis | 109/2092 | 247/8465 | 1.09e-11 | 2.44e-10 | 1.55e-10 | 109 |
| hsa05132 | Colorectum | AD | Salmonella infection | 102/2092 | 249/8465 | 7.65e-09 | 1.28e-07 | 8.17e-08 | 102 |
| hsa04015 | Colorectum | AD | Rap1 signaling pathway | 71/2092 | 210/8465 | 1.72e-03 | 9.68e-03 | 6.18e-03 | 71 |
| Hugo Symbol | Variant Class | Variant Classification | dbSNP RS | HGVSc | HGVSp | HGVSp Short | SWISSPROT | BIOTYPE | SIFT | PolyPhen | Tumor Sample Barcode | Tissue | Histology | Sex | Age | Stage | Therapy Types | Drugs | Outcome |
| PFN2 | SNV | Missense_Mutation | | c.394G>C | p.Ala132Pro | p.A132P | P35080 | protein_coding | deleterious(0.02) | probably_damaging(0.93) | TCGA-AN-A0XU-01 | Breast | breast invasive carcinoma | Female | <65 | I/II | Unknown | Unknown | SD |
| PFN2 | SNV | Missense_Mutation | novel | c.393G>T | p.Met131Ile | p.M131I | P35080 | protein_coding | deleterious(0.04) | benign(0.05) | TCGA-AN-A0XU-01 | Breast | breast invasive carcinoma | Female | <65 | I/II | Unknown | Unknown | SD |
| PFN2 | insertion | Nonsense_Mutation | novel | c.228_229insCAGCTTTATTAAACTTAAAAGTCTCTTAAACTG | p.Asp76_Ser77insGlnLeuTyrTerThrTerLysSerLeuLysLeu | p.D76_S77insQLY*T*KSLKL | P35080 | protein_coding | | | TCGA-A2-A0T2-01 | Breast | breast invasive carcinoma | Female | >=65 | III/IV | Chemotherapy | xeloda | PD |
| PFN2 | SNV | Missense_Mutation | | c.202G>A | p.Ala68Thr | p.A68T | P35080 | protein_coding | deleterious(0.03) | benign(0.056) | TCGA-AA-3712-01 | Colorectum | colon adenocarcinoma | Male | >=65 | III/IV | Unknown | Unknown | SD |
| PFN2 | SNV | Missense_Mutation | | c.203N>T | p.Ala68Val | p.A68V | P35080 | protein_coding | deleterious(0) | benign(0.056) | TCGA-CM-5861-01 | Colorectum | colon adenocarcinoma | Female | <65 | I/II | Unknown | Unknown | PD |
| PFN2 | SNV | Missense_Mutation | novel | c.197N>G | p.Leu66Arg | p.L66R | P35080 | protein_coding | deleterious(0) | probably_damaging(0.953) | TCGA-A5-A0G2-01 | Endometrium | uterine corpus endometrioid carcinoma | Female | <65 | III/IV | Unknown | Unknown | SD |
| PFN2 | SNV | Missense_Mutation | | c.394N>A | p.Ala132Thr | p.A132T | P35080 | protein_coding | tolerated(0.1) | benign(0.185) | TCGA-AJ-A3BH-01 | Endometrium | uterine corpus endometrioid carcinoma | Female | Unknown | I/II | Unknown | Unknown | SD |
| PFN2 | SNV | Missense_Mutation | novel | c.151A>T | p.Ile51Phe | p.I51F | P35080 | protein_coding | deleterious(0) | possibly_damaging(0.544) | TCGA-EC-A24G-01 | Endometrium | uterine corpus endometrioid carcinoma | Female | <65 | I/II | Chemotherapy | doxorubicin | SD |
| PFN2 | SNV | Missense_Mutation | novel | c.196N>G | p.Leu66Val | p.L66V | P35080 | protein_coding | tolerated(0.19) | benign(0.097) | TCGA-P3-A5Q5-01 | Oral cavity | head & neck squamous cell carcinoma | Male | <65 | I/II | Unknown | Unknown | SD |
| PFN2 | SNV | Missense_Mutation | rs763130284 | c.367N>A | p.Gly123Arg | p.G123R | P35080 | protein_coding | tolerated(0.53) | benign(0.005) | TCGA-EJ-7782-01 | Prostate | prostate adenocarcinoma | Male | >=65 | 8 | Unknown | Unknown | SD |


