
|
|||||
|
 | |
| |
| |
| |
| |
| |
|
Gene: PER1 |
Gene summary for PER1 |
| Gene information | Species | Human | Gene symbol | PER1 | Gene ID | 5187 |
| Gene name | period circadian regulator 1 | |
| Gene Alias | PER | |
| Cytomap | 17p13.1 | |
| Gene Type | protein-coding | GO ID | GO:0000122 | UniProtAcc | O15534 |
Top |
Malignant transformation analysis |
| Identification of the aberrant gene expression in precancerous and cancerous lesions by comparing the gene expression of stem-like cells in diseased tissues with normal stem cells |
| Entrez ID | Symbol | Replicates | Species | Organ | Tissue | Adj P-value | Log2FC | Malignancy |
| 5187 | PER1 | LZE4T | Human | Esophagus | ESCC | 2.19e-02 | -5.56e-02 | 0.0811 |
| 5187 | PER1 | LZE22D1 | Human | Esophagus | HGIN | 5.67e-04 | -7.82e-02 | 0.0595 |
| 5187 | PER1 | LZE24T | Human | Esophagus | ESCC | 2.77e-09 | 4.72e-01 | 0.0596 |
| 5187 | PER1 | LZE6T | Human | Esophagus | ESCC | 1.31e-12 | 9.91e-02 | 0.0845 |
| 5187 | PER1 | P1T-E | Human | Esophagus | ESCC | 1.57e-03 | 1.66e-01 | 0.0875 |
| 5187 | PER1 | P2T-E | Human | Esophagus | ESCC | 8.93e-18 | 4.93e-02 | 0.1177 |
| 5187 | PER1 | P4T-E | Human | Esophagus | ESCC | 2.82e-06 | -4.96e-02 | 0.1323 |
| 5187 | PER1 | P5T-E | Human | Esophagus | ESCC | 8.47e-06 | -2.21e-01 | 0.1327 |
| 5187 | PER1 | P8T-E | Human | Esophagus | ESCC | 9.50e-11 | -2.84e-02 | 0.0889 |
| 5187 | PER1 | P9T-E | Human | Esophagus | ESCC | 5.04e-06 | -1.96e-02 | 0.1131 |
| 5187 | PER1 | P10T-E | Human | Esophagus | ESCC | 1.50e-08 | -1.95e-01 | 0.116 |
| 5187 | PER1 | P11T-E | Human | Esophagus | ESCC | 1.45e-10 | 4.70e-01 | 0.1426 |
| 5187 | PER1 | P12T-E | Human | Esophagus | ESCC | 8.16e-18 | 3.03e-01 | 0.1122 |
| 5187 | PER1 | P16T-E | Human | Esophagus | ESCC | 8.07e-11 | -1.10e-01 | 0.1153 |
| 5187 | PER1 | P17T-E | Human | Esophagus | ESCC | 5.33e-10 | 1.72e-01 | 0.1278 |
| 5187 | PER1 | P20T-E | Human | Esophagus | ESCC | 9.20e-15 | 7.06e-01 | 0.1124 |
| 5187 | PER1 | P21T-E | Human | Esophagus | ESCC | 1.96e-22 | 1.28e-01 | 0.1617 |
| 5187 | PER1 | P22T-E | Human | Esophagus | ESCC | 4.68e-06 | -2.00e-01 | 0.1236 |
| 5187 | PER1 | P23T-E | Human | Esophagus | ESCC | 2.27e-10 | 2.90e-01 | 0.108 |
| 5187 | PER1 | P24T-E | Human | Esophagus | ESCC | 3.78e-10 | 2.40e-01 | 0.1287 |
| Page: 1 2 3 4 5 |
| Tissue | Expression Dynamics | Abbreviation |
| Esophagus |  | ESCC: Esophageal squamous cell carcinoma |
| HGIN: High-grade intraepithelial neoplasias | ||
| LGIN: Low-grade intraepithelial neoplasias | ||
| Lung |  | AAH: Atypical adenomatous hyperplasia |
| AIS: Adenocarcinoma in situ | ||
| IAC: Invasive lung adenocarcinoma | ||
| MIA: Minimally invasive adenocarcinoma | ||
| Prostate |  | BPH: Benign Prostatic Hyperplasia |
| Skin | 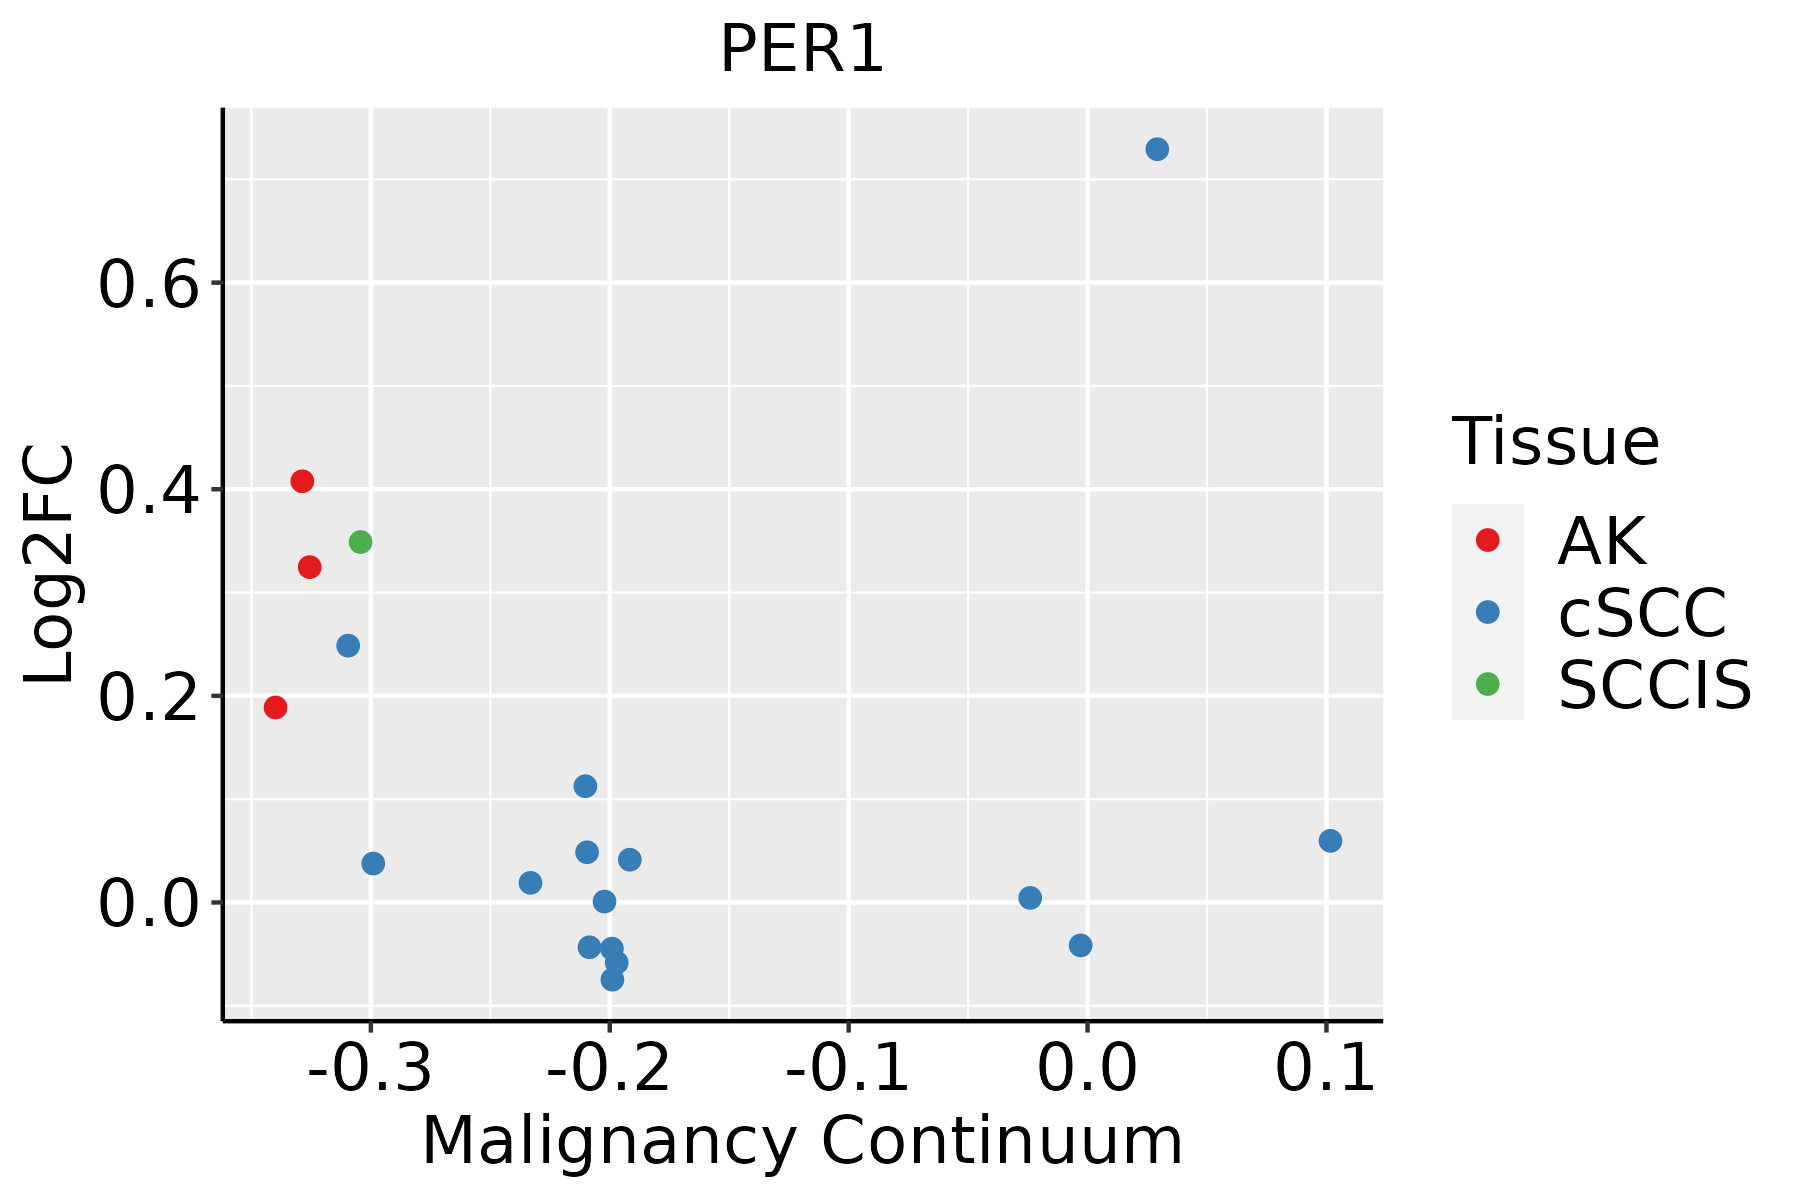 | AK: Actinic keratosis |
| cSCC: Cutaneous squamous cell carcinoma | ||
| SCCIS:squamous cell carcinoma in situ | ||
| Thyroid | 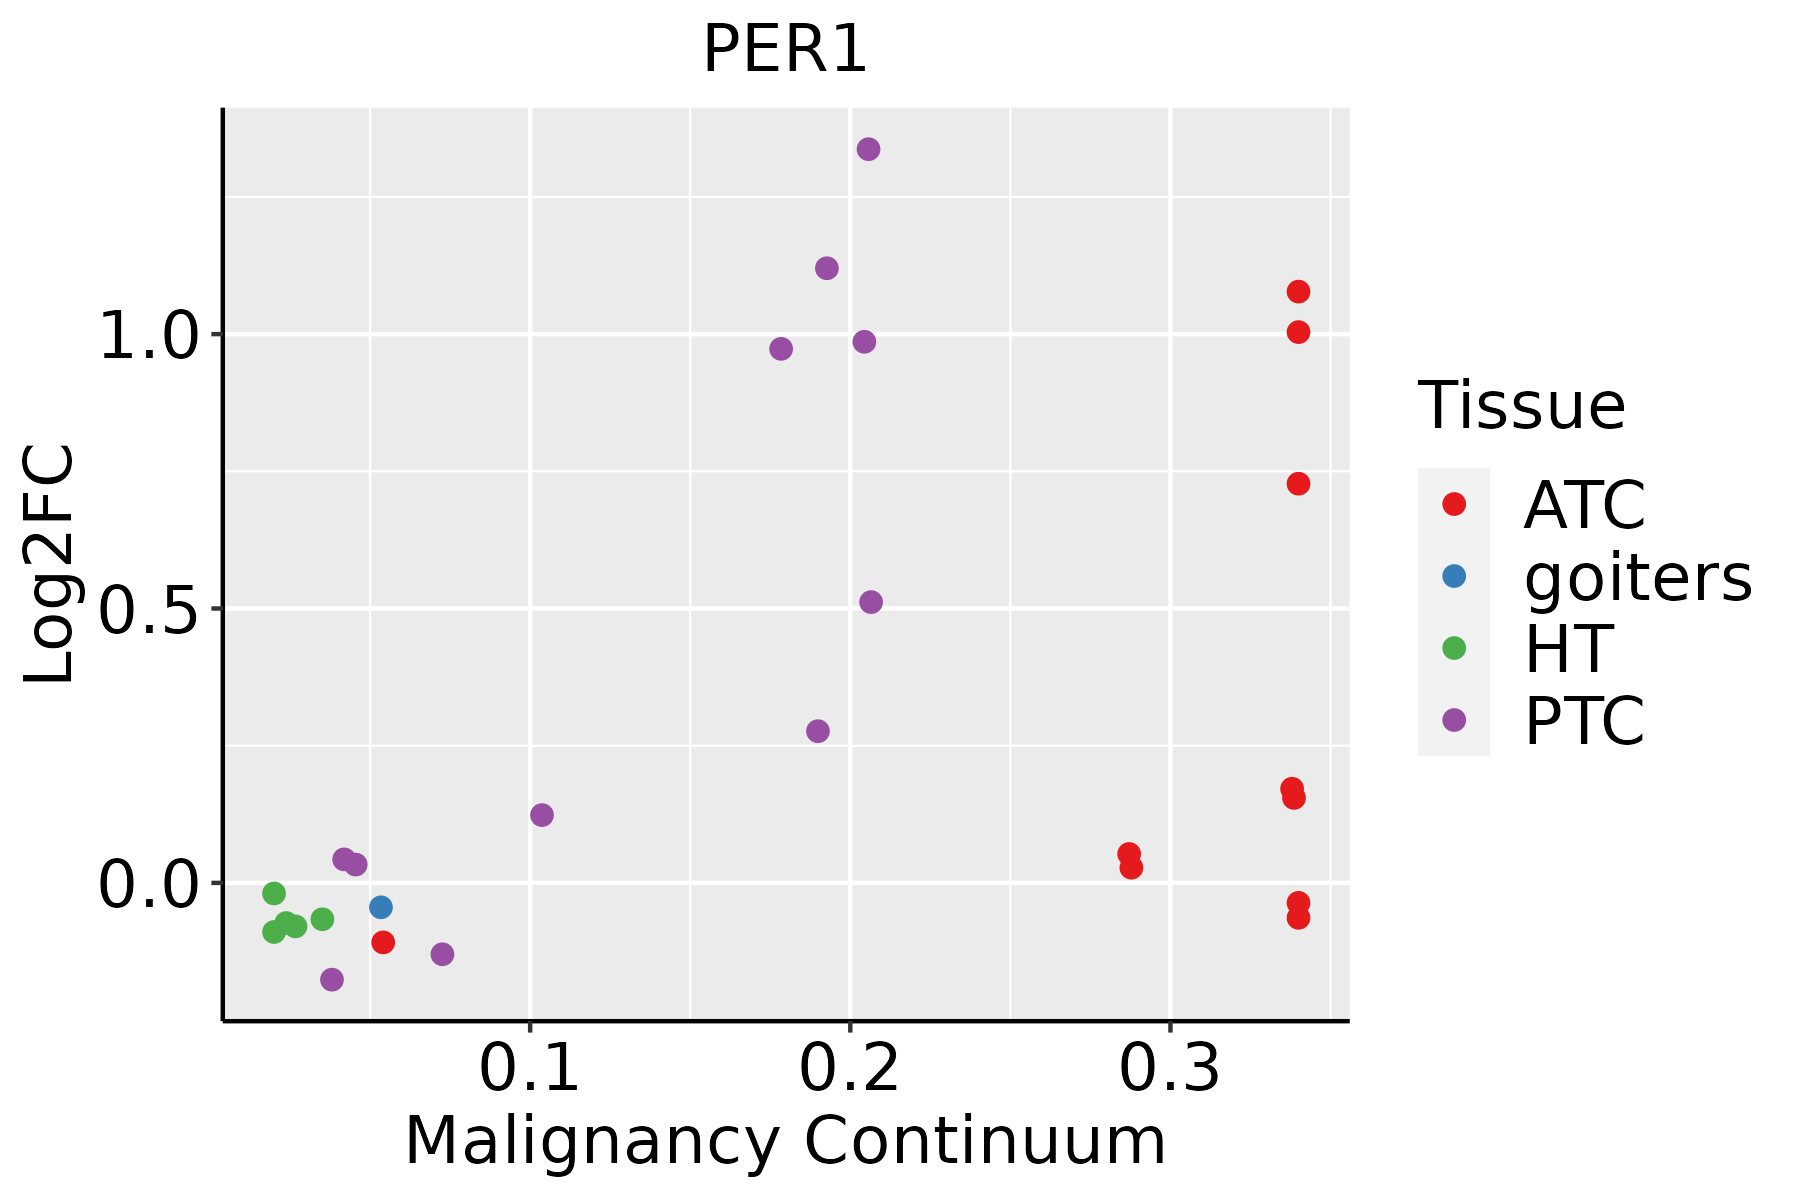 | ATC: Anaplastic thyroid cancer |
| HT: Hashimoto's thyroiditis | ||
| PTC: Papillary thyroid cancer |
| ∗log2FC in expression of this searched gene in stem-like cells from each diseased tissue sample relative to stem-like cells in normal samples in each tissue plotted against the malignancy continuum. Samples are colored based on if they are from different disease stage. |
Top |
Malignant transformation related pathway analysis |
| Find out the enriched GO biological processes and KEGG pathways involved in transition from healthy to precancer to cancer |
| Tissue | Disease Stage | Enriched GO biological Processes |
| Colorectum | AD |  |
| Colorectum | SER |  |
| Colorectum | MSS |  |
| Colorectum | MSI-H |  |
| Colorectum | FAP |  |
| ∗Top 15 enriched GO BP terms are showed in the bar plot of each disease state in each tissue. Each row represents a significant GO biological process which is colored according to the -log10(p.adjust). |
| Page: 1 2 3 4 5 6 7 8 9 |
| GO ID | Tissue | Disease Stage | Description | Gene Ratio | Bg Ratio | pvalue | p.adjust | Count |
| GO:0043409112 | Thyroid | PTC | negative regulation of MAPK cascade | 76/5968 | 180/18723 | 2.15e-03 | 1.14e-02 | 76 |
| GO:00709322 | Thyroid | PTC | histone H3 deacetylation | 13/5968 | 20/18723 | 2.37e-03 | 1.24e-02 | 13 |
| GO:003314410 | Thyroid | PTC | negative regulation of intracellular steroid hormone receptor signaling pathway | 21/5968 | 38/18723 | 2.38e-03 | 1.25e-02 | 21 |
| GO:0051591111 | Thyroid | PTC | response to cAMP | 43/5968 | 93/18723 | 2.59e-03 | 1.33e-02 | 43 |
| GO:001657017 | Thyroid | ATC | histone modification | 243/6293 | 463/18723 | 2.23e-17 | 2.27e-15 | 243 |
| GO:000641735 | Thyroid | ATC | regulation of translation | 236/6293 | 468/18723 | 2.39e-14 | 1.34e-12 | 236 |
| GO:001820516 | Thyroid | ATC | peptidyl-lysine modification | 193/6293 | 376/18723 | 6.92e-13 | 3.06e-11 | 193 |
| GO:000647315 | Thyroid | ATC | protein acetylation | 116/6293 | 201/18723 | 1.75e-12 | 7.33e-11 | 116 |
| GO:004354315 | Thyroid | ATC | protein acylation | 134/6293 | 243/18723 | 3.46e-12 | 1.40e-10 | 134 |
| GO:001839415 | Thyroid | ATC | peptidyl-lysine acetylation | 100/6293 | 169/18723 | 7.65e-12 | 2.91e-10 | 100 |
| GO:000647515 | Thyroid | ATC | internal protein amino acid acetylation | 93/6293 | 160/18723 | 1.59e-10 | 4.82e-09 | 93 |
| GO:001839315 | Thyroid | ATC | internal peptidyl-lysine acetylation | 92/6293 | 158/18723 | 1.75e-10 | 5.24e-09 | 92 |
| GO:001657314 | Thyroid | ATC | histone acetylation | 89/6293 | 152/18723 | 2.31e-10 | 6.72e-09 | 89 |
| GO:0048545210 | Thyroid | ATC | response to steroid hormone | 168/6293 | 339/18723 | 7.21e-10 | 1.88e-08 | 168 |
| GO:0030522112 | Thyroid | ATC | intracellular receptor signaling pathway | 134/6293 | 265/18723 | 7.58e-09 | 1.63e-07 | 134 |
| GO:000931426 | Thyroid | ATC | response to radiation | 210/6293 | 456/18723 | 1.69e-08 | 3.39e-07 | 210 |
| GO:004396713 | Thyroid | ATC | histone H4 acetylation | 45/6293 | 67/18723 | 2.01e-08 | 3.93e-07 | 45 |
| GO:0043122112 | Thyroid | ATC | regulation of I-kappaB kinase/NF-kappaB signaling | 123/6293 | 249/18723 | 1.65e-07 | 2.64e-06 | 123 |
| GO:0007249111 | Thyroid | ATC | I-kappaB kinase/NF-kappaB signaling | 135/6293 | 281/18723 | 3.31e-07 | 4.91e-06 | 135 |
| GO:007138328 | Thyroid | ATC | cellular response to steroid hormone stimulus | 103/6293 | 204/18723 | 4.32e-07 | 6.30e-06 | 103 |
| Page: 1 2 3 4 5 6 7 8 9 10 11 12 13 14 15 16 17 18 19 20 21 22 23 24 25 26 27 |
| Pathway ID | Tissue | Disease Stage | Description | Gene Ratio | Bg Ratio | pvalue | p.adjust | qvalue | Count |
| hsa047105 | Esophagus | ESCC | Circadian rhythm | 24/4205 | 34/8465 | 1.09e-02 | 2.51e-02 | 1.29e-02 | 24 |
| hsa0471012 | Esophagus | ESCC | Circadian rhythm | 24/4205 | 34/8465 | 1.09e-02 | 2.51e-02 | 1.29e-02 | 24 |
| hsa04710 | Lung | IAC | Circadian rhythm | 10/1053 | 34/8465 | 6.70e-03 | 2.76e-02 | 1.83e-02 | 10 |
| hsa047101 | Lung | IAC | Circadian rhythm | 10/1053 | 34/8465 | 6.70e-03 | 2.76e-02 | 1.83e-02 | 10 |
| hsa047102 | Lung | AIS | Circadian rhythm | 11/961 | 34/8465 | 9.22e-04 | 7.11e-03 | 4.55e-03 | 11 |
| hsa047103 | Lung | AIS | Circadian rhythm | 11/961 | 34/8465 | 9.22e-04 | 7.11e-03 | 4.55e-03 | 11 |
| hsa047104 | Prostate | BPH | Circadian rhythm | 15/1718 | 34/8465 | 1.40e-03 | 5.85e-03 | 3.62e-03 | 15 |
| hsa0471011 | Prostate | BPH | Circadian rhythm | 15/1718 | 34/8465 | 1.40e-03 | 5.85e-03 | 3.62e-03 | 15 |
| hsa0471021 | Prostate | Tumor | Circadian rhythm | 14/1791 | 34/8465 | 6.44e-03 | 2.16e-02 | 1.34e-02 | 14 |
| hsa0471031 | Prostate | Tumor | Circadian rhythm | 14/1791 | 34/8465 | 6.44e-03 | 2.16e-02 | 1.34e-02 | 14 |
| Page: 1 |
Top |
Cell-cell communication analysis |
| Identification of potential cell-cell interactions between two cell types and their ligand-receptor pairs for different disease states |
| Ligand | Receptor | LRpair | Pathway | Tissue | Disease Stage |
| Page: 1 |
Top |
Single-cell gene regulatory network inference analysis |
| Find out the significant the regulons (TFs) and the target genes of each regulon across cell types for different disease states |
| TF | Cell Type | Tissue | Disease Stage | Target Gene | RSS | Regulon Activity |
| ∗The dot plots of a searched regulon are shown for all cell subpopulations in each disease state of each tissue based on the regulon specific score inferred using pySCENIC and by calculating the average expression. |
| Page: 1 |
Top |
Somatic mutation of malignant transformation related genes |
| Annotation of somatic variants for genes involved in malignant transformation |
| Hugo Symbol | Variant Class | Variant Classification | dbSNP RS | HGVSc | HGVSp | HGVSp Short | SWISSPROT | BIOTYPE | SIFT | PolyPhen | Tumor Sample Barcode | Tissue | Histology | Sex | Age | Stage | Therapy Types | Drugs | Outcome |
| PER1 | SNV | Missense_Mutation | c.359N>T | p.Ser120Phe | p.S120F | O15534 | protein_coding | deleterious(0) | probably_damaging(0.982) | TCGA-A2-A0CX-01 | Breast | breast invasive carcinoma | Female | <65 | I/II | Chemotherapy | adriamycin | SD | |
| PER1 | SNV | Missense_Mutation | c.3206N>G | p.Ser1069Cys | p.S1069C | O15534 | protein_coding | tolerated(0.06) | possibly_damaging(0.88) | TCGA-AC-A23H-01 | Breast | breast invasive carcinoma | Female | >=65 | I/II | Unknown | Unknown | PD | |
| PER1 | SNV | Missense_Mutation | c.1120N>C | p.Asp374His | p.D374H | O15534 | protein_coding | deleterious(0) | probably_damaging(0.999) | TCGA-AC-A23H-01 | Breast | breast invasive carcinoma | Female | >=65 | I/II | Unknown | Unknown | PD | |
| PER1 | SNV | Missense_Mutation | novel | c.2927N>T | p.Ser976Leu | p.S976L | O15534 | protein_coding | deleterious(0) | possibly_damaging(0.606) | TCGA-AC-A3BB-01 | Breast | breast invasive carcinoma | Female | <65 | III/IV | Chemotherapy | cytoxan | CR |
| PER1 | SNV | Missense_Mutation | novel | c.1478N>C | p.Ile493Thr | p.I493T | O15534 | protein_coding | deleterious(0) | probably_damaging(0.921) | TCGA-AR-A0TT-01 | Breast | breast invasive carcinoma | Female | <65 | III/IV | Chemotherapy | doxorubicin | SD |
| PER1 | SNV | Missense_Mutation | novel | c.633G>T | p.Glu211Asp | p.E211D | O15534 | protein_coding | deleterious(0.01) | probably_damaging(0.952) | TCGA-B6-A3ZX-01 | Breast | breast invasive carcinoma | Female | <65 | III/IV | Chemotherapy | cyclophosphamide | PD |
| PER1 | SNV | Missense_Mutation | c.2852N>T | p.Ser951Leu | p.S951L | O15534 | protein_coding | tolerated(0.16) | benign(0.003) | TCGA-C8-A26Y-01 | Breast | breast invasive carcinoma | Female | >=65 | I/II | Unknown | Unknown | SD | |
| PER1 | SNV | Missense_Mutation | c.2570N>T | p.Ser857Leu | p.S857L | O15534 | protein_coding | tolerated(0.23) | benign(0) | TCGA-C8-A26Y-01 | Breast | breast invasive carcinoma | Female | >=65 | I/II | Unknown | Unknown | SD | |
| PER1 | SNV | Missense_Mutation | c.386N>T | p.Ser129Leu | p.S129L | O15534 | protein_coding | deleterious(0) | probably_damaging(0.942) | TCGA-C8-A26Y-01 | Breast | breast invasive carcinoma | Female | >=65 | I/II | Unknown | Unknown | SD | |
| PER1 | SNV | Missense_Mutation | rs535351039 | c.1264C>T | p.His422Tyr | p.H422Y | O15534 | protein_coding | tolerated(0.62) | probably_damaging(0.968) | TCGA-D8-A1JF-01 | Breast | breast invasive carcinoma | Female | >=65 | III/IV | Unknown | Unknown | SD |
| Page: 1 2 3 4 5 6 7 8 9 10 11 |
Top |
Related drugs of malignant transformation related genes |
| Identification of chemicals and drugs interact with genes involved in malignant transfromation |
| (DGIdb 4.0) |
| Entrez ID | Symbol | Category | Interaction Types | Drug Claim Name | Drug Name | PMIDs |
| 5187 | PER1 | TRANSCRIPTION FACTOR, NUCLEAR HORMONE RECEPTOR, CLINICALLY ACTIONABLE | MORPHINE | MORPHINE | 15977398 | |
| 5187 | PER1 | TRANSCRIPTION FACTOR, NUCLEAR HORMONE RECEPTOR, CLINICALLY ACTIONABLE | MELATONIN | MELATONIN | 15978008,12895514 |
| Page: 1 |

Copyright 2023-Present -The University of Texas Health Science Center at Houston |