
|
|||||
|
 | |
| |
| |
| |
| |
| |
|
Gene: PDCD6IP |
Gene summary for PDCD6IP |
| Gene information | Species | Human | Gene symbol | PDCD6IP | Gene ID | 10015 |
| Gene name | programmed cell death 6 interacting protein | |
| Gene Alias | AIP1 | |
| Cytomap | 3p22.3 | |
| Gene Type | protein-coding | GO ID | GO:0000226 | UniProtAcc | Q8WUM4 |
Top |
Malignant transformation analysis |
| Identification of the aberrant gene expression in precancerous and cancerous lesions by comparing the gene expression of stem-like cells in diseased tissues with normal stem cells |
| Entrez ID | Symbol | Replicates | Species | Organ | Tissue | Adj P-value | Log2FC | Malignancy |
| 10015 | PDCD6IP | HTA11_3410_2000001011 | Human | Colorectum | AD | 2.61e-07 | -3.03e-01 | 0.0155 |
| 10015 | PDCD6IP | HTA11_347_2000001011 | Human | Colorectum | AD | 5.23e-13 | 6.29e-01 | -0.1954 |
| 10015 | PDCD6IP | A015-C-203 | Human | Colorectum | FAP | 2.38e-24 | -3.90e-01 | -0.1294 |
| 10015 | PDCD6IP | A015-C-204 | Human | Colorectum | FAP | 3.47e-07 | -3.83e-01 | -0.0228 |
| 10015 | PDCD6IP | A014-C-040 | Human | Colorectum | FAP | 1.43e-03 | -3.99e-01 | -0.1184 |
| 10015 | PDCD6IP | A002-C-201 | Human | Colorectum | FAP | 4.57e-08 | -2.77e-01 | 0.0324 |
| 10015 | PDCD6IP | A002-C-203 | Human | Colorectum | FAP | 8.32e-04 | -1.33e-01 | 0.2786 |
| 10015 | PDCD6IP | A001-C-119 | Human | Colorectum | FAP | 6.15e-07 | -3.78e-01 | -0.1557 |
| 10015 | PDCD6IP | A001-C-108 | Human | Colorectum | FAP | 2.07e-17 | -2.60e-01 | -0.0272 |
| 10015 | PDCD6IP | A002-C-205 | Human | Colorectum | FAP | 1.98e-18 | -4.69e-01 | -0.1236 |
| 10015 | PDCD6IP | A015-C-006 | Human | Colorectum | FAP | 1.30e-10 | -4.23e-01 | -0.0994 |
| 10015 | PDCD6IP | A015-C-106 | Human | Colorectum | FAP | 1.79e-11 | -2.44e-01 | -0.0511 |
| 10015 | PDCD6IP | A002-C-114 | Human | Colorectum | FAP | 1.16e-12 | -3.14e-01 | -0.1561 |
| 10015 | PDCD6IP | A015-C-104 | Human | Colorectum | FAP | 4.73e-28 | -3.61e-01 | -0.1899 |
| 10015 | PDCD6IP | A001-C-014 | Human | Colorectum | FAP | 1.85e-14 | -3.49e-01 | 0.0135 |
| 10015 | PDCD6IP | A002-C-016 | Human | Colorectum | FAP | 2.69e-19 | -3.90e-01 | 0.0521 |
| 10015 | PDCD6IP | A015-C-002 | Human | Colorectum | FAP | 7.55e-09 | -4.40e-01 | -0.0763 |
| 10015 | PDCD6IP | A001-C-203 | Human | Colorectum | FAP | 3.88e-10 | -1.96e-01 | -0.0481 |
| 10015 | PDCD6IP | A002-C-116 | Human | Colorectum | FAP | 7.74e-28 | -4.61e-01 | -0.0452 |
| 10015 | PDCD6IP | A014-C-008 | Human | Colorectum | FAP | 2.83e-10 | -4.20e-01 | -0.191 |
| Page: 1 2 3 4 5 6 7 8 |
| Tissue | Expression Dynamics | Abbreviation |
| Colorectum (GSE201348) |  | FAP: Familial adenomatous polyposis |
| CRC: Colorectal cancer | ||
| Colorectum (HTA11) |  | AD: Adenomas |
| SER: Sessile serrated lesions | ||
| MSI-H: Microsatellite-high colorectal cancer | ||
| MSS: Microsatellite stable colorectal cancer | ||
| Esophagus | 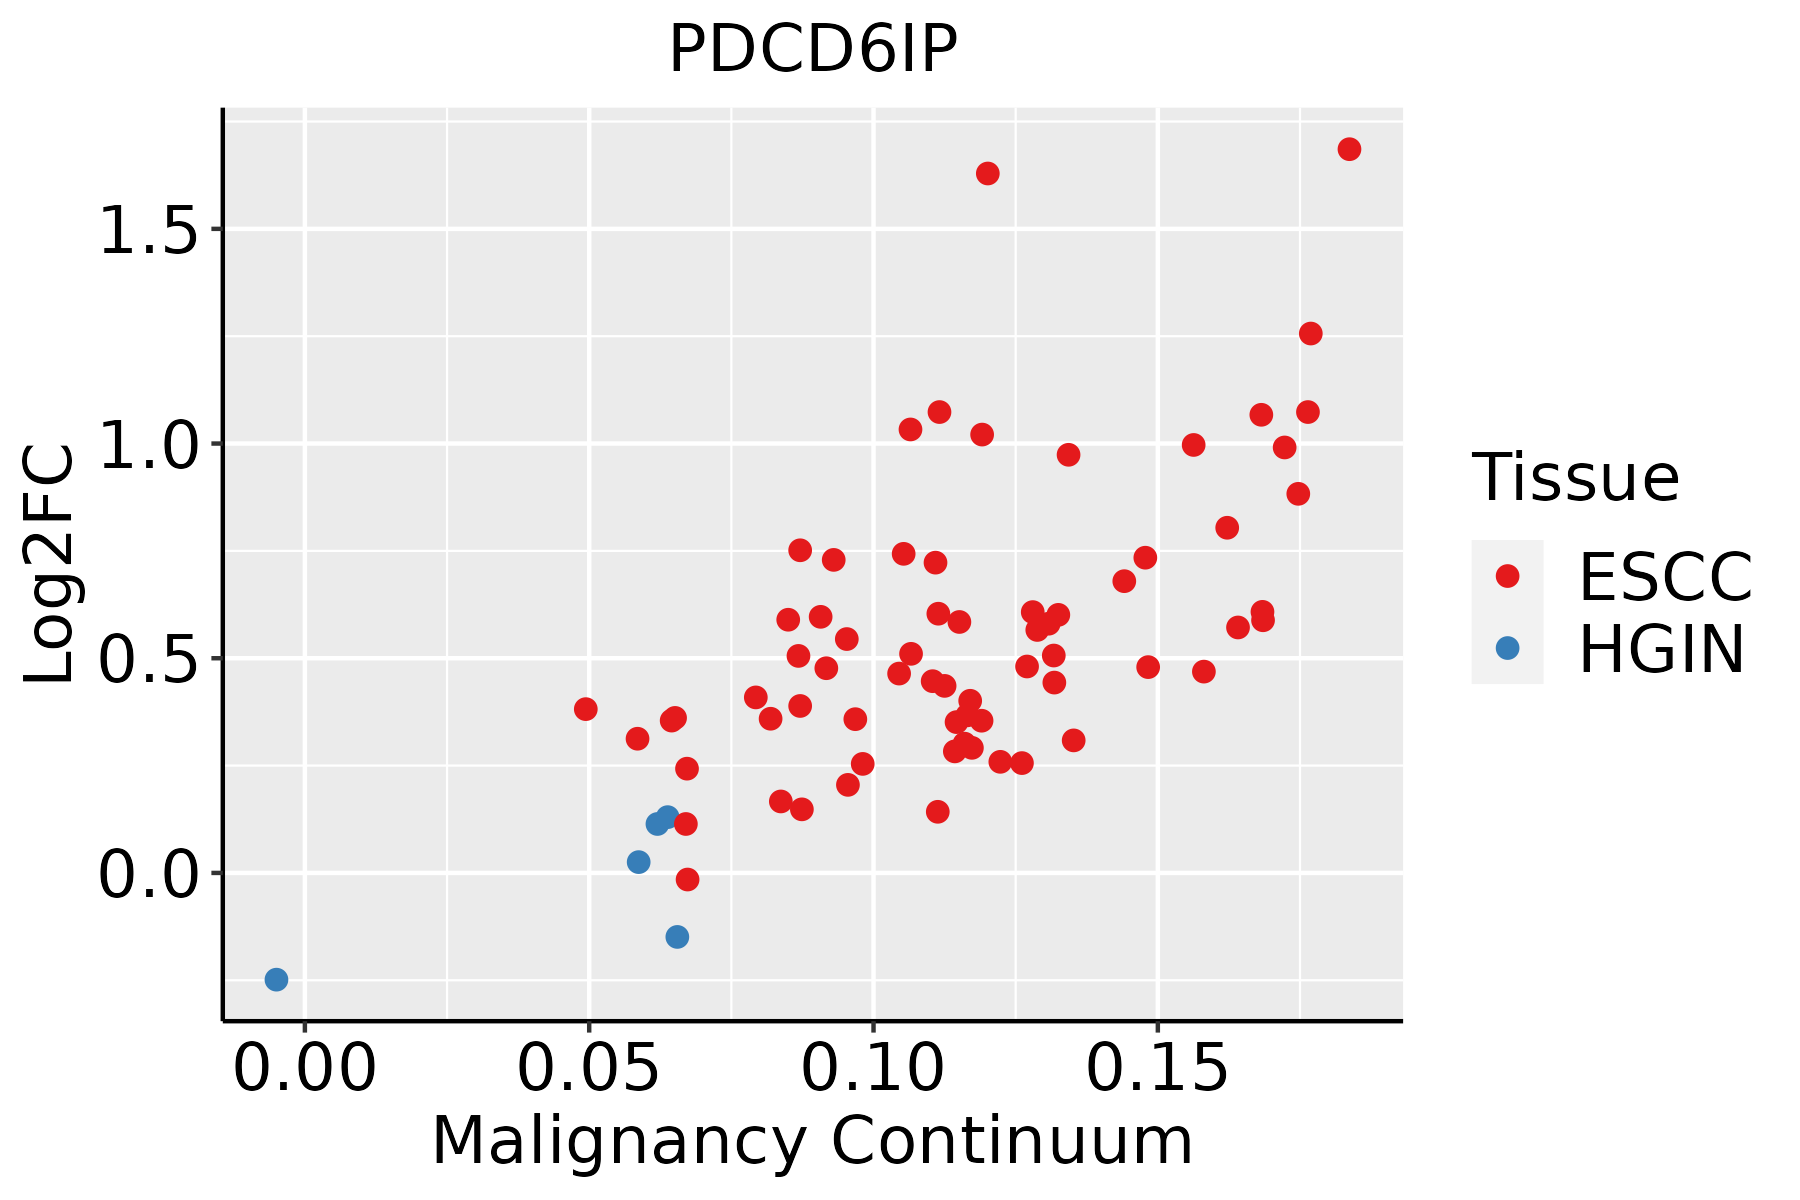 | ESCC: Esophageal squamous cell carcinoma |
| HGIN: High-grade intraepithelial neoplasias | ||
| LGIN: Low-grade intraepithelial neoplasias | ||
| Liver | 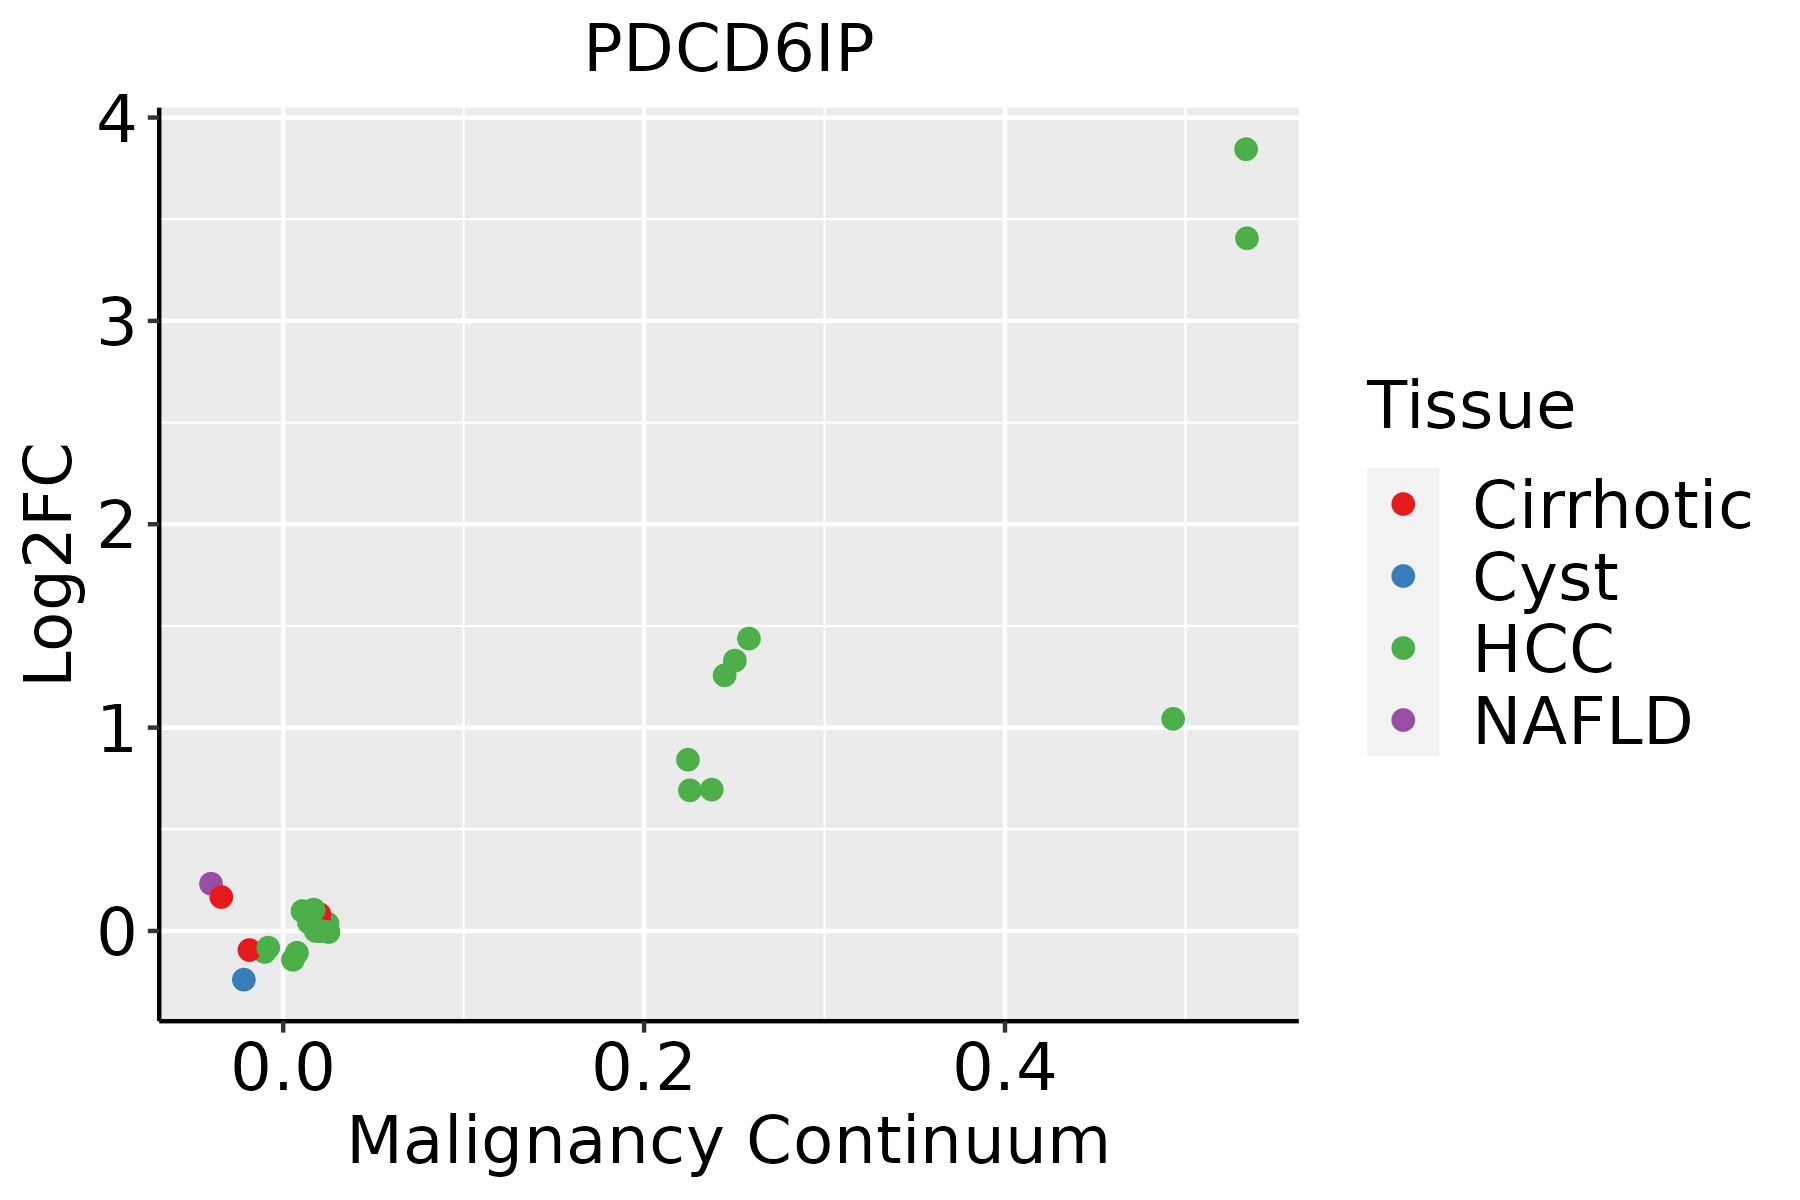 | HCC: Hepatocellular carcinoma |
| NAFLD: Non-alcoholic fatty liver disease | ||
| Oral Cavity | 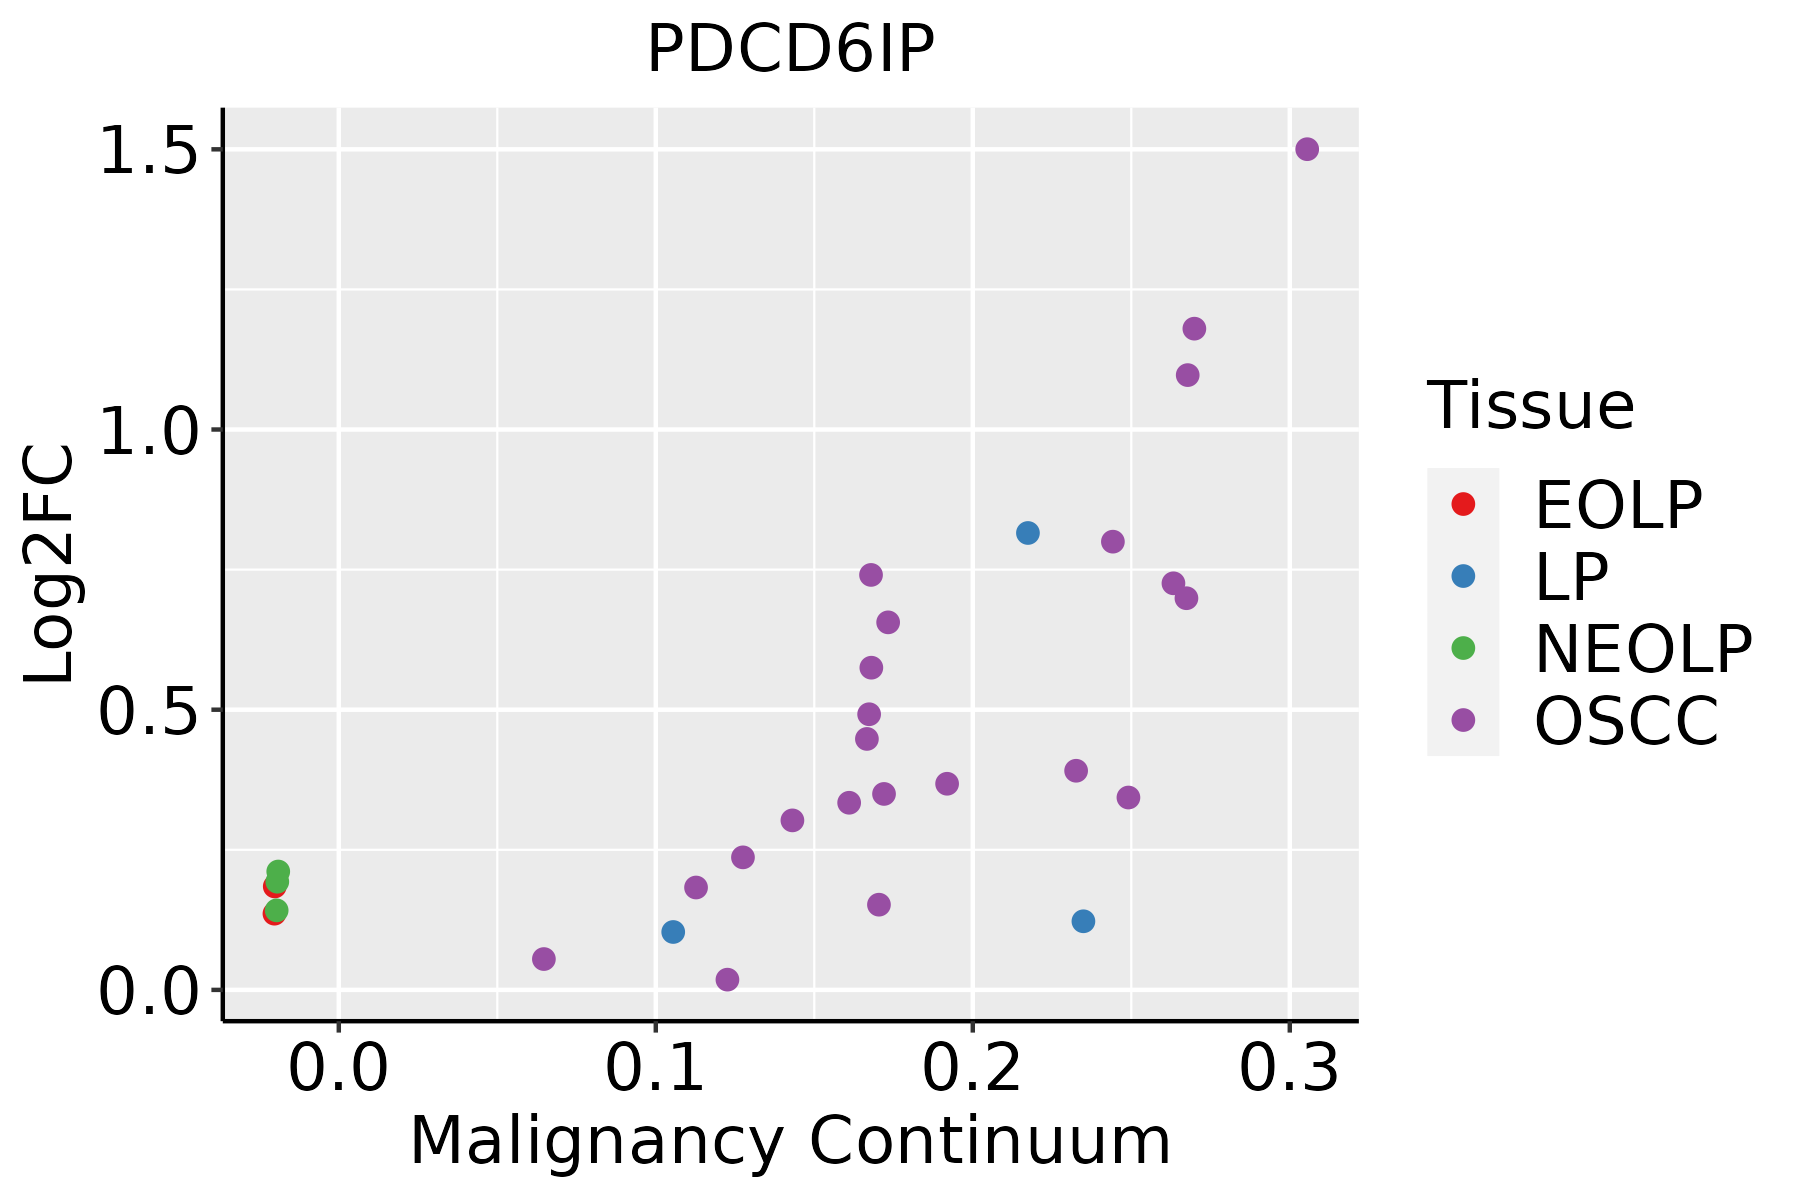 | EOLP: Erosive Oral lichen planus |
| LP: leukoplakia | ||
| NEOLP: Non-erosive oral lichen planus | ||
| OSCC: Oral squamous cell carcinoma | ||
| Prostate | 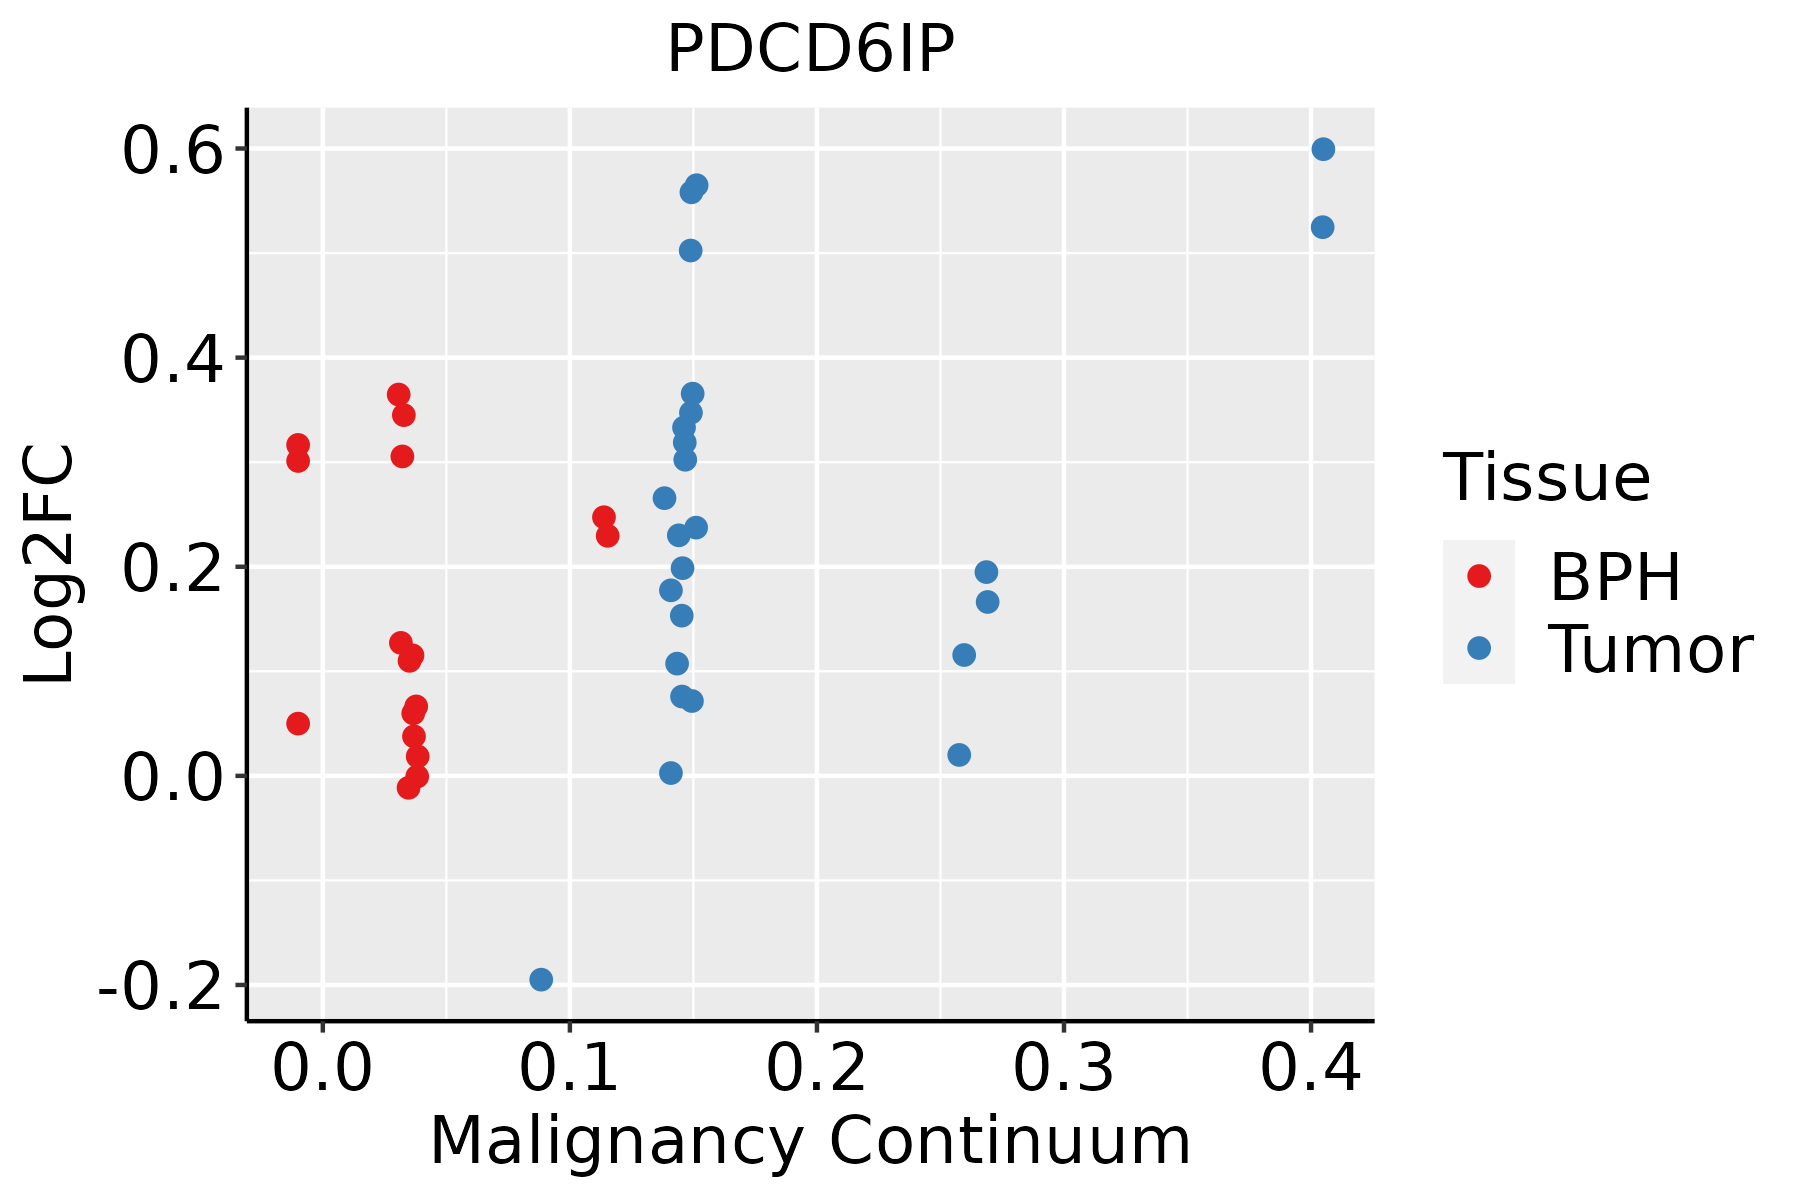 | BPH: Benign Prostatic Hyperplasia |
| Skin |  | AK: Actinic keratosis |
| cSCC: Cutaneous squamous cell carcinoma | ||
| SCCIS:squamous cell carcinoma in situ | ||
| Thyroid |  | ATC: Anaplastic thyroid cancer |
| HT: Hashimoto's thyroiditis | ||
| PTC: Papillary thyroid cancer |
| ∗log2FC in expression of this searched gene in stem-like cells from each diseased tissue sample relative to stem-like cells in normal samples in each tissue plotted against the malignancy continuum. Samples are colored based on if they are from different disease stage. |
Top |
Malignant transformation related pathway analysis |
| Find out the enriched GO biological processes and KEGG pathways involved in transition from healthy to precancer to cancer |
| Tissue | Disease Stage | Enriched GO biological Processes |
| Colorectum | AD |  |
| Colorectum | SER |  |
| Colorectum | MSS |  |
| Colorectum | MSI-H |  |
| Colorectum | FAP |  |
| ∗Top 15 enriched GO BP terms are showed in the bar plot of each disease state in each tissue. Each row represents a significant GO biological process which is colored according to the -log10(p.adjust). |
| Page: 1 2 3 4 5 6 7 8 9 |
| GO ID | Tissue | Disease Stage | Description | Gene Ratio | Bg Ratio | pvalue | p.adjust | Count |
| GO:009055919 | Thyroid | ATC | regulation of membrane permeability | 42/6293 | 78/18723 | 1.82e-04 | 1.23e-03 | 42 |
| GO:000704324 | Thyroid | ATC | cell-cell junction assembly | 70/6293 | 146/18723 | 2.24e-04 | 1.46e-03 | 70 |
| GO:003970215 | Thyroid | ATC | viral budding via host ESCRT complex | 15/6293 | 21/18723 | 4.45e-04 | 2.64e-03 | 15 |
| GO:190211713 | Thyroid | ATC | positive regulation of organelle assembly | 36/6293 | 67/18723 | 5.41e-04 | 3.13e-03 | 36 |
| GO:004675515 | Thyroid | ATC | viral budding | 17/6293 | 26/18723 | 9.13e-04 | 4.92e-03 | 17 |
| GO:003508815 | Thyroid | ATC | establishment or maintenance of apical/basal cell polarity | 27/6293 | 49/18723 | 1.58e-03 | 7.99e-03 | 27 |
| GO:006124515 | Thyroid | ATC | establishment or maintenance of bipolar cell polarity | 27/6293 | 49/18723 | 1.58e-03 | 7.99e-03 | 27 |
| GO:004519715 | Thyroid | ATC | establishment or maintenance of epithelial cell apical/basal polarity | 24/6293 | 44/18723 | 3.39e-03 | 1.52e-02 | 24 |
| GO:012019318 | Thyroid | ATC | tight junction organization | 39/6293 | 80/18723 | 3.55e-03 | 1.57e-02 | 39 |
| GO:004660512 | Thyroid | ATC | regulation of centrosome cycle | 26/6293 | 49/18723 | 3.87e-03 | 1.68e-02 | 26 |
| GO:00512981 | Thyroid | ATC | centrosome duplication | 36/6293 | 73/18723 | 3.91e-03 | 1.70e-02 | 36 |
| GO:004329722 | Thyroid | ATC | apical junction assembly | 38/6293 | 78/18723 | 4.03e-03 | 1.73e-02 | 38 |
| GO:001082411 | Thyroid | ATC | regulation of centrosome duplication | 24/6293 | 45/18723 | 4.97e-03 | 2.03e-02 | 24 |
| GO:012019217 | Thyroid | ATC | tight junction assembly | 35/6293 | 74/18723 | 9.97e-03 | 3.63e-02 | 35 |
| Page: 1 2 3 4 5 6 7 8 9 10 11 12 13 14 15 16 17 18 19 20 21 22 23 24 25 |
| Pathway ID | Tissue | Disease Stage | Description | Gene Ratio | Bg Ratio | pvalue | p.adjust | qvalue | Count |
| hsa04144 | Colorectum | AD | Endocytosis | 111/2092 | 251/8465 | 5.95e-12 | 1.42e-10 | 9.08e-11 | 111 |
| hsa041441 | Colorectum | AD | Endocytosis | 111/2092 | 251/8465 | 5.95e-12 | 1.42e-10 | 9.08e-11 | 111 |
| hsa041446 | Colorectum | FAP | Endocytosis | 78/1404 | 251/8465 | 6.20e-09 | 2.96e-07 | 1.80e-07 | 78 |
| hsa041447 | Colorectum | FAP | Endocytosis | 78/1404 | 251/8465 | 6.20e-09 | 2.96e-07 | 1.80e-07 | 78 |
| hsa041448 | Colorectum | CRC | Endocytosis | 65/1091 | 251/8465 | 1.27e-08 | 1.06e-06 | 7.19e-07 | 65 |
| hsa041449 | Colorectum | CRC | Endocytosis | 65/1091 | 251/8465 | 1.27e-08 | 1.06e-06 | 7.19e-07 | 65 |
| hsa0414429 | Esophagus | HGIN | Endocytosis | 76/1383 | 251/8465 | 1.74e-08 | 3.34e-07 | 2.65e-07 | 76 |
| hsa04144113 | Esophagus | HGIN | Endocytosis | 76/1383 | 251/8465 | 1.74e-08 | 3.34e-07 | 2.65e-07 | 76 |
| hsa04144210 | Esophagus | ESCC | Endocytosis | 186/4205 | 251/8465 | 9.74e-16 | 4.66e-14 | 2.39e-14 | 186 |
| hsa032509 | Esophagus | ESCC | Viral life cycle - HIV-1 | 54/4205 | 63/8465 | 2.01e-09 | 2.17e-08 | 1.11e-08 | 54 |
| hsa0414437 | Esophagus | ESCC | Endocytosis | 186/4205 | 251/8465 | 9.74e-16 | 4.66e-14 | 2.39e-14 | 186 |
| hsa0325014 | Esophagus | ESCC | Viral life cycle - HIV-1 | 54/4205 | 63/8465 | 2.01e-09 | 2.17e-08 | 1.11e-08 | 54 |
| hsa0414412 | Liver | Cirrhotic | Endocytosis | 119/2530 | 251/8465 | 2.33e-09 | 4.56e-08 | 2.81e-08 | 119 |
| hsa0414413 | Liver | Cirrhotic | Endocytosis | 119/2530 | 251/8465 | 2.33e-09 | 4.56e-08 | 2.81e-08 | 119 |
| hsa0414422 | Liver | HCC | Endocytosis | 178/4020 | 251/8465 | 2.03e-14 | 5.22e-13 | 2.91e-13 | 178 |
| hsa032502 | Liver | HCC | Viral life cycle - HIV-1 | 46/4020 | 63/8465 | 3.25e-05 | 1.88e-04 | 1.04e-04 | 46 |
| hsa0414432 | Liver | HCC | Endocytosis | 178/4020 | 251/8465 | 2.03e-14 | 5.22e-13 | 2.91e-13 | 178 |
| hsa0325011 | Liver | HCC | Viral life cycle - HIV-1 | 46/4020 | 63/8465 | 3.25e-05 | 1.88e-04 | 1.04e-04 | 46 |
| hsa0414427 | Oral cavity | OSCC | Endocytosis | 174/3704 | 251/8465 | 9.42e-17 | 4.51e-15 | 2.29e-15 | 174 |
| hsa032508 | Oral cavity | OSCC | Viral life cycle - HIV-1 | 45/3704 | 63/8465 | 7.62e-06 | 3.59e-05 | 1.83e-05 | 45 |
| Page: 1 2 |
Top |
Cell-cell communication analysis |
| Identification of potential cell-cell interactions between two cell types and their ligand-receptor pairs for different disease states |
| Ligand | Receptor | LRpair | Pathway | Tissue | Disease Stage |
| Page: 1 |
Top |
Single-cell gene regulatory network inference analysis |
| Find out the significant the regulons (TFs) and the target genes of each regulon across cell types for different disease states |
| TF | Cell Type | Tissue | Disease Stage | Target Gene | RSS | Regulon Activity |
| ∗The dot plots of a searched regulon are shown for all cell subpopulations in each disease state of each tissue based on the regulon specific score inferred using pySCENIC and by calculating the average expression. |
| Page: 1 |
Top |
Somatic mutation of malignant transformation related genes |
| Annotation of somatic variants for genes involved in malignant transformation |
| Hugo Symbol | Variant Class | Variant Classification | dbSNP RS | HGVSc | HGVSp | HGVSp Short | SWISSPROT | BIOTYPE | SIFT | PolyPhen | Tumor Sample Barcode | Tissue | Histology | Sex | Age | Stage | Therapy Types | Drugs | Outcome |
| PDCD6IP | SNV | Missense_Mutation | rs3203779 | c.2369N>T | p.Ala790Val | p.A790V | Q8WUM4 | protein_coding | tolerated(0.55) | benign(0) | TCGA-AO-A0J7-01 | Breast | breast invasive carcinoma | Female | >=65 | I/II | Chemotherapy | doxorubicin | SD |
| PDCD6IP | SNV | Missense_Mutation | c.323N>T | p.Ser108Phe | p.S108F | Q8WUM4 | protein_coding | deleterious(0.02) | possibly_damaging(0.496) | TCGA-AR-A1AX-01 | Breast | breast invasive carcinoma | Female | <65 | I/II | Chemotherapy | cytoxan | SD | |
| PDCD6IP | SNV | Missense_Mutation | novel | c.2466N>T | p.Met822Ile | p.M822I | Q8WUM4 | protein_coding | deleterious(0.02) | benign(0.015) | TCGA-S3-AA15-01 | Breast | breast invasive carcinoma | Female | <65 | I/II | Chemotherapy | adriamycin | CR |
| PDCD6IP | SNV | Missense_Mutation | c.427N>A | p.Asp143Asn | p.D143N | Q8WUM4 | protein_coding | deleterious(0.03) | probably_damaging(0.971) | TCGA-C5-A1BM-01 | Cervix | cervical & endocervical cancer | Female | >=65 | I/II | Unknown | Unknown | SD | |
| PDCD6IP | SNV | Missense_Mutation | c.323N>G | p.Ser108Cys | p.S108C | Q8WUM4 | protein_coding | deleterious(0.02) | possibly_damaging(0.676) | TCGA-LP-A4AV-01 | Cervix | cervical & endocervical cancer | Female | <65 | I/II | Unknown | Unknown | SD | |
| PDCD6IP | SNV | Missense_Mutation | novel | c.1561N>T | p.His521Tyr | p.H521Y | Q8WUM4 | protein_coding | deleterious(0.03) | possibly_damaging(0.579) | TCGA-VS-A958-01 | Cervix | cervical & endocervical cancer | Female | <65 | I/II | Chemotherapy | cisplatin | CR |
| PDCD6IP | SNV | Missense_Mutation | c.2084N>T | p.Lys695Ile | p.K695I | Q8WUM4 | protein_coding | deleterious(0) | probably_damaging(0.977) | TCGA-A6-2686-01 | Colorectum | colon adenocarcinoma | Female | >=65 | I/II | Unknown | Unknown | SD | |
| PDCD6IP | SNV | Missense_Mutation | c.1625N>T | p.Ala542Val | p.A542V | Q8WUM4 | protein_coding | deleterious(0.01) | benign(0.131) | TCGA-AA-A02R-01 | Colorectum | colon adenocarcinoma | Female | >=65 | I/II | Unknown | Unknown | PD | |
| PDCD6IP | SNV | Missense_Mutation | c.593N>C | p.Val198Ala | p.V198A | Q8WUM4 | protein_coding | tolerated(0.14) | benign(0.423) | TCGA-AY-6197-01 | Colorectum | colon adenocarcinoma | Male | <65 | I/II | Unknown | Unknown | SD | |
| PDCD6IP | SNV | Missense_Mutation | novel | c.1064N>C | p.Lys355Thr | p.K355T | Q8WUM4 | protein_coding | tolerated(0.17) | benign(0.323) | TCGA-AZ-6607-01 | Colorectum | colon adenocarcinoma | Male | >=65 | III/IV | Unknown | Unknown | PD |
| Page: 1 2 3 4 5 6 7 |
Top |
Related drugs of malignant transformation related genes |
| Identification of chemicals and drugs interact with genes involved in malignant transfromation |
| (DGIdb 4.0) |
| Entrez ID | Symbol | Category | Interaction Types | Drug Claim Name | Drug Name | PMIDs |
| Page: 1 |

Copyright 2023-Present -The University of Texas Health Science Center at Houston |