
|
|||||
|
 | |
| |
| |
| |
| |
| |
|
Gene: HMGCR |
Gene summary for HMGCR |
| Gene information | Species | Human | Gene symbol | HMGCR | Gene ID | 3156 |
| Gene name | 3-hydroxy-3-methylglutaryl-CoA reductase | |
| Gene Alias | LDLCQ3 | |
| Cytomap | 5q13.3 | |
| Gene Type | protein-coding | GO ID | GO:0000165 | UniProtAcc | A0A024RAP2 |
Top |
Malignant transformation analysis |
| Identification of the aberrant gene expression in precancerous and cancerous lesions by comparing the gene expression of stem-like cells in diseased tissues with normal stem cells |
| Entrez ID | Symbol | Replicates | Species | Organ | Tissue | Adj P-value | Log2FC | Malignancy |
| 3156 | HMGCR | HTA11_347_2000001011 | Human | Colorectum | AD | 6.23e-05 | 3.78e-01 | -0.1954 |
| 3156 | HMGCR | HTA11_99999974143_84620 | Human | Colorectum | MSS | 1.52e-03 | -2.60e-01 | 0.3005 |
| 3156 | HMGCR | A015-C-203 | Human | Colorectum | FAP | 2.94e-05 | -1.92e-01 | -0.1294 |
| 3156 | HMGCR | A002-C-201 | Human | Colorectum | FAP | 4.91e-04 | -1.91e-01 | 0.0324 |
| 3156 | HMGCR | A001-C-119 | Human | Colorectum | FAP | 9.19e-03 | -2.62e-01 | -0.1557 |
| 3156 | HMGCR | A001-C-108 | Human | Colorectum | FAP | 1.59e-05 | -2.69e-01 | -0.0272 |
| 3156 | HMGCR | A002-C-205 | Human | Colorectum | FAP | 4.84e-07 | -2.54e-01 | -0.1236 |
| 3156 | HMGCR | A014-C-108 | Human | Colorectum | FAP | 1.34e-04 | -2.95e-01 | -0.124 |
| 3156 | HMGCR | A015-C-006 | Human | Colorectum | FAP | 5.77e-03 | -2.24e-01 | -0.0994 |
| 3156 | HMGCR | A015-C-106 | Human | Colorectum | FAP | 6.11e-05 | -2.52e-01 | -0.0511 |
| 3156 | HMGCR | A002-C-114 | Human | Colorectum | FAP | 1.30e-07 | -3.05e-01 | -0.1561 |
| 3156 | HMGCR | A015-C-104 | Human | Colorectum | FAP | 1.88e-08 | -3.05e-01 | -0.1899 |
| 3156 | HMGCR | A001-C-014 | Human | Colorectum | FAP | 1.53e-02 | -2.45e-01 | 0.0135 |
| 3156 | HMGCR | A002-C-016 | Human | Colorectum | FAP | 7.27e-05 | -2.15e-01 | 0.0521 |
| 3156 | HMGCR | A015-C-002 | Human | Colorectum | FAP | 2.33e-02 | -2.52e-01 | -0.0763 |
| 3156 | HMGCR | A001-C-203 | Human | Colorectum | FAP | 6.25e-03 | -2.31e-01 | -0.0481 |
| 3156 | HMGCR | A002-C-116 | Human | Colorectum | FAP | 2.67e-08 | -2.57e-01 | -0.0452 |
| 3156 | HMGCR | A018-E-020 | Human | Colorectum | FAP | 2.10e-04 | -1.68e-01 | -0.2034 |
| 3156 | HMGCR | F034 | Human | Colorectum | FAP | 1.68e-03 | -2.15e-01 | -0.0665 |
| 3156 | HMGCR | CRC-1-8810 | Human | Colorectum | CRC | 2.03e-03 | -2.10e-01 | 0.6257 |
| Page: 1 2 3 4 5 |
| Tissue | Expression Dynamics | Abbreviation |
| Colorectum (GSE201348) | 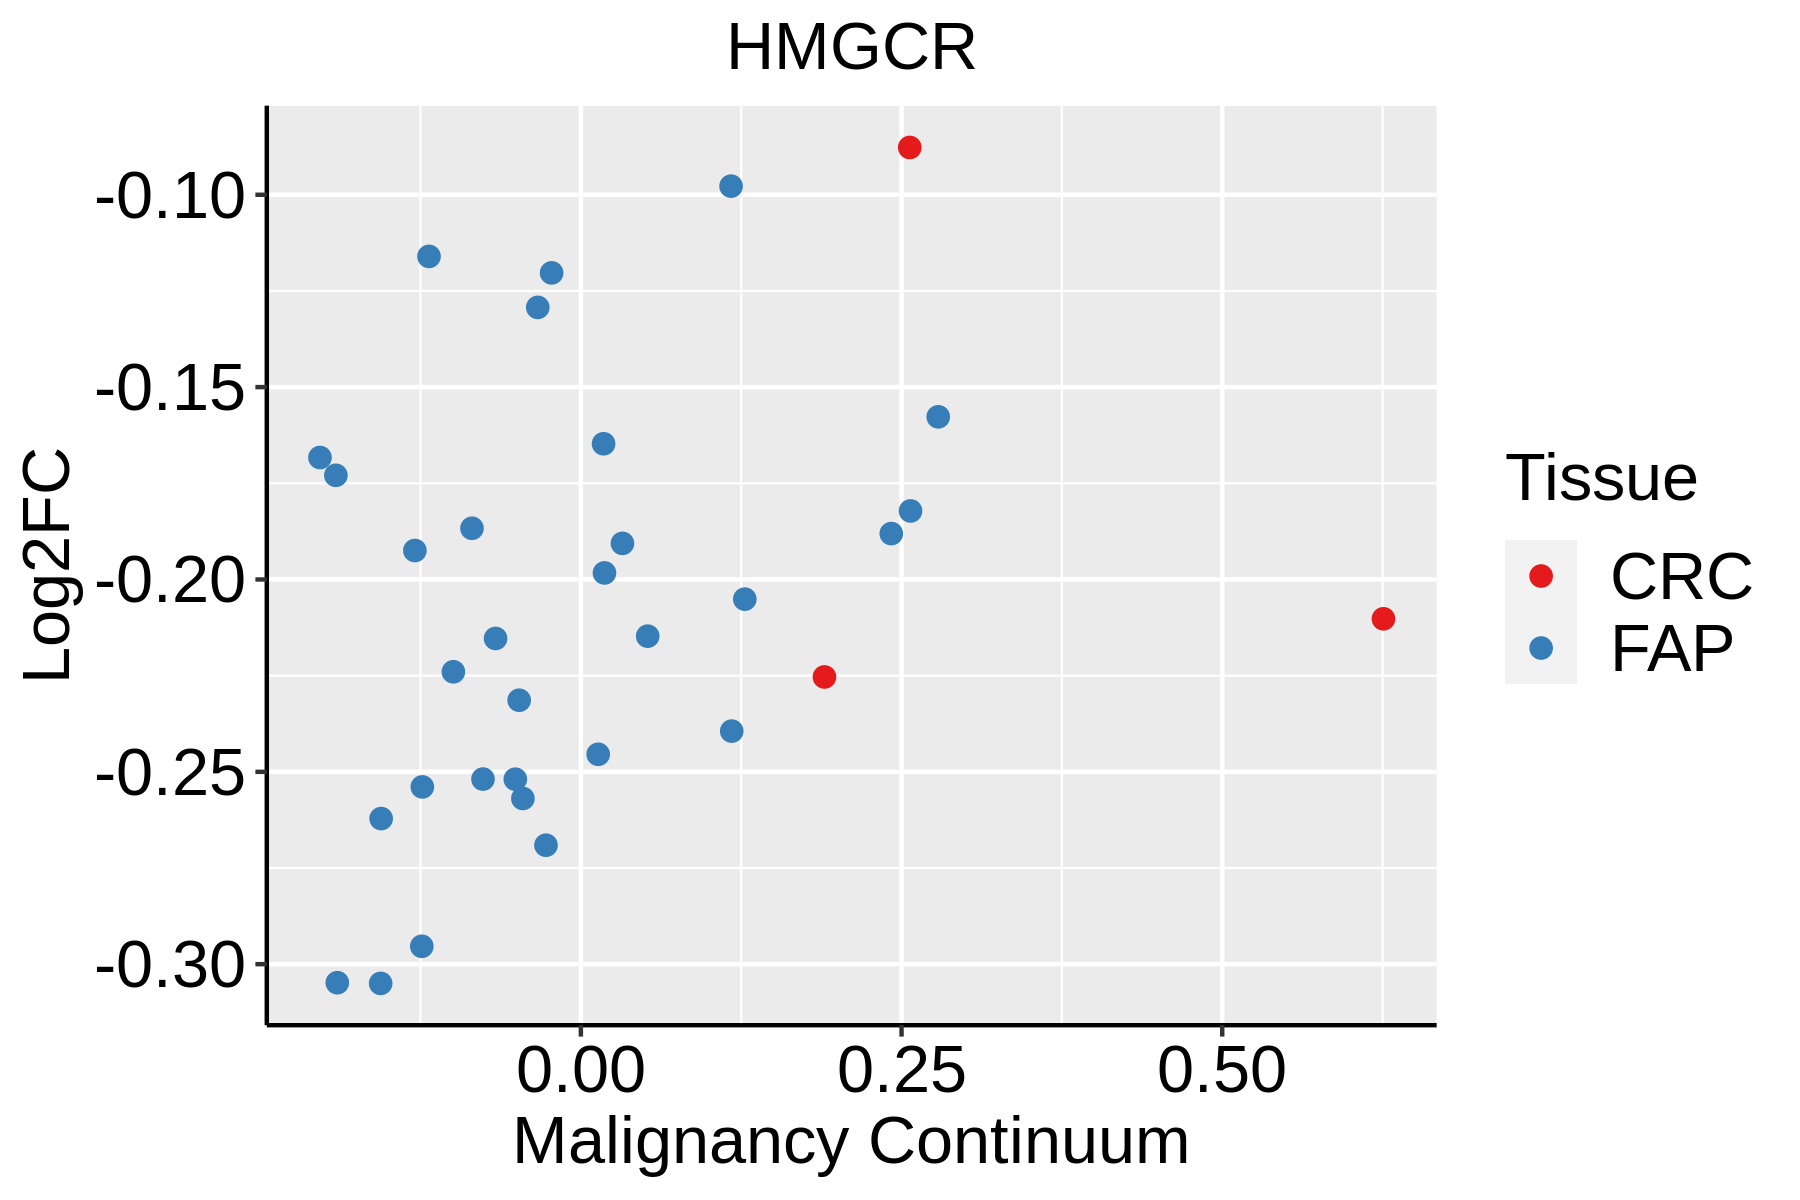 | FAP: Familial adenomatous polyposis |
| CRC: Colorectal cancer | ||
| Colorectum (HTA11) |  | AD: Adenomas |
| SER: Sessile serrated lesions | ||
| MSI-H: Microsatellite-high colorectal cancer | ||
| MSS: Microsatellite stable colorectal cancer | ||
| Endometrium |  | AEH: Atypical endometrial hyperplasia |
| EEC: Endometrioid Cancer | ||
| Esophagus | 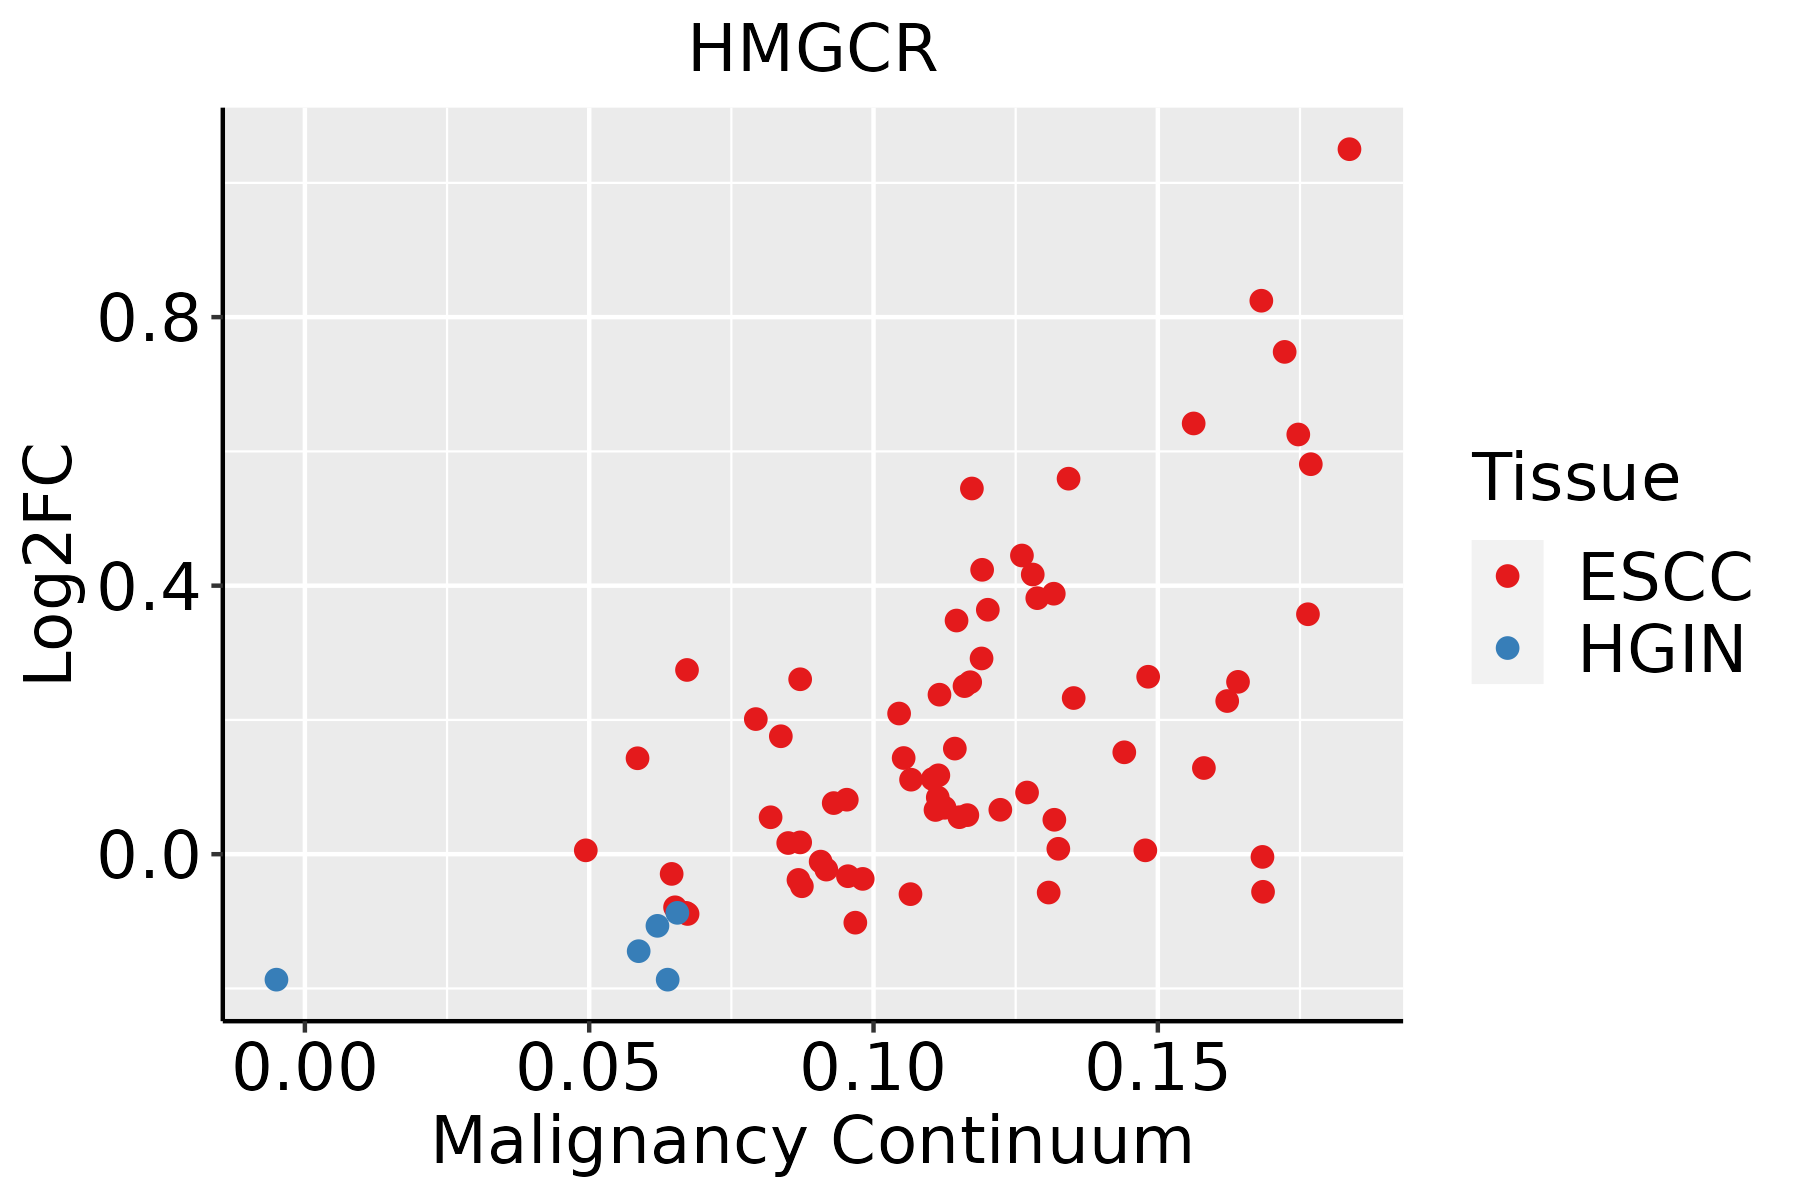 | ESCC: Esophageal squamous cell carcinoma |
| HGIN: High-grade intraepithelial neoplasias | ||
| LGIN: Low-grade intraepithelial neoplasias | ||
| Liver | 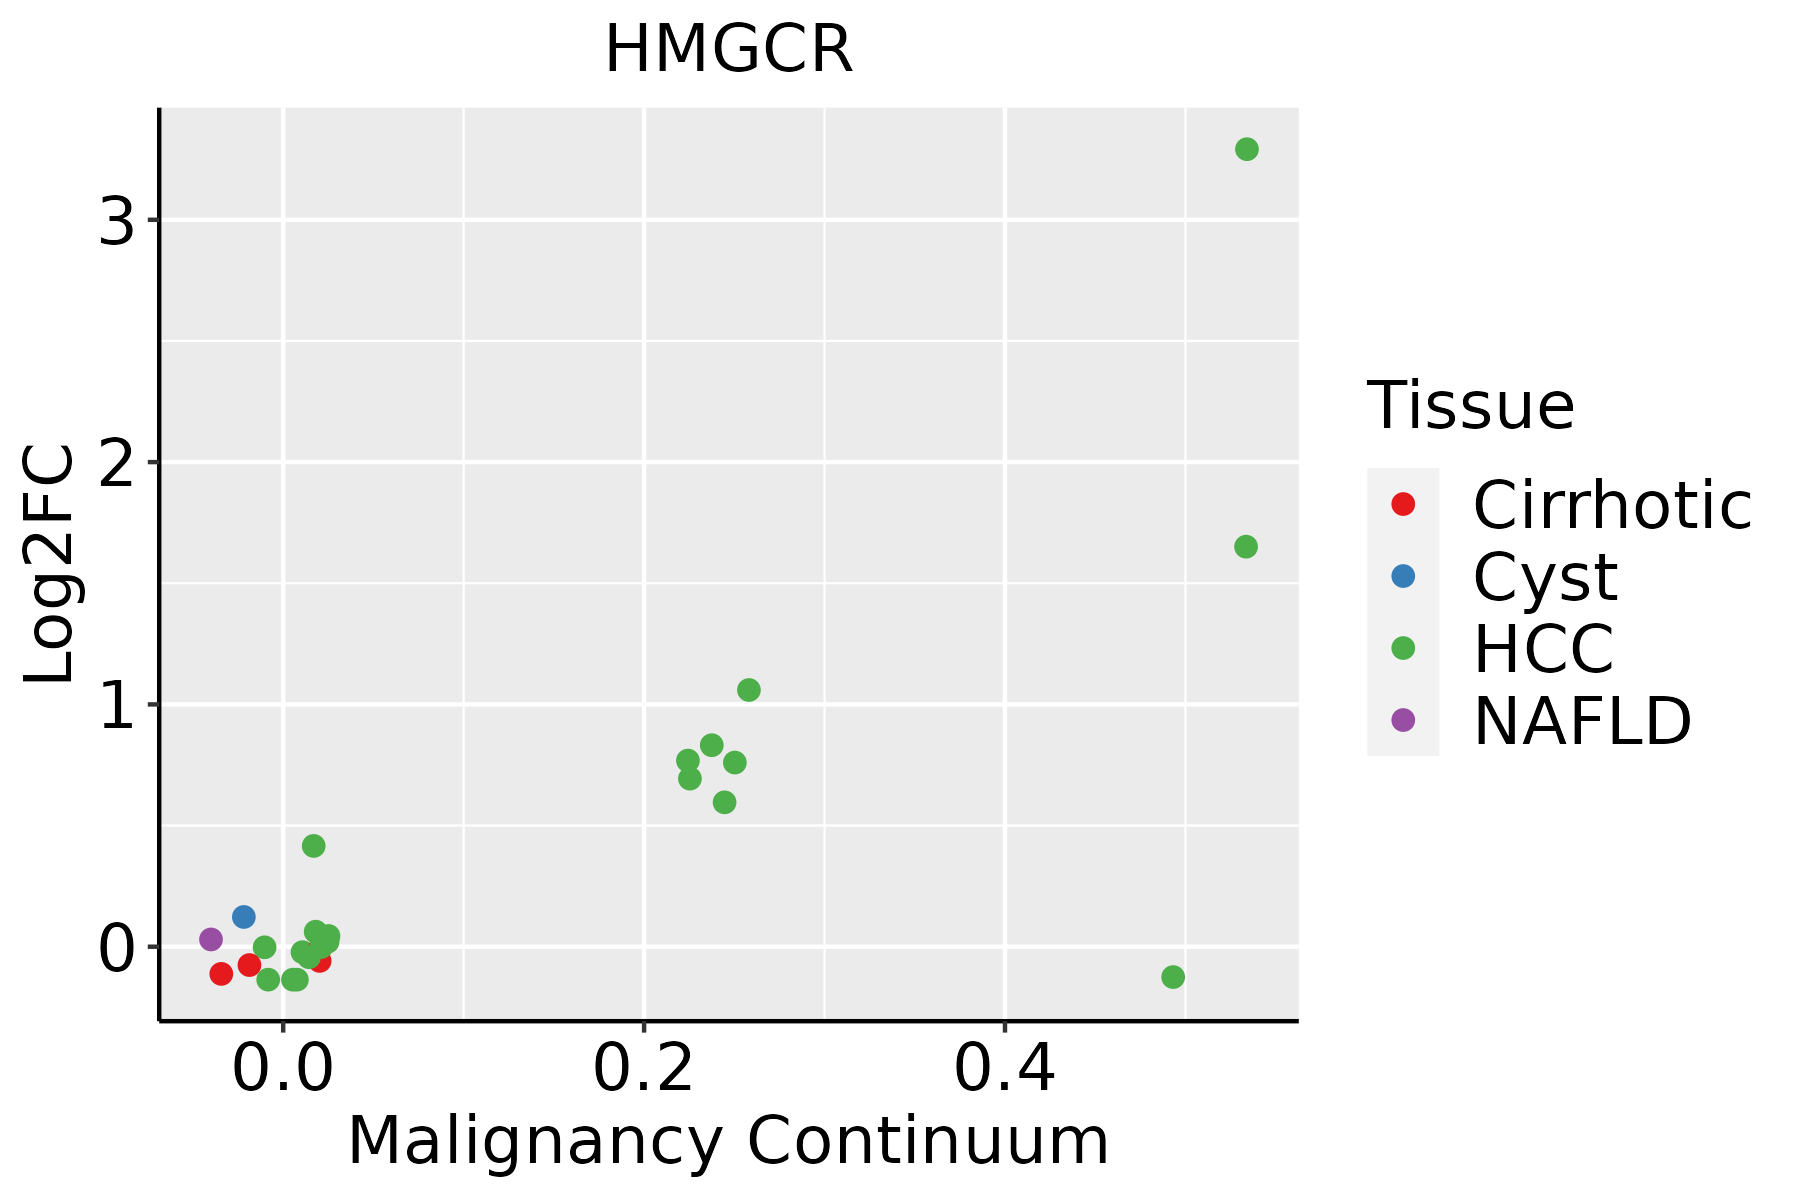 | HCC: Hepatocellular carcinoma |
| NAFLD: Non-alcoholic fatty liver disease | ||
| Oral Cavity |  | EOLP: Erosive Oral lichen planus |
| LP: leukoplakia | ||
| NEOLP: Non-erosive oral lichen planus | ||
| OSCC: Oral squamous cell carcinoma |
| ∗log2FC in expression of this searched gene in stem-like cells from each diseased tissue sample relative to stem-like cells in normal samples in each tissue plotted against the malignancy continuum. Samples are colored based on if they are from different disease stage. |
Top |
Malignant transformation related pathway analysis |
| Find out the enriched GO biological processes and KEGG pathways involved in transition from healthy to precancer to cancer |
| Tissue | Disease Stage | Enriched GO biological Processes |
| Colorectum | AD |  |
| Colorectum | SER |  |
| Colorectum | MSS |  |
| Colorectum | MSI-H |  |
| Colorectum | FAP |  |
| ∗Top 15 enriched GO BP terms are showed in the bar plot of each disease state in each tissue. Each row represents a significant GO biological process which is colored according to the -log10(p.adjust). |
| Page: 1 2 3 4 5 6 7 8 9 |
| GO ID | Tissue | Disease Stage | Description | Gene Ratio | Bg Ratio | pvalue | p.adjust | Count |
| GO:000167822 | Liver | HCC | cellular glucose homeostasis | 95/7958 | 172/18723 | 4.95e-04 | 3.24e-03 | 95 |
| GO:007133112 | Liver | HCC | cellular response to hexose stimulus | 85/7958 | 153/18723 | 7.47e-04 | 4.52e-03 | 85 |
| GO:007133312 | Liver | HCC | cellular response to glucose stimulus | 84/7958 | 151/18723 | 7.57e-04 | 4.56e-03 | 84 |
| GO:00434097 | Liver | HCC | negative regulation of MAPK cascade | 98/7958 | 180/18723 | 7.88e-04 | 4.74e-03 | 98 |
| GO:007030222 | Liver | HCC | regulation of stress-activated protein kinase signaling cascade | 105/7958 | 195/18723 | 8.79e-04 | 5.20e-03 | 105 |
| GO:007132612 | Liver | HCC | cellular response to monosaccharide stimulus | 85/7958 | 154/18723 | 9.78e-04 | 5.68e-03 | 85 |
| GO:0038183 | Liver | HCC | bile acid signaling pathway | 12/7958 | 14/18723 | 1.17e-03 | 6.54e-03 | 12 |
| GO:007132212 | Liver | HCC | cellular response to carbohydrate stimulus | 89/7958 | 163/18723 | 1.19e-03 | 6.62e-03 | 89 |
| GO:003287222 | Liver | HCC | regulation of stress-activated MAPK cascade | 102/7958 | 192/18723 | 1.86e-03 | 9.49e-03 | 102 |
| GO:000672011 | Liver | HCC | isoprenoid metabolic process | 65/7958 | 116/18723 | 2.23e-03 | 1.11e-02 | 65 |
| GO:0015936 | Liver | HCC | coenzyme A metabolic process | 14/7958 | 18/18723 | 2.57e-03 | 1.23e-02 | 14 |
| GO:19049501 | Liver | HCC | negative regulation of establishment of protein localization | 72/7958 | 131/18723 | 2.65e-03 | 1.27e-02 | 72 |
| GO:00611791 | Liver | HCC | negative regulation of insulin secretion involved in cellular response to glucose stimulus | 9/7958 | 10/18723 | 2.79e-03 | 1.31e-02 | 9 |
| GO:00363141 | Liver | HCC | response to sterol | 24/7958 | 36/18723 | 2.95e-03 | 1.38e-02 | 24 |
| GO:00093146 | Liver | HCC | response to radiation | 223/7958 | 456/18723 | 3.08e-03 | 1.43e-02 | 223 |
| GO:19016611 | Liver | HCC | quinone metabolic process | 26/7958 | 40/18723 | 3.40e-03 | 1.55e-02 | 26 |
| GO:00550902 | Liver | HCC | acylglycerol homeostasis | 27/7958 | 42/18723 | 3.60e-03 | 1.60e-02 | 27 |
| GO:00703282 | Liver | HCC | triglyceride homeostasis | 27/7958 | 42/18723 | 3.60e-03 | 1.60e-02 | 27 |
| GO:0071901 | Liver | HCC | negative regulation of protein serine/threonine kinase activity | 66/7958 | 120/18723 | 3.81e-03 | 1.68e-02 | 66 |
| GO:00512241 | Liver | HCC | negative regulation of protein transport | 69/7958 | 127/18723 | 4.67e-03 | 2.01e-02 | 69 |
| Page: 1 2 3 4 5 6 7 8 9 10 11 12 13 14 15 16 17 18 19 20 21 22 23 24 25 26 27 28 29 30 |
| Pathway ID | Tissue | Disease Stage | Description | Gene Ratio | Bg Ratio | pvalue | p.adjust | qvalue | Count |
| hsa04152 | Colorectum | AD | AMPK signaling pathway | 47/2092 | 121/8465 | 3.74e-04 | 2.82e-03 | 1.80e-03 | 47 |
| hsa041521 | Colorectum | AD | AMPK signaling pathway | 47/2092 | 121/8465 | 3.74e-04 | 2.82e-03 | 1.80e-03 | 47 |
| hsa041522 | Colorectum | MSS | AMPK signaling pathway | 41/1875 | 121/8465 | 1.91e-03 | 9.83e-03 | 6.03e-03 | 41 |
| hsa041523 | Colorectum | MSS | AMPK signaling pathway | 41/1875 | 121/8465 | 1.91e-03 | 9.83e-03 | 6.03e-03 | 41 |
| hsa041524 | Colorectum | FAP | AMPK signaling pathway | 37/1404 | 121/8465 | 8.97e-05 | 8.56e-04 | 5.21e-04 | 37 |
| hsa04976 | Colorectum | FAP | Bile secretion | 24/1404 | 89/8465 | 8.76e-03 | 3.21e-02 | 1.96e-02 | 24 |
| hsa041525 | Colorectum | FAP | AMPK signaling pathway | 37/1404 | 121/8465 | 8.97e-05 | 8.56e-04 | 5.21e-04 | 37 |
| hsa049761 | Colorectum | FAP | Bile secretion | 24/1404 | 89/8465 | 8.76e-03 | 3.21e-02 | 1.96e-02 | 24 |
| hsa041526 | Colorectum | CRC | AMPK signaling pathway | 31/1091 | 121/8465 | 1.04e-04 | 1.57e-03 | 1.07e-03 | 31 |
| hsa041527 | Colorectum | CRC | AMPK signaling pathway | 31/1091 | 121/8465 | 1.04e-04 | 1.57e-03 | 1.07e-03 | 31 |
| hsa0415210 | Esophagus | ESCC | AMPK signaling pathway | 80/4205 | 121/8465 | 1.73e-04 | 6.67e-04 | 3.42e-04 | 80 |
| hsa009005 | Esophagus | ESCC | Terpenoid backbone biosynthesis | 20/4205 | 23/8465 | 2.14e-04 | 7.87e-04 | 4.03e-04 | 20 |
| hsa0415213 | Esophagus | ESCC | AMPK signaling pathway | 80/4205 | 121/8465 | 1.73e-04 | 6.67e-04 | 3.42e-04 | 80 |
| hsa0090012 | Esophagus | ESCC | Terpenoid backbone biosynthesis | 20/4205 | 23/8465 | 2.14e-04 | 7.87e-04 | 4.03e-04 | 20 |
| hsa0415241 | Liver | HCC | AMPK signaling pathway | 77/4020 | 121/8465 | 2.32e-04 | 1.11e-03 | 6.18e-04 | 77 |
| hsa00900 | Liver | HCC | Terpenoid backbone biosynthesis | 17/4020 | 23/8465 | 9.26e-03 | 2.46e-02 | 1.37e-02 | 17 |
| hsa0415251 | Liver | HCC | AMPK signaling pathway | 77/4020 | 121/8465 | 2.32e-04 | 1.11e-03 | 6.18e-04 | 77 |
| hsa009001 | Liver | HCC | Terpenoid backbone biosynthesis | 17/4020 | 23/8465 | 9.26e-03 | 2.46e-02 | 1.37e-02 | 17 |
| hsa009004 | Oral cavity | OSCC | Terpenoid backbone biosynthesis | 19/3704 | 23/8465 | 1.55e-04 | 5.34e-04 | 2.72e-04 | 19 |
| hsa041529 | Oral cavity | OSCC | AMPK signaling pathway | 71/3704 | 121/8465 | 6.29e-04 | 1.86e-03 | 9.49e-04 | 71 |
| Page: 1 2 |
Top |
Cell-cell communication analysis |
| Identification of potential cell-cell interactions between two cell types and their ligand-receptor pairs for different disease states |
| Ligand | Receptor | LRpair | Pathway | Tissue | Disease Stage |
| Page: 1 |
Top |
Single-cell gene regulatory network inference analysis |
| Find out the significant the regulons (TFs) and the target genes of each regulon across cell types for different disease states |
| TF | Cell Type | Tissue | Disease Stage | Target Gene | RSS | Regulon Activity |
| ∗The dot plots of a searched regulon are shown for all cell subpopulations in each disease state of each tissue based on the regulon specific score inferred using pySCENIC and by calculating the average expression. |
| Page: 1 |
Top |
Somatic mutation of malignant transformation related genes |
| Annotation of somatic variants for genes involved in malignant transformation |
| Hugo Symbol | Variant Class | Variant Classification | dbSNP RS | HGVSc | HGVSp | HGVSp Short | SWISSPROT | BIOTYPE | SIFT | PolyPhen | Tumor Sample Barcode | Tissue | Histology | Sex | Age | Stage | Therapy Types | Drugs | Outcome |
| HMGCR | SNV | Missense_Mutation | rs144482710 | c.1062N>G | p.Ile354Met | p.I354M | P04035 | protein_coding | tolerated(0.15) | benign(0.03) | TCGA-A2-A0YK-01 | Breast | breast invasive carcinoma | Female | <65 | I/II | Chemotherapy | cytoxan | SD |
| HMGCR | SNV | Missense_Mutation | novel | c.1297N>A | p.Glu433Lys | p.E433K | P04035 | protein_coding | tolerated(0.31) | benign(0.007) | TCGA-A8-A0A7-01 | Breast | breast invasive carcinoma | Female | <65 | I/II | Unknown | Unknown | SD |
| HMGCR | SNV | Missense_Mutation | c.2184N>C | p.Met728Ile | p.M728I | P04035 | protein_coding | deleterious(0.01) | benign(0.001) | TCGA-AC-A23H-01 | Breast | breast invasive carcinoma | Female | >=65 | I/II | Unknown | Unknown | PD | |
| HMGCR | SNV | Missense_Mutation | novel | c.2537N>C | p.Val846Ala | p.V846A | P04035 | protein_coding | deleterious(0) | probably_damaging(0.999) | TCGA-AN-A046-01 | Breast | breast invasive carcinoma | Female | >=65 | I/II | Unknown | Unknown | SD |
| HMGCR | SNV | Missense_Mutation | rs777178244 | c.746C>T | p.Pro249Leu | p.P249L | P04035 | protein_coding | deleterious(0.03) | probably_damaging(0.986) | TCGA-AN-A0AK-01 | Breast | breast invasive carcinoma | Female | >=65 | I/II | Unknown | Unknown | SD |
| HMGCR | SNV | Missense_Mutation | novel | c.1380A>T | p.Lys460Asn | p.K460N | P04035 | protein_coding | tolerated(0.54) | benign(0.01) | TCGA-E2-A3DX-01 | Breast | breast invasive carcinoma | Female | <65 | III/IV | Chemotherapy | doxorubicin | SD |
| HMGCR | SNV | Missense_Mutation | c.761N>T | p.Gln254Leu | p.Q254L | P04035 | protein_coding | deleterious(0) | probably_damaging(0.998) | TCGA-GM-A2DB-01 | Breast | breast invasive carcinoma | Female | <65 | I/II | Chemotherapy | taxol | CR | |
| HMGCR | SNV | Missense_Mutation | c.762N>C | p.Gln254His | p.Q254H | P04035 | protein_coding | deleterious(0) | probably_damaging(0.999) | TCGA-GM-A2DB-01 | Breast | breast invasive carcinoma | Female | <65 | I/II | Chemotherapy | taxol | CR | |
| HMGCR | SNV | Missense_Mutation | c.1922G>A | p.Arg641His | p.R641H | P04035 | protein_coding | deleterious(0.01) | probably_damaging(0.985) | TCGA-2W-A8YY-01 | Cervix | cervical & endocervical cancer | Female | <65 | I/II | Chemotherapy | cisplatin | CR | |
| HMGCR | SNV | Missense_Mutation | c.109T>C | p.Phe37Leu | p.F37L | P04035 | protein_coding | tolerated(0.7) | benign(0.001) | TCGA-3L-AA1B-01 | Colorectum | colon adenocarcinoma | Female | <65 | I/II | Unknown | Unknown | SD |
| Page: 1 2 3 4 5 6 7 8 9 |
Top |
Related drugs of malignant transformation related genes |
| Identification of chemicals and drugs interact with genes involved in malignant transfromation |
| (DGIdb 4.0) |
| Entrez ID | Symbol | Category | Interaction Types | Drug Claim Name | Drug Name | PMIDs |
| 3156 | HMGCR | ENZYME, DRUGGABLE GENOME | inhibitor | 135649749 | ||
| 3156 | HMGCR | ENZYME, DRUGGABLE GENOME | Sterol derivative 1 | |||
| 3156 | HMGCR | ENZYME, DRUGGABLE GENOME | CRILVASTATIN | CRILVASTATIN | ||
| 3156 | HMGCR | ENZYME, DRUGGABLE GENOME | Crestor/TriLipix | |||
| 3156 | HMGCR | ENZYME, DRUGGABLE GENOME | inhibitor | 249565672 | ||
| 3156 | HMGCR | ENZYME, DRUGGABLE GENOME | inhibitor | 135652701 | LOVASTATIN | |
| 3156 | HMGCR | ENZYME, DRUGGABLE GENOME | SIMVASTATIN | SIMVASTATIN | ||
| 3156 | HMGCR | ENZYME, DRUGGABLE GENOME | inhibitor | 135649752 | ||
| 3156 | HMGCR | ENZYME, DRUGGABLE GENOME | inhibitor | CHEMBL393220 | ATORVASTATIN CALCIUM | |
| 3156 | HMGCR | ENZYME, DRUGGABLE GENOME | FLUVASTATIN | FLUVASTATIN |
| Page: 1 2 3 4 5 6 7 8 9 10 11 |

Copyright 2023-Present -The University of Texas Health Science Center at Houston |