
|
|||||
|
 | |
| |
| |
| |
| |
| |
|
Gene: EP300 |
Gene summary for EP300 |
| Gene information | Species | Human | Gene symbol | EP300 | Gene ID | 2033 |
| Gene name | E1A binding protein p300 | |
| Gene Alias | KAT3B | |
| Cytomap | 22q13.2 | |
| Gene Type | protein-coding | GO ID | GO:0000122 | UniProtAcc | Q09472 |
Top |
Malignant transformation analysis |
| Identification of the aberrant gene expression in precancerous and cancerous lesions by comparing the gene expression of stem-like cells in diseased tissues with normal stem cells |
| Entrez ID | Symbol | Replicates | Species | Organ | Tissue | Adj P-value | Log2FC | Malignancy |
| 2033 | EP300 | LZE4T | Human | Esophagus | ESCC | 2.23e-09 | 2.22e-01 | 0.0811 |
| 2033 | EP300 | LZE7T | Human | Esophagus | ESCC | 4.72e-02 | 3.66e-01 | 0.0667 |
| 2033 | EP300 | LZE8T | Human | Esophagus | ESCC | 3.40e-06 | 1.56e-01 | 0.067 |
| 2033 | EP300 | LZE20T | Human | Esophagus | ESCC | 5.92e-03 | 7.85e-02 | 0.0662 |
| 2033 | EP300 | LZE24T | Human | Esophagus | ESCC | 1.32e-09 | 2.92e-01 | 0.0596 |
| 2033 | EP300 | LZE21T | Human | Esophagus | ESCC | 1.24e-08 | 2.25e-01 | 0.0655 |
| 2033 | EP300 | P1T-E | Human | Esophagus | ESCC | 2.70e-08 | 4.00e-01 | 0.0875 |
| 2033 | EP300 | P2T-E | Human | Esophagus | ESCC | 4.19e-17 | 3.09e-01 | 0.1177 |
| 2033 | EP300 | P4T-E | Human | Esophagus | ESCC | 2.18e-14 | 2.29e-01 | 0.1323 |
| 2033 | EP300 | P5T-E | Human | Esophagus | ESCC | 3.25e-12 | 1.18e-01 | 0.1327 |
| 2033 | EP300 | P8T-E | Human | Esophagus | ESCC | 1.54e-23 | 4.38e-01 | 0.0889 |
| 2033 | EP300 | P9T-E | Human | Esophagus | ESCC | 1.27e-16 | 1.44e-01 | 0.1131 |
| 2033 | EP300 | P10T-E | Human | Esophagus | ESCC | 9.22e-32 | 5.51e-01 | 0.116 |
| 2033 | EP300 | P11T-E | Human | Esophagus | ESCC | 3.81e-05 | 2.75e-01 | 0.1426 |
| 2033 | EP300 | P12T-E | Human | Esophagus | ESCC | 2.68e-24 | 4.79e-01 | 0.1122 |
| 2033 | EP300 | P15T-E | Human | Esophagus | ESCC | 1.06e-21 | 5.85e-01 | 0.1149 |
| 2033 | EP300 | P16T-E | Human | Esophagus | ESCC | 2.89e-15 | 2.90e-01 | 0.1153 |
| 2033 | EP300 | P17T-E | Human | Esophagus | ESCC | 1.03e-05 | 2.18e-01 | 0.1278 |
| 2033 | EP300 | P19T-E | Human | Esophagus | ESCC | 4.53e-02 | 1.10e-01 | 0.1662 |
| 2033 | EP300 | P20T-E | Human | Esophagus | ESCC | 4.24e-09 | 2.07e-01 | 0.1124 |
| Page: 1 2 3 4 5 6 7 8 |
| Tissue | Expression Dynamics | Abbreviation |
| Esophagus | 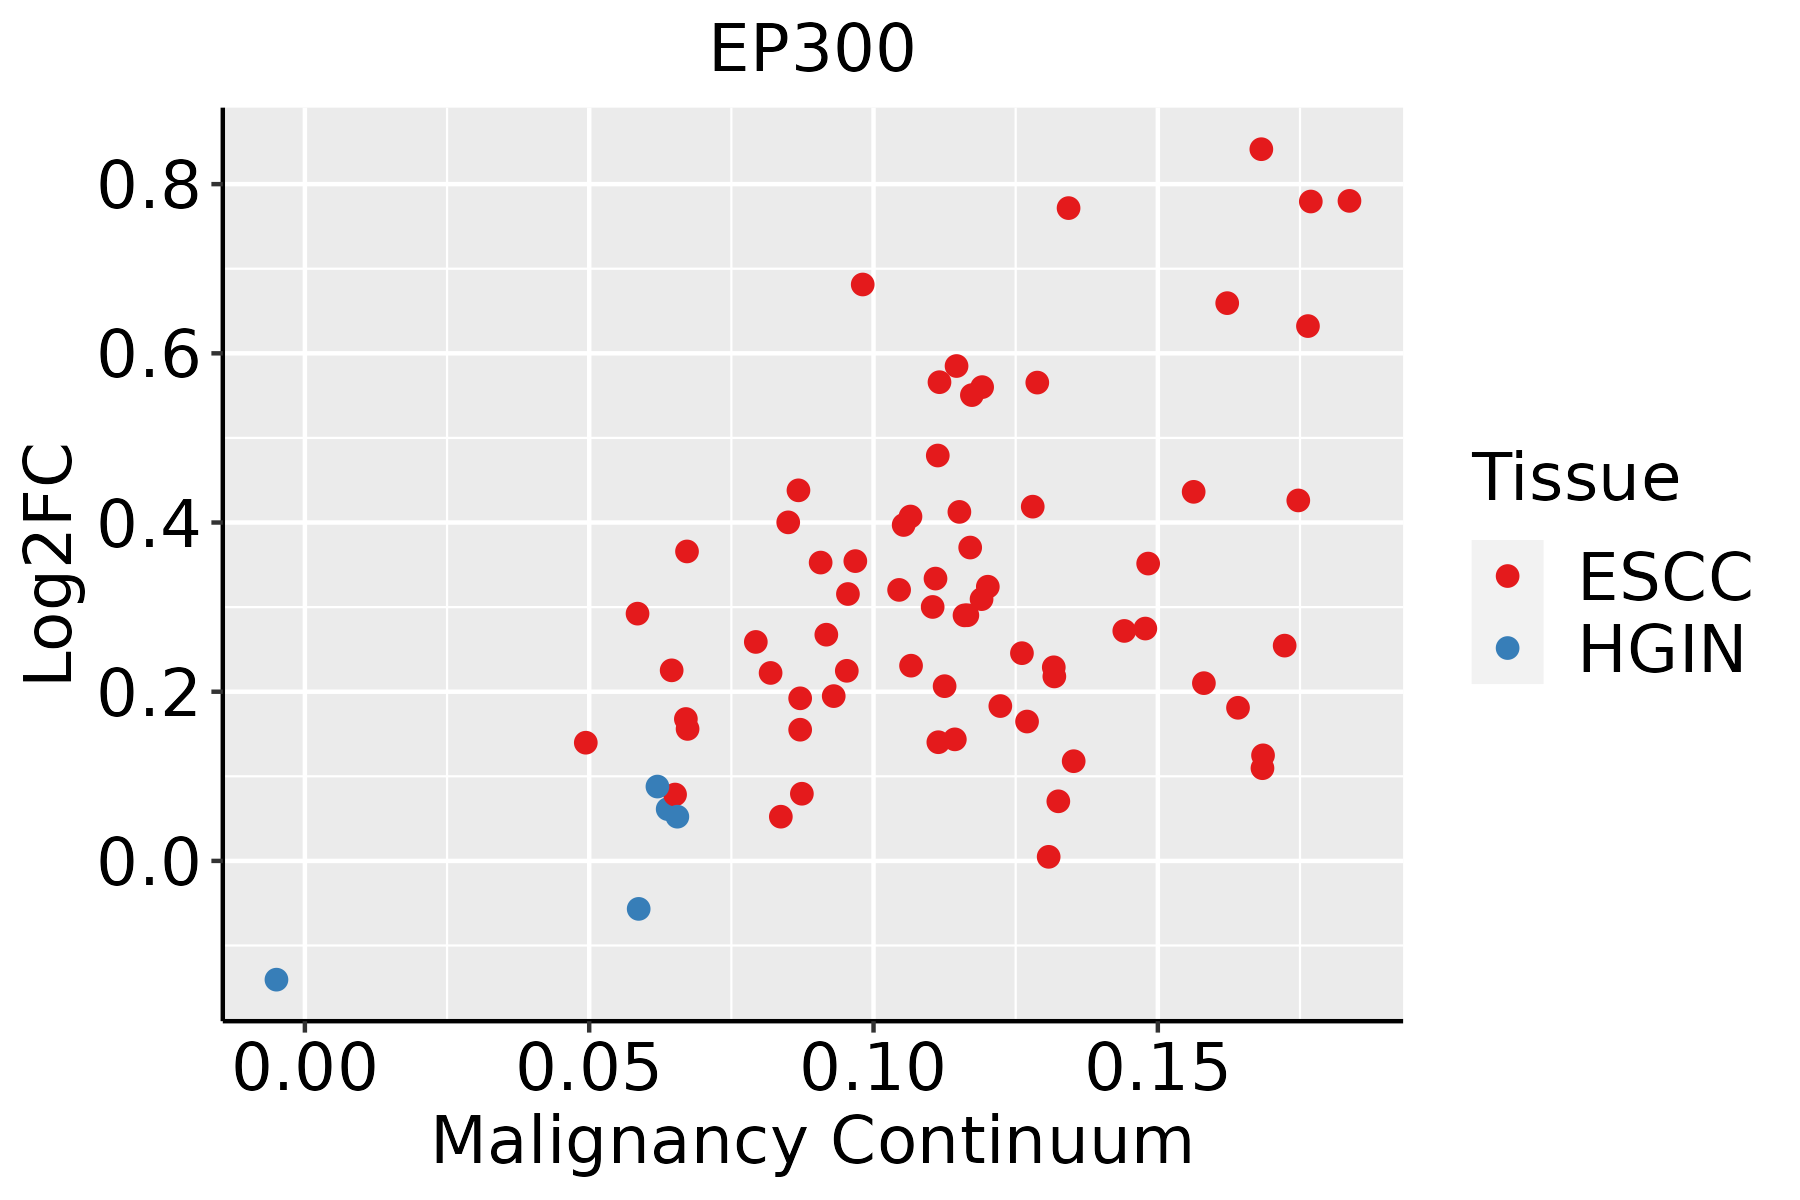 | ESCC: Esophageal squamous cell carcinoma |
| HGIN: High-grade intraepithelial neoplasias | ||
| LGIN: Low-grade intraepithelial neoplasias | ||
| Liver |  | HCC: Hepatocellular carcinoma |
| NAFLD: Non-alcoholic fatty liver disease | ||
| Oral Cavity | 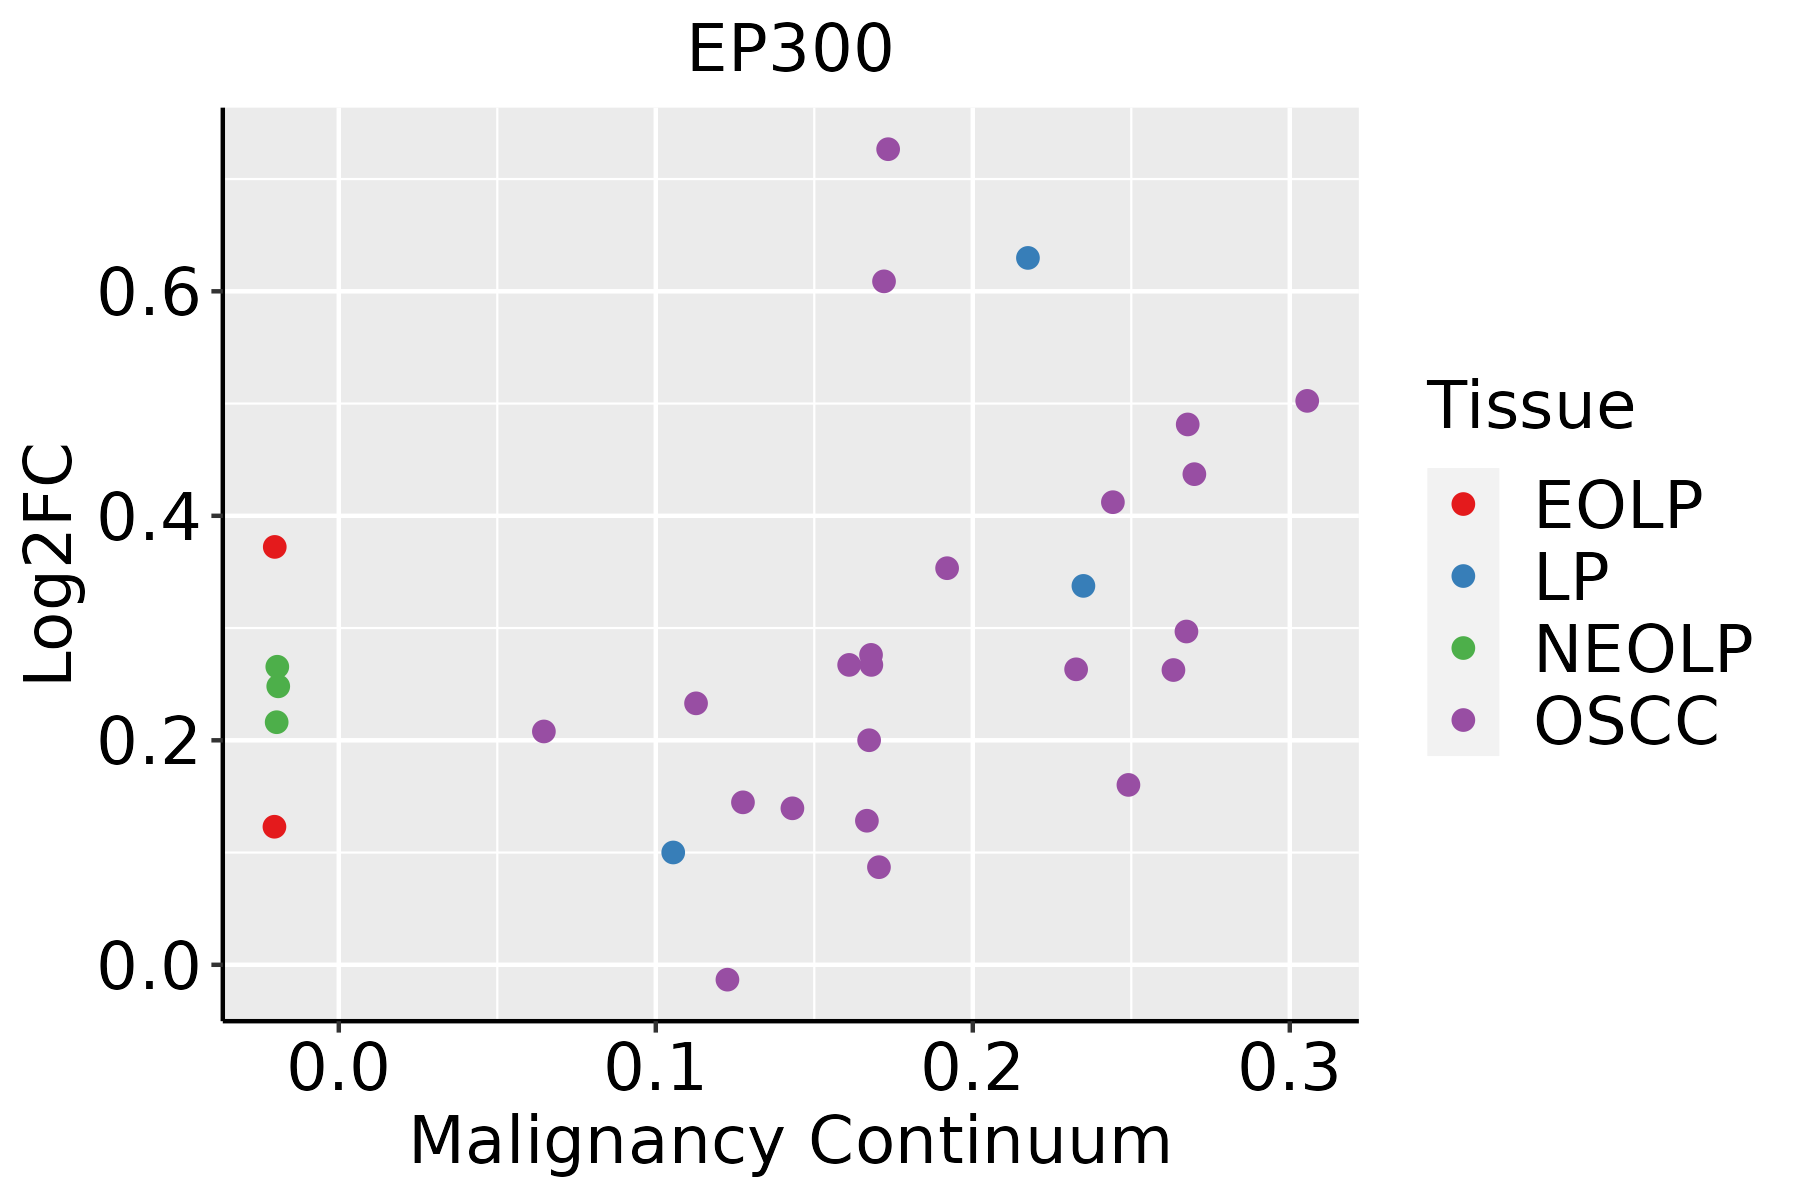 | EOLP: Erosive Oral lichen planus |
| LP: leukoplakia | ||
| NEOLP: Non-erosive oral lichen planus | ||
| OSCC: Oral squamous cell carcinoma | ||
| Prostate | 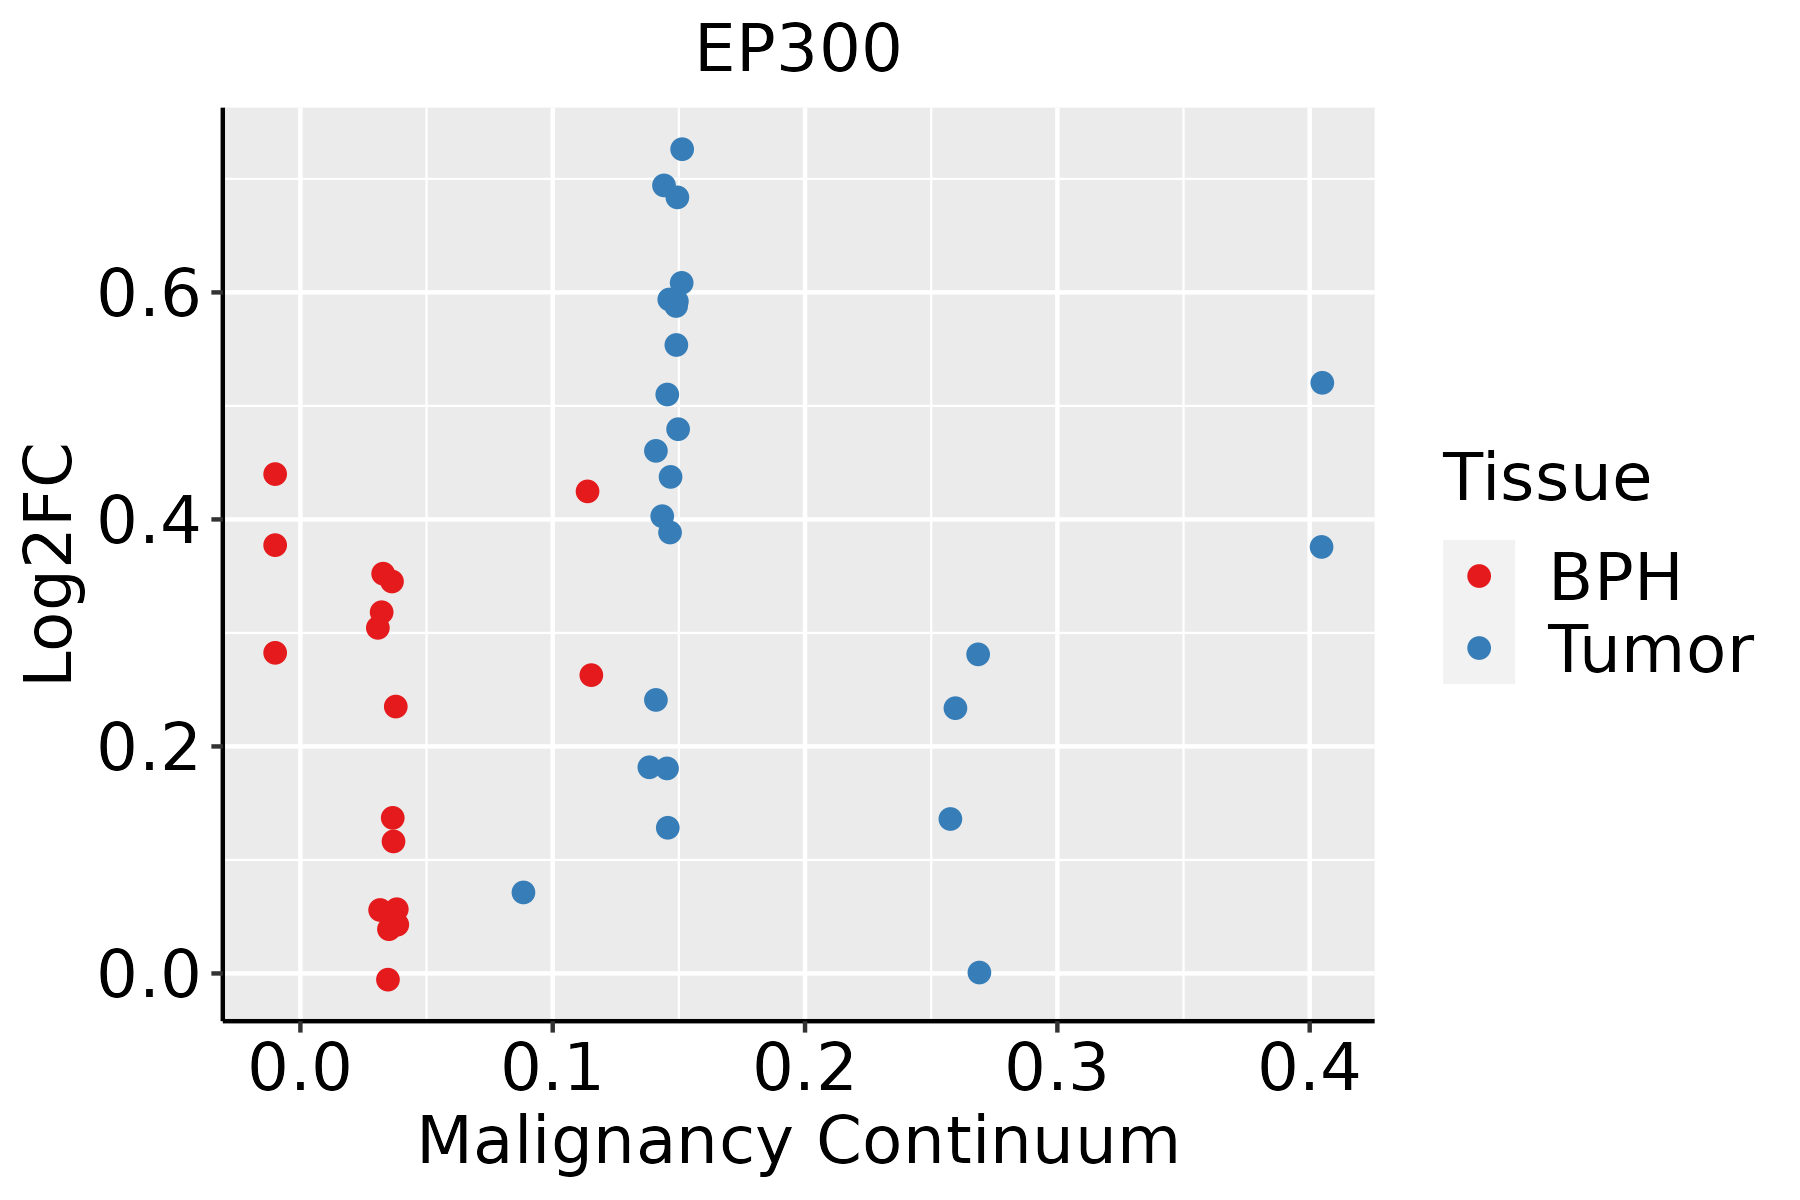 | BPH: Benign Prostatic Hyperplasia |
| Skin | 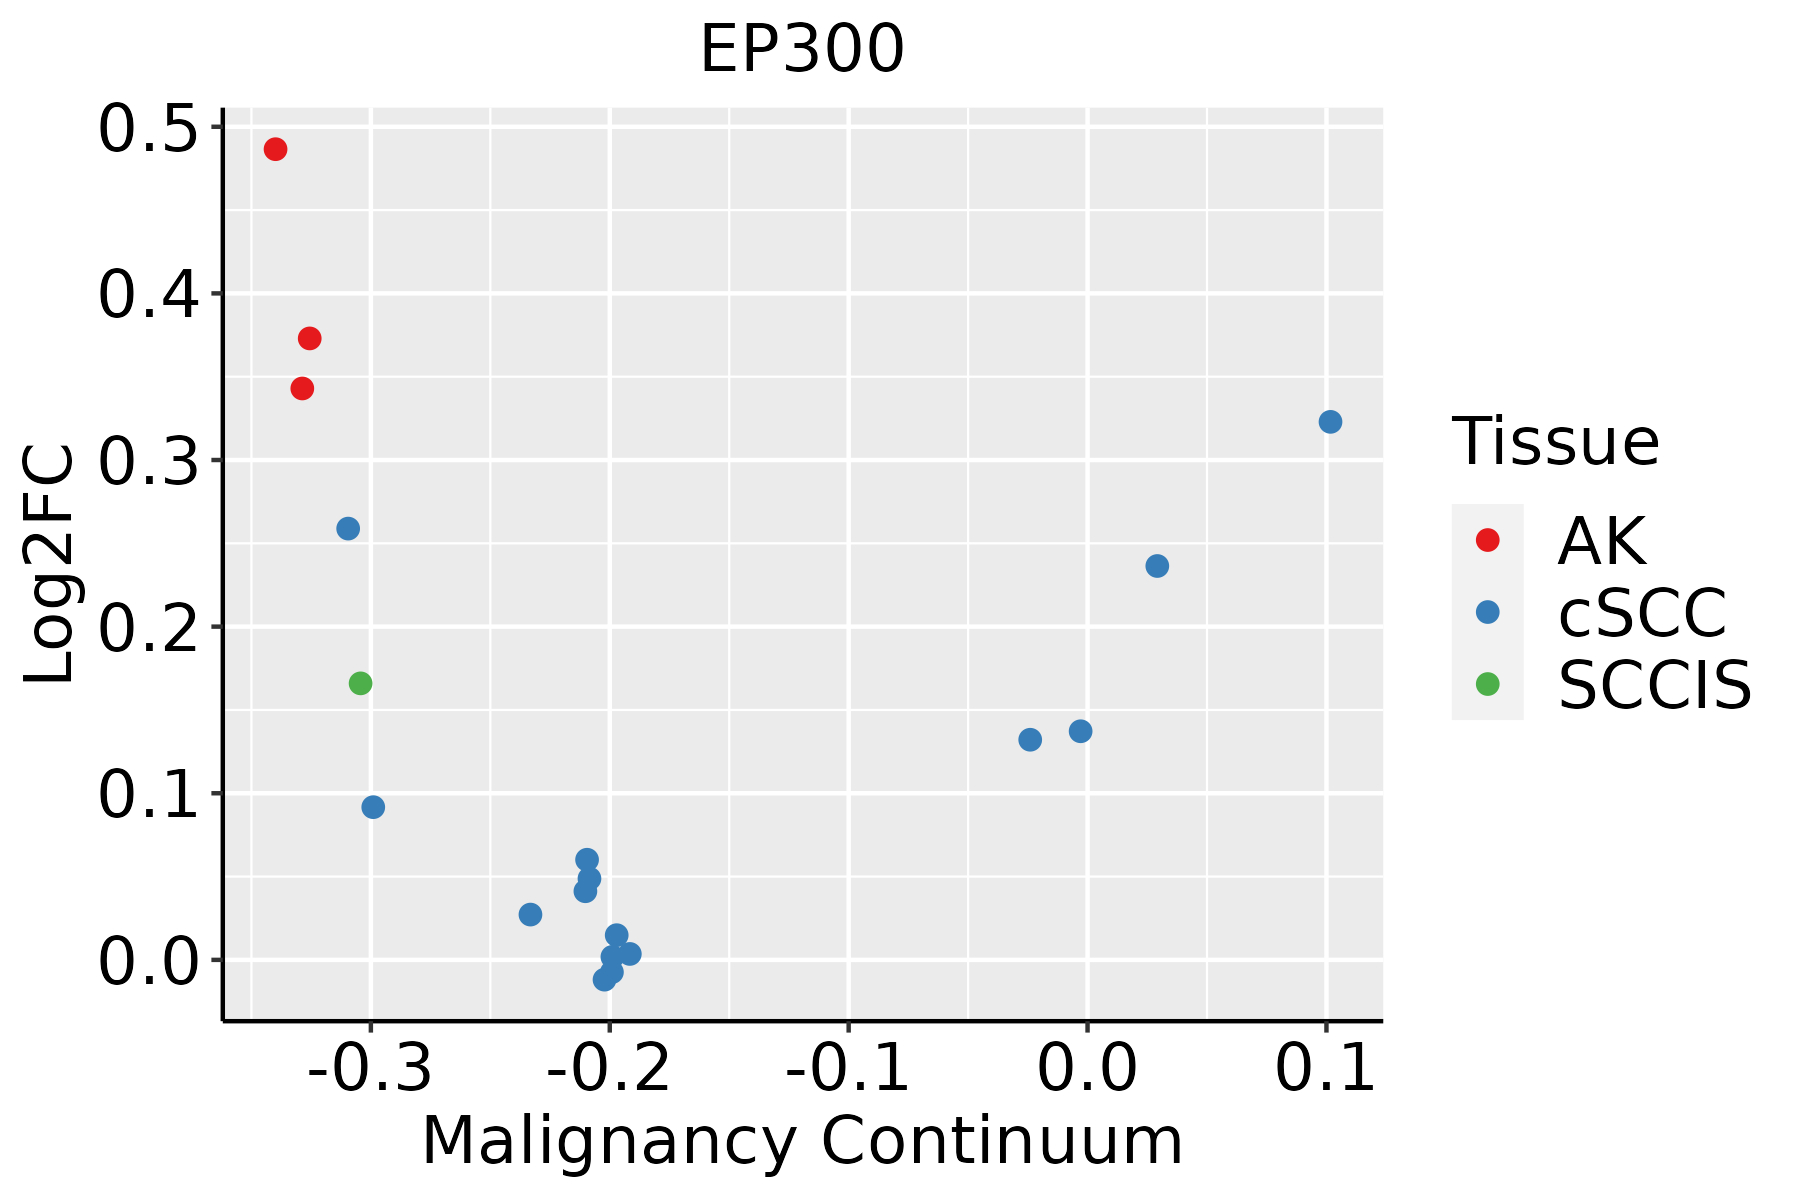 | AK: Actinic keratosis |
| cSCC: Cutaneous squamous cell carcinoma | ||
| SCCIS:squamous cell carcinoma in situ | ||
| Thyroid | 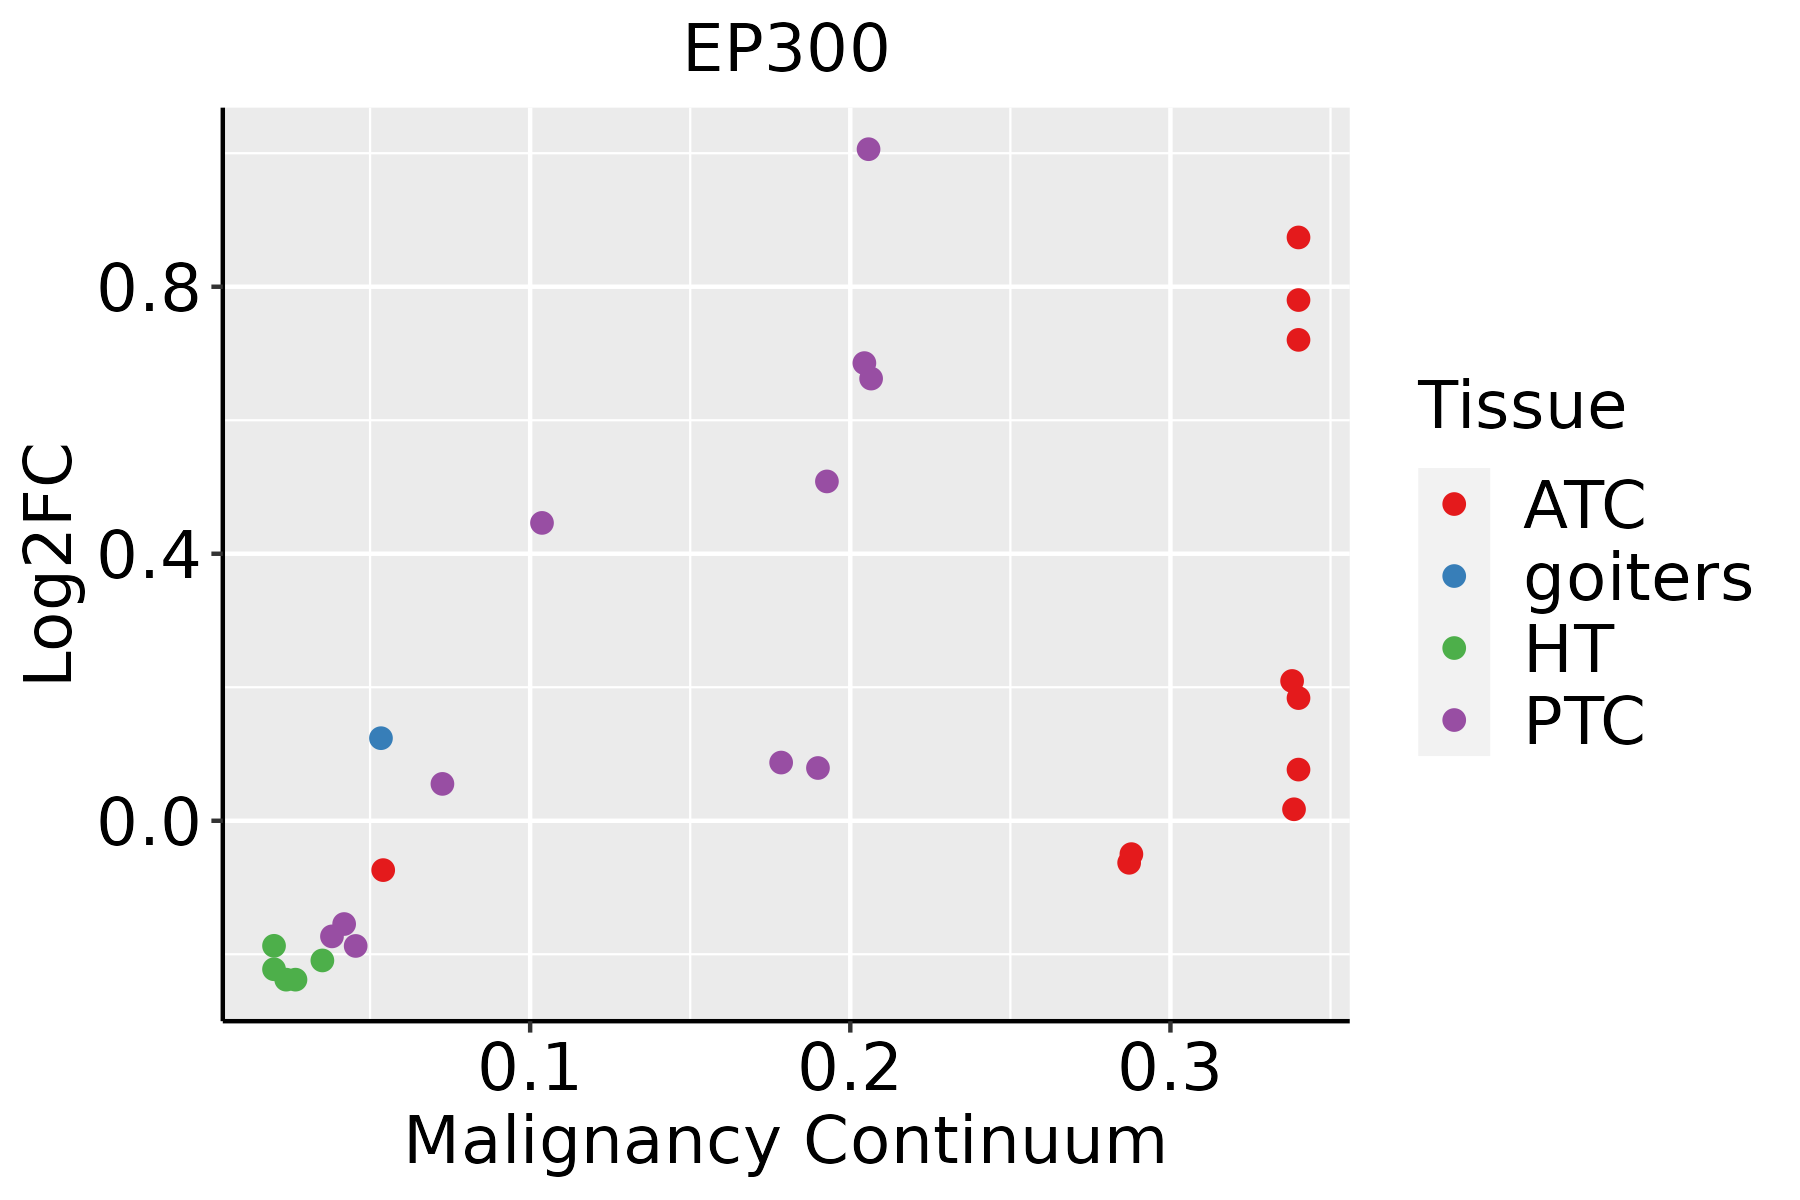 | ATC: Anaplastic thyroid cancer |
| HT: Hashimoto's thyroiditis | ||
| PTC: Papillary thyroid cancer |
| ∗log2FC in expression of this searched gene in stem-like cells from each diseased tissue sample relative to stem-like cells in normal samples in each tissue plotted against the malignancy continuum. Samples are colored based on if they are from different disease stage. |
Top |
Malignant transformation related pathway analysis |
| Find out the enriched GO biological processes and KEGG pathways involved in transition from healthy to precancer to cancer |
| Tissue | Disease Stage | Enriched GO biological Processes |
| Colorectum | AD |  |
| Colorectum | SER |  |
| Colorectum | MSS |  |
| Colorectum | MSI-H |  |
| Colorectum | FAP |  |
| ∗Top 15 enriched GO BP terms are showed in the bar plot of each disease state in each tissue. Each row represents a significant GO biological process which is colored according to the -log10(p.adjust). |
| Page: 1 2 3 4 5 6 7 8 9 |
| GO ID | Tissue | Disease Stage | Description | Gene Ratio | Bg Ratio | pvalue | p.adjust | Count |
| GO:003052121 | Liver | HCC | androgen receptor signaling pathway | 31/7958 | 44/18723 | 1.63e-04 | 1.30e-03 | 31 |
| GO:0009411 | Liver | HCC | response to UV | 85/7958 | 149/18723 | 2.34e-04 | 1.77e-03 | 85 |
| GO:00439231 | Liver | HCC | positive regulation by host of viral transcription | 14/7958 | 16/18723 | 2.73e-04 | 1.98e-03 | 14 |
| GO:004851121 | Liver | HCC | rhythmic process | 156/7958 | 298/18723 | 3.54e-04 | 2.46e-03 | 156 |
| GO:0098732 | Liver | HCC | macromolecule deacylation | 67/7958 | 116/18723 | 6.46e-04 | 3.99e-03 | 67 |
| GO:00305111 | Liver | HCC | positive regulation of transforming growth factor beta receptor signaling pathway | 23/7958 | 32/18723 | 7.37e-04 | 4.47e-03 | 23 |
| GO:19038461 | Liver | HCC | positive regulation of cellular response to transforming growth factor beta stimulus | 23/7958 | 32/18723 | 7.37e-04 | 4.47e-03 | 23 |
| GO:00510902 | Liver | HCC | regulation of DNA-binding transcription factor activity | 220/7958 | 440/18723 | 8.04e-04 | 4.82e-03 | 220 |
| GO:000863011 | Liver | HCC | intrinsic apoptotic signaling pathway in response to DNA damage | 58/7958 | 99/18723 | 8.97e-04 | 5.29e-03 | 58 |
| GO:0040029 | Liver | HCC | regulation of gene expression, epigenetic | 61/7958 | 105/18723 | 9.02e-04 | 5.31e-03 | 61 |
| GO:000717921 | Liver | HCC | transforming growth factor beta receptor signaling pathway | 106/7958 | 198/18723 | 1.09e-03 | 6.23e-03 | 106 |
| GO:00356011 | Liver | HCC | protein deacylation | 64/7958 | 112/18723 | 1.23e-03 | 6.83e-03 | 64 |
| GO:00106772 | Liver | HCC | negative regulation of cellular carbohydrate metabolic process | 28/7958 | 42/18723 | 1.35e-03 | 7.26e-03 | 28 |
| GO:00454441 | Liver | HCC | fat cell differentiation | 120/7958 | 229/18723 | 1.52e-03 | 8.05e-03 | 120 |
| GO:00061111 | Liver | HCC | regulation of gluconeogenesis | 31/7958 | 48/18723 | 1.66e-03 | 8.71e-03 | 31 |
| GO:00459122 | Liver | HCC | negative regulation of carbohydrate metabolic process | 31/7958 | 48/18723 | 1.66e-03 | 8.71e-03 | 31 |
| GO:001097511 | Liver | HCC | regulation of neuron projection development | 220/7958 | 445/18723 | 1.68e-03 | 8.78e-03 | 220 |
| GO:00432551 | Liver | HCC | regulation of carbohydrate biosynthetic process | 56/7958 | 97/18723 | 1.75e-03 | 9.11e-03 | 56 |
| GO:0010976 | Liver | HCC | positive regulation of neuron projection development | 88/7958 | 163/18723 | 1.98e-03 | 1.00e-02 | 88 |
| GO:004277111 | Liver | HCC | intrinsic apoptotic signaling pathway in response to DNA damage by p53 class mediator | 28/7958 | 43/18723 | 2.30e-03 | 1.14e-02 | 28 |
| Page: 1 2 3 4 5 6 7 8 9 10 11 12 13 14 15 16 17 18 19 20 21 22 23 24 25 26 27 28 29 30 31 32 33 34 35 36 37 38 39 40 41 42 43 44 45 46 47 48 49 50 51 52 53 54 55 56 57 58 59 60 61 62 63 64 65 66 67 68 69 70 71 72 73 74 75 76 77 78 79 80 81 82 83 84 85 86 87 88 89 90 91 92 |
| Pathway ID | Tissue | Disease Stage | Description | Gene Ratio | Bg Ratio | pvalue | p.adjust | qvalue | Count |
| hsa05016210 | Esophagus | ESCC | Huntington disease | 226/4205 | 306/8465 | 1.38e-18 | 8.72e-17 | 4.46e-17 | 226 |
| hsa0411023 | Esophagus | ESCC | Cell cycle | 126/4205 | 157/8465 | 1.34e-15 | 5.60e-14 | 2.87e-14 | 126 |
| hsa05166211 | Esophagus | ESCC | Human T-cell leukemia virus 1 infection | 164/4205 | 222/8465 | 8.13e-14 | 2.09e-12 | 1.07e-12 | 164 |
| hsa032509 | Esophagus | ESCC | Viral life cycle - HIV-1 | 54/4205 | 63/8465 | 2.01e-09 | 2.17e-08 | 1.11e-08 | 54 |
| hsa05167211 | Esophagus | ESCC | Kaposi sarcoma-associated herpesvirus infection | 136/4205 | 194/8465 | 4.28e-09 | 4.22e-08 | 2.16e-08 | 136 |
| hsa0516425 | Esophagus | ESCC | Influenza A | 122/4205 | 171/8465 | 5.01e-09 | 4.79e-08 | 2.45e-08 | 122 |
| hsa0516510 | Esophagus | ESCC | Human papillomavirus infection | 215/4205 | 331/8465 | 7.86e-09 | 7.12e-08 | 3.65e-08 | 215 |
| hsa0520325 | Esophagus | ESCC | Viral carcinogenesis | 137/4205 | 204/8465 | 2.47e-07 | 1.88e-06 | 9.62e-07 | 137 |
| hsa0521516 | Esophagus | ESCC | Prostate cancer | 72/4205 | 97/8465 | 6.12e-07 | 4.10e-06 | 2.10e-06 | 72 |
| hsa0452030 | Esophagus | ESCC | Adherens junction | 69/4205 | 93/8465 | 1.08e-06 | 6.83e-06 | 3.50e-06 | 69 |
| hsa051619 | Esophagus | ESCC | Hepatitis B | 108/4205 | 162/8465 | 7.68e-06 | 4.15e-05 | 2.12e-05 | 108 |
| hsa040689 | Esophagus | ESCC | FoxO signaling pathway | 89/4205 | 131/8465 | 1.56e-05 | 7.98e-05 | 4.09e-05 | 89 |
| hsa0521118 | Esophagus | ESCC | Renal cell carcinoma | 51/4205 | 69/8465 | 3.29e-05 | 1.53e-04 | 7.83e-05 | 51 |
| hsa0406629 | Esophagus | ESCC | HIF-1 signaling pathway | 75/4205 | 109/8465 | 3.66e-05 | 1.68e-04 | 8.60e-05 | 75 |
| hsa0491928 | Esophagus | ESCC | Thyroid hormone signaling pathway | 78/4205 | 121/8465 | 6.79e-04 | 2.23e-03 | 1.14e-03 | 78 |
| hsa051527 | Esophagus | ESCC | Tuberculosis | 111/4205 | 180/8465 | 7.14e-04 | 2.32e-03 | 1.19e-03 | 111 |
| hsa043507 | Esophagus | ESCC | TGF-beta signaling pathway | 69/4205 | 108/8465 | 1.92e-03 | 5.54e-03 | 2.84e-03 | 69 |
| hsa043306 | Esophagus | ESCC | Notch signaling pathway | 42/4205 | 62/8465 | 2.97e-03 | 7.97e-03 | 4.08e-03 | 42 |
| hsa0492214 | Esophagus | ESCC | Glucagon signaling pathway | 64/4205 | 107/8465 | 2.18e-02 | 4.80e-02 | 2.46e-02 | 64 |
| hsa0501638 | Esophagus | ESCC | Huntington disease | 226/4205 | 306/8465 | 1.38e-18 | 8.72e-17 | 4.46e-17 | 226 |
| Page: 1 2 3 4 5 6 7 8 9 10 11 12 13 14 15 |
Top |
Cell-cell communication analysis |
| Identification of potential cell-cell interactions between two cell types and their ligand-receptor pairs for different disease states |
| Ligand | Receptor | LRpair | Pathway | Tissue | Disease Stage |
| Page: 1 |
Top |
Single-cell gene regulatory network inference analysis |
| Find out the significant the regulons (TFs) and the target genes of each regulon across cell types for different disease states |
| TF | Cell Type | Tissue | Disease Stage | Target Gene | RSS | Regulon Activity |
| EP300 | BAS | Skin | SCCIS | AC104365.1,STX18-AS1,VASN, etc. | 1.89e-01 |  |
| EP300 | STM | Thyroid | ADJ | AL096865.1,MACF1,DDX17, etc. | 5.60e-01 |  |
| EP300 | STM | Thyroid | PTC | AL096865.1,MACF1,DDX17, etc. | 4.33e-01 |  |
| EP300 | CD4TN | Thyroid | ADJ | SECISBP2L,NKRF,SYNE2, etc. | 3.30e-01 | |
| EP300 | CD4TN | Thyroid | ATC | SECISBP2L,NKRF,SYNE2, etc. | 1.17e-01 |  |
| ∗The dot plots of a searched regulon are shown for all cell subpopulations in each disease state of each tissue based on the regulon specific score inferred using pySCENIC and by calculating the average expression. |
| Page: 1 |
Top |
Somatic mutation of malignant transformation related genes |
| Annotation of somatic variants for genes involved in malignant transformation |
| Hugo Symbol | Variant Class | Variant Classification | dbSNP RS | HGVSc | HGVSp | HGVSp Short | SWISSPROT | BIOTYPE | SIFT | PolyPhen | Tumor Sample Barcode | Tissue | Histology | Sex | Age | Stage | Therapy Types | Drugs | Outcome |
| EP300 | SNV | Missense_Mutation | c.5528A>C | p.Gln1843Pro | p.Q1843P | Q09472 | protein_coding | tolerated(1) | benign(0.003) | TCGA-A2-A0T5-01 | Breast | breast invasive carcinoma | Female | <65 | I/II | Unspecific | Taxotere | SD | |
| EP300 | SNV | Missense_Mutation | c.6023N>T | p.Ser2008Phe | p.S2008F | Q09472 | protein_coding | tolerated(0.06) | benign(0.203) | TCGA-BH-A0DZ-01 | Breast | breast invasive carcinoma | Female | <65 | I/II | Chemotherapy | docetaxel | SD | |
| EP300 | SNV | Missense_Mutation | rs769721803 | c.1349N>T | p.Ala450Val | p.A450V | Q09472 | protein_coding | tolerated(0.07) | possibly_damaging(0.771) | TCGA-BH-A0HF-01 | Breast | breast invasive carcinoma | Female | >=65 | I/II | Hormone Therapy | arimidex | SD |
| EP300 | SNV | Missense_Mutation | rs775556373 | c.5854N>G | p.Ile1952Val | p.I1952V | Q09472 | protein_coding | tolerated(0.33) | benign(0) | TCGA-BH-A18G-01 | Breast | breast invasive carcinoma | Female | >=65 | I/II | Unknown | Unknown | SD |
| EP300 | SNV | Missense_Mutation | c.4352N>C | p.His1451Pro | p.H1451P | Q09472 | protein_coding | deleterious(0) | probably_damaging(0.999) | TCGA-C8-A27B-01 | Breast | breast invasive carcinoma | Female | <65 | I/II | Chemotherapy | 5-fluorouracil | CR | |
| EP300 | SNV | Missense_Mutation | c.4608A>T | p.Glu1536Asp | p.E1536D | Q09472 | protein_coding | tolerated(0.07) | probably_damaging(0.994) | TCGA-D8-A1XK-01 | Breast | breast invasive carcinoma | Female | <65 | I/II | Chemotherapy | doxorubicine+cyclophosphamide | SD | |
| EP300 | SNV | Missense_Mutation | c.2498N>T | p.Ser833Leu | p.S833L | Q09472 | protein_coding | deleterious_low_confidence(0.02) | probably_damaging(0.992) | TCGA-D8-A1XM-01 | Breast | breast invasive carcinoma | Female | <65 | I/II | Unknown | Unknown | SD | |
| EP300 | SNV | Missense_Mutation | c.980C>T | p.Ala327Val | p.A327V | Q09472 | protein_coding | tolerated(0.08) | possibly_damaging(0.833) | TCGA-D8-A1XZ-01 | Breast | breast invasive carcinoma | Female | >=65 | III/IV | Hormone Therapy | tamoxiphen+anastrozolum | SD | |
| EP300 | SNV | Missense_Mutation | novel | c.2744G>T | p.Arg915Leu | p.R915L | Q09472 | protein_coding | tolerated_low_confidence(0.64) | benign(0) | TCGA-E2-A1LK-01 | Breast | breast invasive carcinoma | Female | >=65 | III/IV | Unknown | Unknown | PD |
| EP300 | SNV | Missense_Mutation | novel | c.1440N>A | p.Met480Ile | p.M480I | Q09472 | protein_coding | tolerated(0.54) | benign(0.076) | TCGA-EW-A423-01 | Breast | breast invasive carcinoma | Female | >=65 | I/II | Hormone Therapy | anastrozole | SD |
| Page: 1 2 3 4 5 6 7 8 9 10 11 12 13 14 15 16 17 18 19 20 21 22 23 24 25 |
Top |
Related drugs of malignant transformation related genes |
| Identification of chemicals and drugs interact with genes involved in malignant transfromation |
| (DGIdb 4.0) |
| Entrez ID | Symbol | Category | Interaction Types | Drug Claim Name | Drug Name | PMIDs |
| 2033 | EP300 | CLINICALLY ACTIONABLE, ENZYME, TRANSCRIPTION FACTOR COMPLEX, DRUGGABLE GENOME | inhibitor | 178103579 | CURCUMIN | |
| 2033 | EP300 | CLINICALLY ACTIONABLE, ENZYME, TRANSCRIPTION FACTOR COMPLEX, DRUGGABLE GENOME | inhibitor | 178103614 | ||
| 2033 | EP300 | CLINICALLY ACTIONABLE, ENZYME, TRANSCRIPTION FACTOR COMPLEX, DRUGGABLE GENOME | DIETHYL-2-UNDECYLIDENEMALONATE | CHEMBL1797707 | 21292492 | |
| 2033 | EP300 | CLINICALLY ACTIONABLE, ENZYME, TRANSCRIPTION FACTOR COMPLEX, DRUGGABLE GENOME | inhibitor | 187051830 | ||
| 2033 | EP300 | CLINICALLY ACTIONABLE, ENZYME, TRANSCRIPTION FACTOR COMPLEX, DRUGGABLE GENOME | inhibitor | 249565916 | ||
| 2033 | EP300 | CLINICALLY ACTIONABLE, ENZYME, TRANSCRIPTION FACTOR COMPLEX, DRUGGABLE GENOME | DIETHYL-2-PENTADECYLIDENEMALONATE | CHEMBL404916 | 21292492 | |
| 2033 | EP300 | CLINICALLY ACTIONABLE, ENZYME, TRANSCRIPTION FACTOR COMPLEX, DRUGGABLE GENOME | inhibitor | 178103615 | ||
| 2033 | EP300 | CLINICALLY ACTIONABLE, ENZYME, TRANSCRIPTION FACTOR COMPLEX, DRUGGABLE GENOME | DIETHYL-2-TETRADECYLIDENEMALONATE | CHEMBL257748 | 21292492 | |
| 2033 | EP300 | CLINICALLY ACTIONABLE, ENZYME, TRANSCRIPTION FACTOR COMPLEX, DRUGGABLE GENOME | inhibitor | 178103578 | ||
| 2033 | EP300 | CLINICALLY ACTIONABLE, ENZYME, TRANSCRIPTION FACTOR COMPLEX, DRUGGABLE GENOME | DIETHYL-2-DODECYLIDENEMALONATE | CHEMBL1797708 | 21292492 |
| Page: 1 2 |

Copyright 2023-Present -The University of Texas Health Science Center at Houston |