
|
|||||
|
 | |
| |
| |
| |
| |
| |
|
Gene: EEF2 |
Gene summary for EEF2 |
| Gene information | Species | Human | Gene symbol | EEF2 | Gene ID | 1938 |
| Gene name | eukaryotic translation elongation factor 2 | |
| Gene Alias | EEF-2 | |
| Cytomap | 19p13.3 | |
| Gene Type | protein-coding | GO ID | GO:0000302 | UniProtAcc | P13639 |
Top |
Malignant transformation analysis |
| Identification of the aberrant gene expression in precancerous and cancerous lesions by comparing the gene expression of stem-like cells in diseased tissues with normal stem cells |
| Entrez ID | Symbol | Replicates | Species | Organ | Tissue | Adj P-value | Log2FC | Malignancy |
| 1938 | EEF2 | GSM4909280 | Human | Breast | Precancer | 4.39e-04 | -5.49e-01 | 0.0305 |
| 1938 | EEF2 | GSM4909281 | Human | Breast | IDC | 1.79e-33 | -4.63e-01 | 0.21 |
| 1938 | EEF2 | GSM4909282 | Human | Breast | IDC | 3.42e-54 | -7.43e-01 | -0.0288 |
| 1938 | EEF2 | GSM4909285 | Human | Breast | IDC | 1.90e-10 | -1.72e-01 | 0.21 |
| 1938 | EEF2 | GSM4909287 | Human | Breast | IDC | 7.26e-21 | -4.91e-01 | 0.2057 |
| 1938 | EEF2 | GSM4909290 | Human | Breast | IDC | 1.01e-43 | -7.56e-01 | 0.2096 |
| 1938 | EEF2 | GSM4909293 | Human | Breast | IDC | 1.07e-38 | -4.81e-01 | 0.1581 |
| 1938 | EEF2 | GSM4909294 | Human | Breast | IDC | 4.87e-14 | -5.37e-01 | 0.2022 |
| 1938 | EEF2 | GSM4909295 | Human | Breast | IDC | 2.69e-02 | -2.76e-01 | 0.0898 |
| 1938 | EEF2 | GSM4909296 | Human | Breast | IDC | 1.13e-07 | -2.86e-01 | 0.1524 |
| 1938 | EEF2 | GSM4909297 | Human | Breast | IDC | 6.97e-22 | -2.20e-01 | 0.1517 |
| 1938 | EEF2 | GSM4909298 | Human | Breast | IDC | 1.19e-11 | -1.39e-01 | 0.1551 |
| 1938 | EEF2 | GSM4909300 | Human | Breast | IDC | 3.83e-08 | -3.62e-01 | 0.0334 |
| 1938 | EEF2 | GSM4909301 | Human | Breast | IDC | 9.60e-22 | -5.20e-01 | 0.1577 |
| 1938 | EEF2 | GSM4909302 | Human | Breast | IDC | 3.28e-03 | -2.18e-01 | 0.1545 |
| 1938 | EEF2 | GSM4909306 | Human | Breast | IDC | 3.45e-28 | -4.28e-01 | 0.1564 |
| 1938 | EEF2 | GSM4909307 | Human | Breast | IDC | 2.40e-17 | -4.28e-01 | 0.1569 |
| 1938 | EEF2 | GSM4909308 | Human | Breast | IDC | 3.31e-22 | -2.39e-01 | 0.158 |
| 1938 | EEF2 | GSM4909309 | Human | Breast | IDC | 4.47e-44 | -8.30e-01 | 0.0483 |
| 1938 | EEF2 | GSM4909311 | Human | Breast | IDC | 1.25e-36 | -4.04e-01 | 0.1534 |
| Page: 1 2 3 4 5 6 7 8 9 10 11 12 13 14 15 16 17 18 |
| Tissue | Expression Dynamics | Abbreviation |
| Breast | 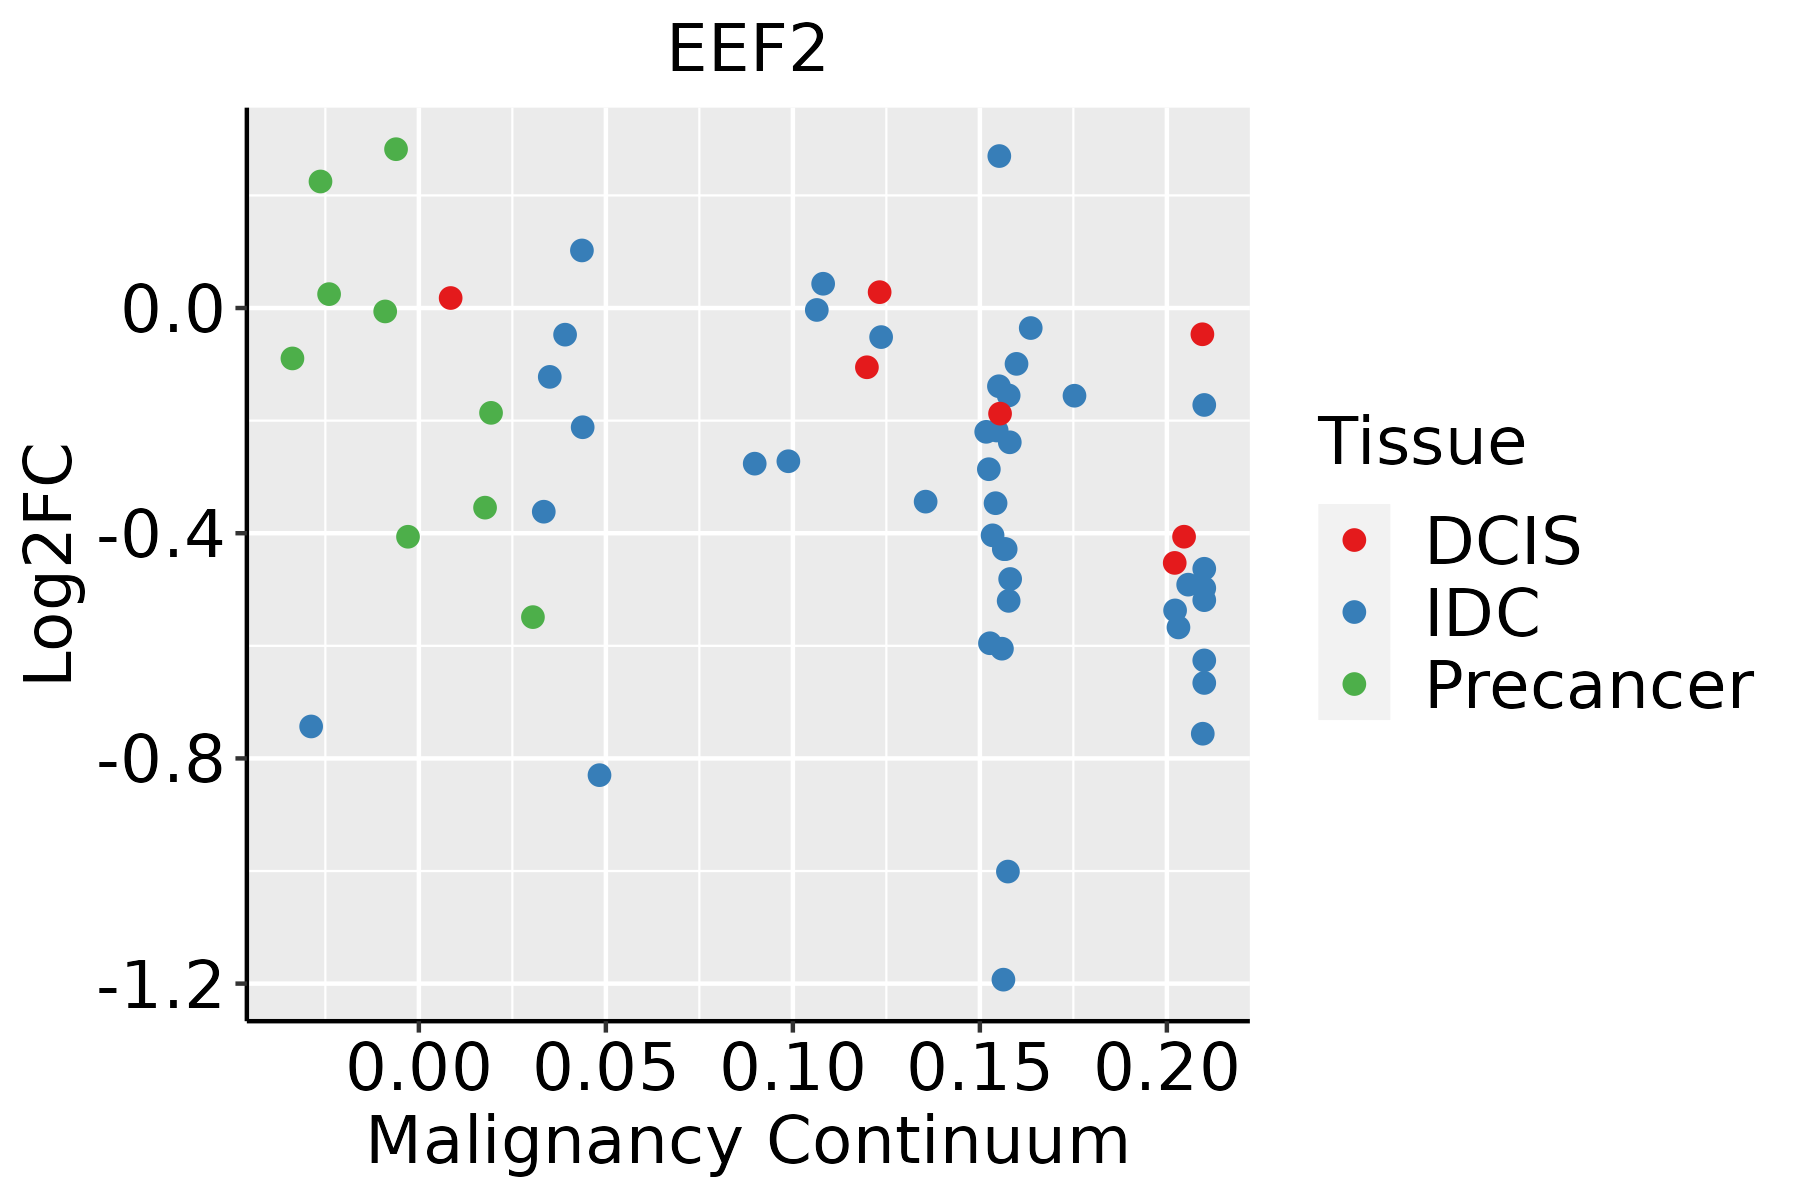 | IDC: Invasive ductal carcinoma |
| DCIS: Ductal carcinoma in situ | ||
| Precancer(BRCA1-mut): Precancerous lesion from BRCA1 mutation carriers | ||
| Cervix |  | CC: Cervix cancer |
| HSIL_HPV: HPV-infected high-grade squamous intraepithelial lesions | ||
| N_HPV: HPV-infected normal cervix | ||
| Colorectum (GSE201348) |  | FAP: Familial adenomatous polyposis |
| CRC: Colorectal cancer | ||
| Colorectum (HTA11) |  | AD: Adenomas |
| SER: Sessile serrated lesions | ||
| MSI-H: Microsatellite-high colorectal cancer | ||
| MSS: Microsatellite stable colorectal cancer | ||
| Endometrium | 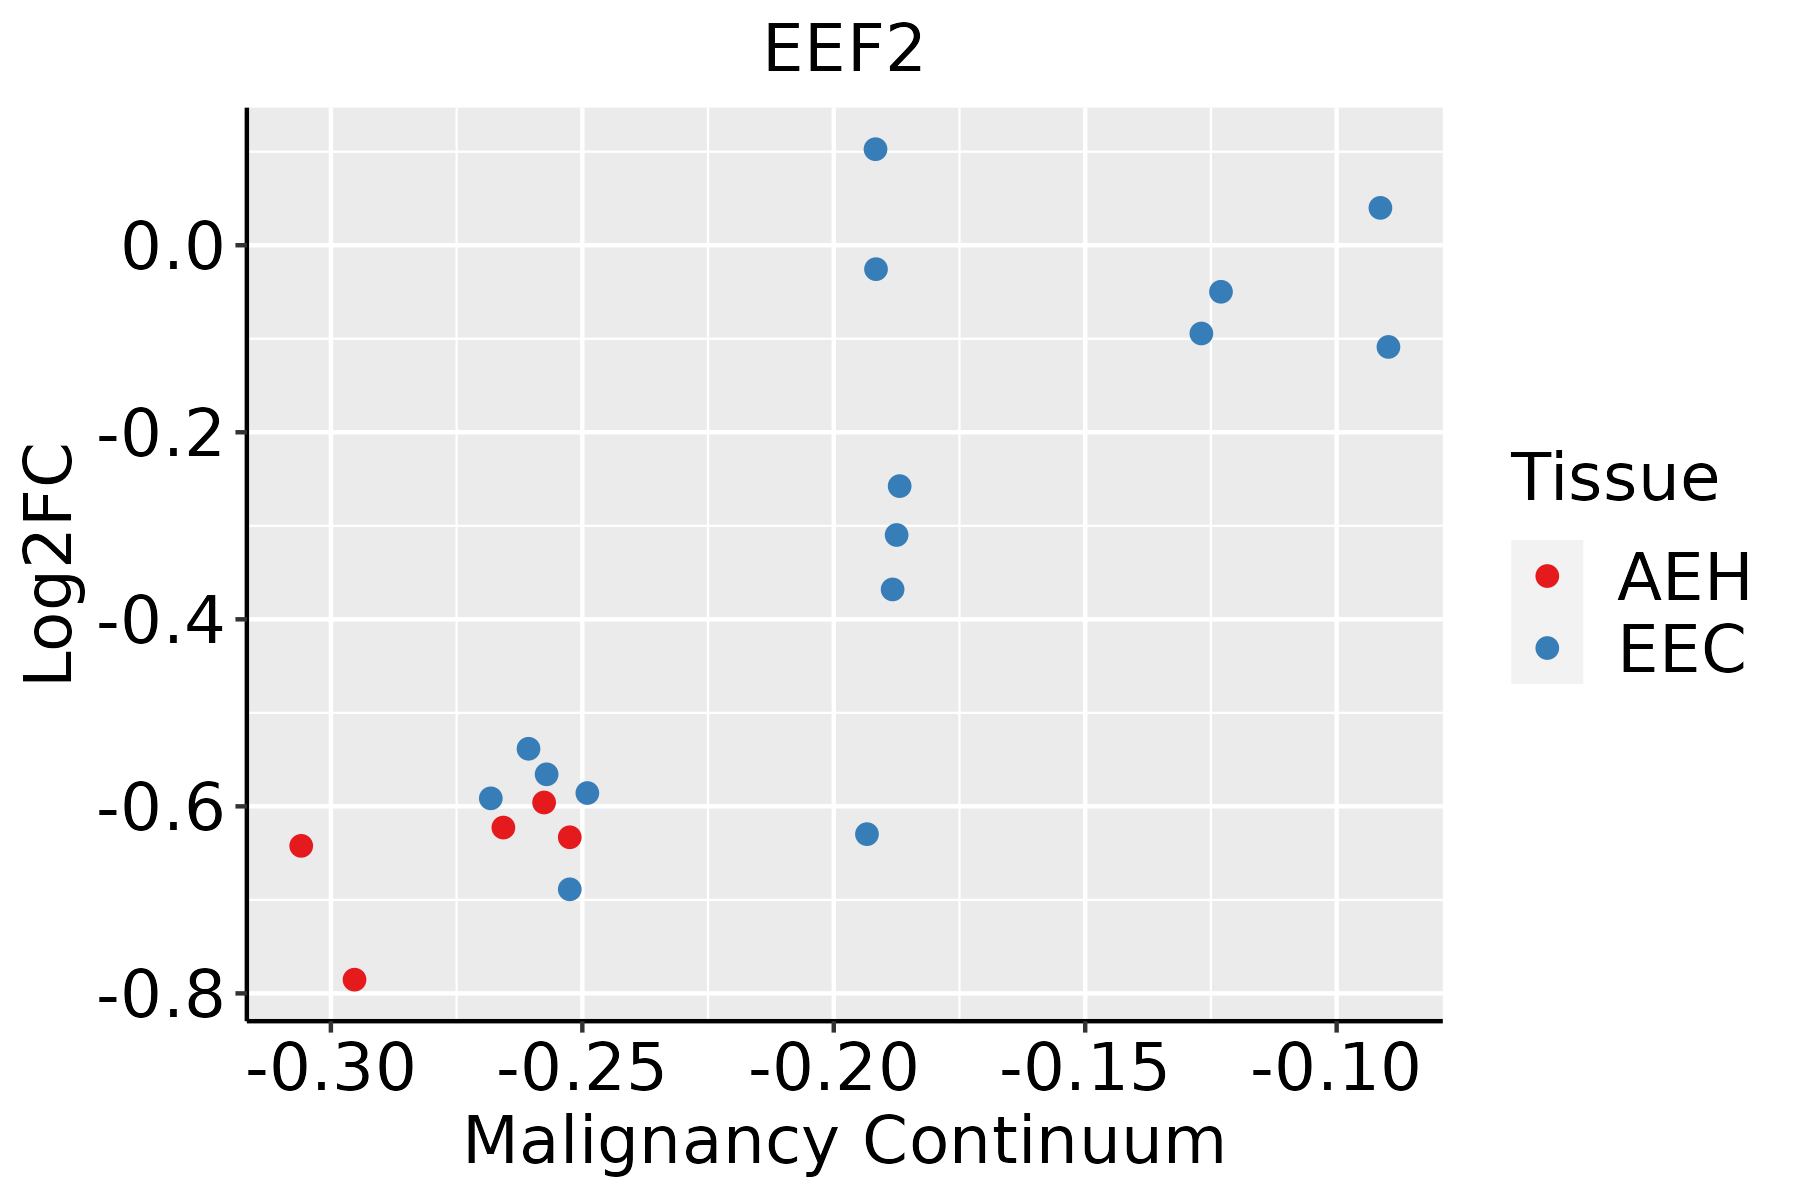 | AEH: Atypical endometrial hyperplasia |
| EEC: Endometrioid Cancer | ||
| Esophagus |  | ESCC: Esophageal squamous cell carcinoma |
| HGIN: High-grade intraepithelial neoplasias | ||
| LGIN: Low-grade intraepithelial neoplasias | ||
| Liver |  | HCC: Hepatocellular carcinoma |
| NAFLD: Non-alcoholic fatty liver disease | ||
| Lung |  | AAH: Atypical adenomatous hyperplasia |
| AIS: Adenocarcinoma in situ | ||
| IAC: Invasive lung adenocarcinoma | ||
| MIA: Minimally invasive adenocarcinoma | ||
| Oral Cavity | 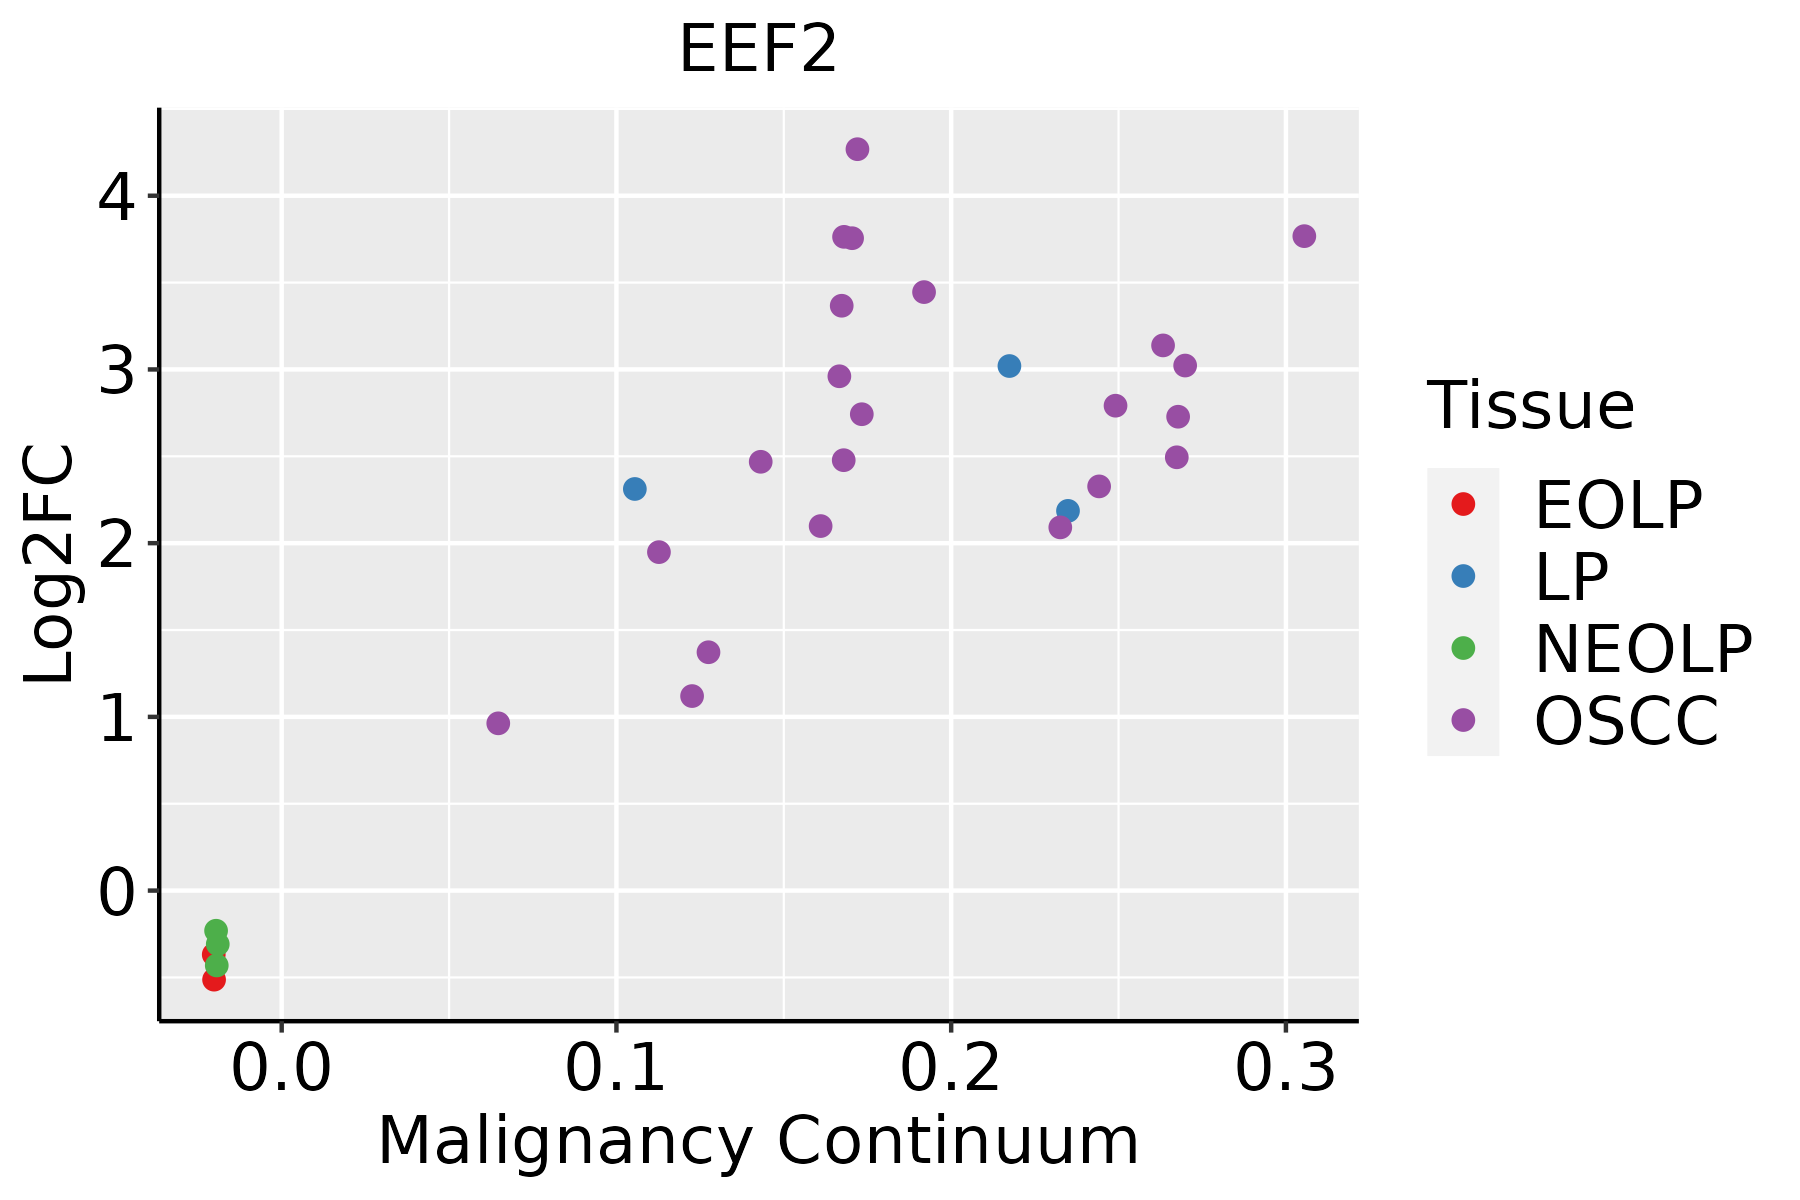 | EOLP: Erosive Oral lichen planus |
| LP: leukoplakia | ||
| NEOLP: Non-erosive oral lichen planus | ||
| OSCC: Oral squamous cell carcinoma | ||
| Prostate |  | BPH: Benign Prostatic Hyperplasia |
| Skin |  | AK: Actinic keratosis |
| cSCC: Cutaneous squamous cell carcinoma | ||
| SCCIS:squamous cell carcinoma in situ | ||
| Thyroid | 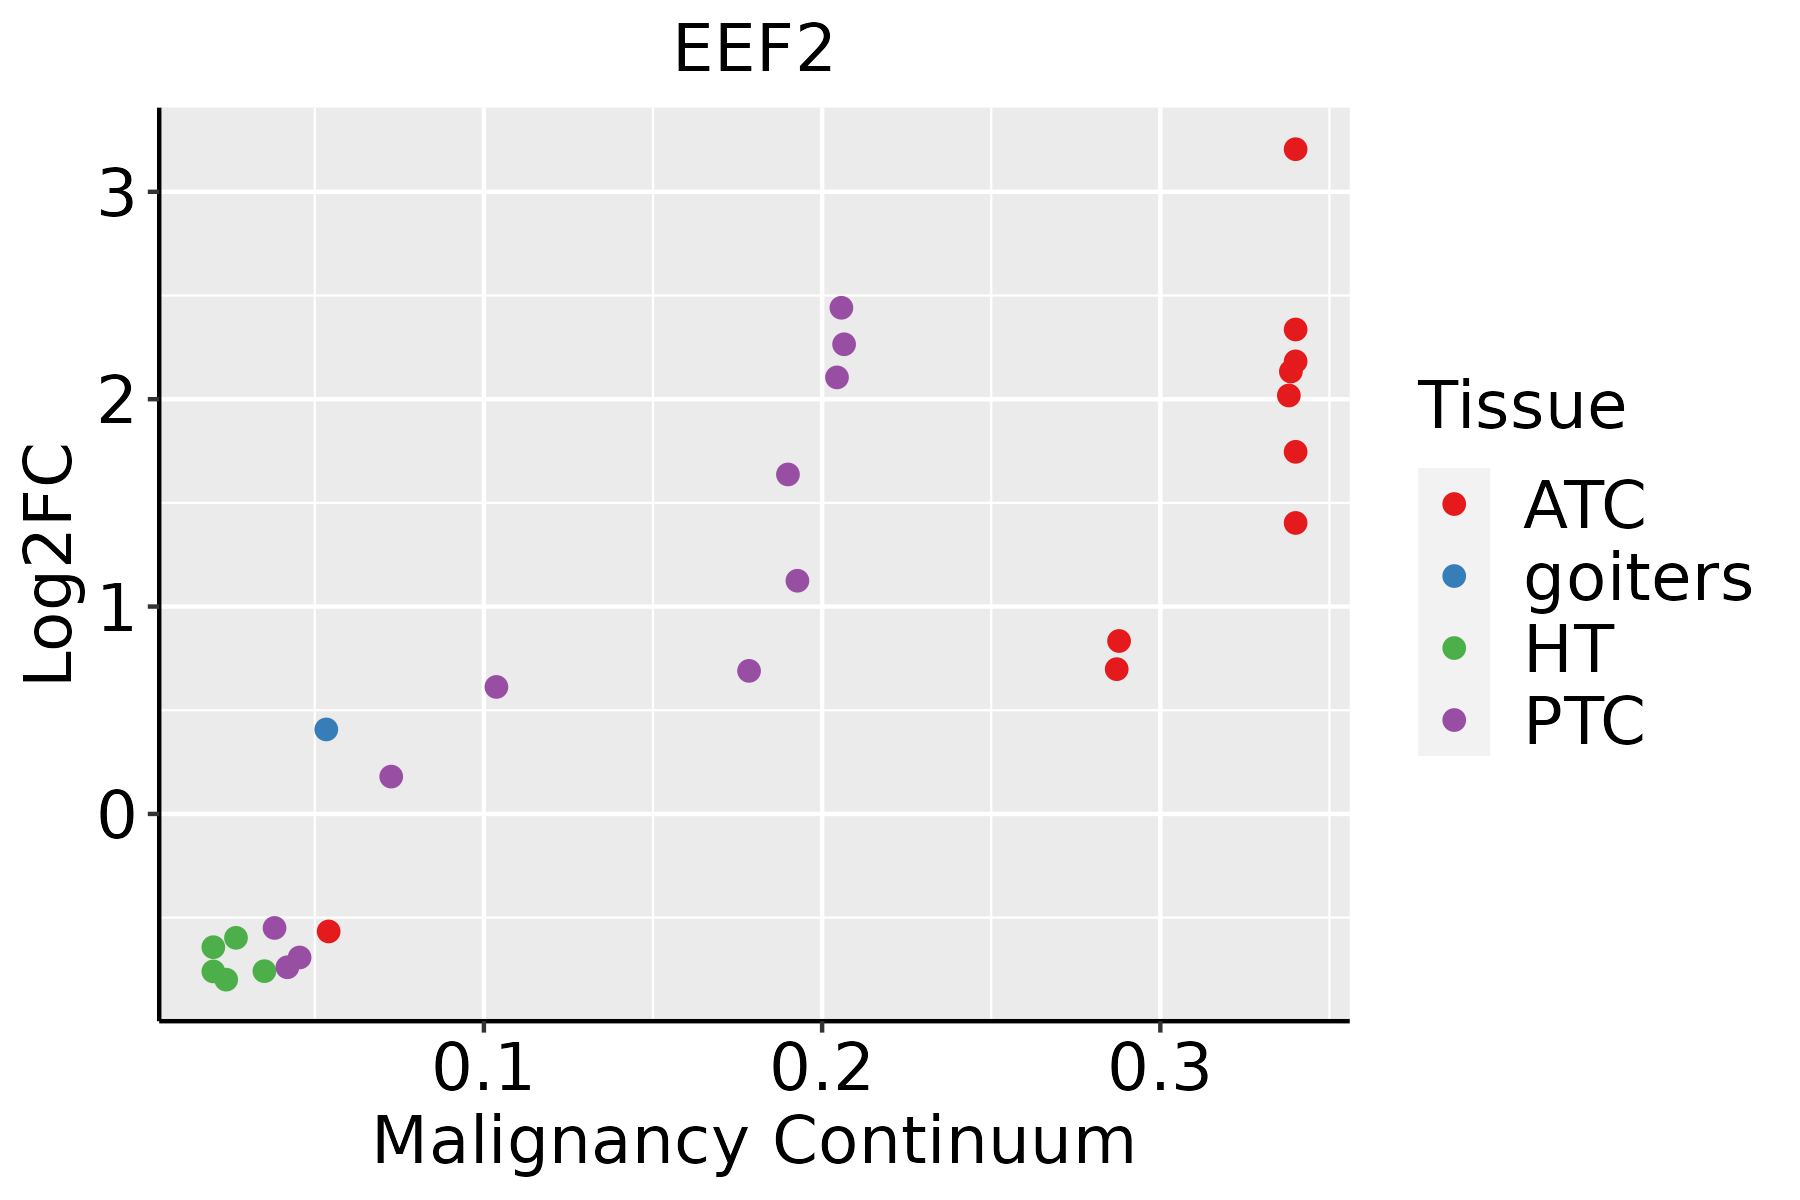 | ATC: Anaplastic thyroid cancer |
| HT: Hashimoto's thyroiditis | ||
| PTC: Papillary thyroid cancer |
| ∗log2FC in expression of this searched gene in stem-like cells from each diseased tissue sample relative to stem-like cells in normal samples in each tissue plotted against the malignancy continuum. Samples are colored based on if they are from different disease stage. |
Top |
Malignant transformation related pathway analysis |
| Find out the enriched GO biological processes and KEGG pathways involved in transition from healthy to precancer to cancer |
| Tissue | Disease Stage | Enriched GO biological Processes |
| Colorectum | AD |  |
| Colorectum | SER |  |
| Colorectum | MSS |  |
| Colorectum | MSI-H |  |
| Colorectum | FAP |  |
| ∗Top 15 enriched GO BP terms are showed in the bar plot of each disease state in each tissue. Each row represents a significant GO biological process which is colored according to the -log10(p.adjust). |
| Page: 1 2 3 4 5 6 7 8 9 |
| GO ID | Tissue | Disease Stage | Description | Gene Ratio | Bg Ratio | pvalue | p.adjust | Count |
| GO:0060999 | Liver | HCC | positive regulation of dendritic spine development | 27/7958 | 42/18723 | 3.60e-03 | 1.60e-02 | 27 |
| GO:00507693 | Liver | HCC | positive regulation of neurogenesis | 116/7958 | 225/18723 | 3.67e-03 | 1.63e-02 | 116 |
| GO:0033273 | Liver | HCC | response to vitamin | 52/7958 | 93/18723 | 6.18e-03 | 2.53e-02 | 52 |
| GO:007124812 | Liver | HCC | cellular response to metal ion | 101/7958 | 197/18723 | 7.82e-03 | 3.10e-02 | 101 |
| GO:006099611 | Liver | HCC | dendritic spine development | 54/7958 | 99/18723 | 1.03e-02 | 3.86e-02 | 54 |
| GO:00420631 | Liver | HCC | gliogenesis | 148/7958 | 301/18723 | 1.10e-02 | 4.07e-02 | 148 |
| GO:00454712 | Liver | HCC | response to ethanol | 72/7958 | 137/18723 | 1.10e-02 | 4.07e-02 | 72 |
| GO:0050775 | Liver | HCC | positive regulation of dendrite morphogenesis | 23/7958 | 37/18723 | 1.25e-02 | 4.53e-02 | 23 |
| GO:001635811 | Liver | HCC | dendrite development | 121/7958 | 243/18723 | 1.26e-02 | 4.56e-02 | 121 |
| GO:00609981 | Liver | HCC | regulation of dendritic spine development | 35/7958 | 61/18723 | 1.35e-02 | 4.82e-02 | 35 |
| GO:00713205 | Liver | HCC | cellular response to cAMP | 31/7958 | 53/18723 | 1.37e-02 | 4.87e-02 | 31 |
| GO:000218132 | Liver | Cyst | cytoplasmic translation | 70/496 | 148/18723 | 9.01e-71 | 3.85e-67 | 70 |
| GO:000697932 | Liver | Cyst | response to oxidative stress | 30/496 | 446/18723 | 3.22e-06 | 2.66e-04 | 30 |
| GO:000641732 | Liver | Cyst | regulation of translation | 28/496 | 468/18723 | 5.69e-05 | 3.00e-03 | 28 |
| GO:004572722 | Liver | Cyst | positive regulation of translation | 13/496 | 136/18723 | 6.75e-05 | 3.39e-03 | 13 |
| GO:000030232 | Liver | Cyst | response to reactive oxygen species | 16/496 | 222/18723 | 2.97e-04 | 9.67e-03 | 16 |
| GO:003425032 | Liver | Cyst | positive regulation of cellular amide metabolic process | 13/496 | 162/18723 | 3.89e-04 | 1.21e-02 | 13 |
| GO:000641421 | Liver | Cyst | translational elongation | 7/496 | 55/18723 | 5.93e-04 | 1.71e-02 | 7 |
| GO:00021818 | Lung | IAC | cytoplasmic translation | 85/2061 | 148/18723 | 3.11e-43 | 1.85e-39 | 85 |
| GO:00064178 | Lung | IAC | regulation of translation | 86/2061 | 468/18723 | 1.16e-06 | 6.18e-05 | 86 |
| Page: 1 2 3 4 5 6 7 8 9 10 11 12 13 14 15 16 17 18 19 20 21 22 23 24 25 26 27 28 29 30 31 32 33 34 35 36 37 38 39 40 41 42 43 44 45 46 47 48 49 50 51 52 53 54 55 |
| Pathway ID | Tissue | Disease Stage | Description | Gene Ratio | Bg Ratio | pvalue | p.adjust | qvalue | Count |
| hsa049218 | Cervix | CC | Oxytocin signaling pathway | 34/1267 | 154/8465 | 1.12e-02 | 3.42e-02 | 2.02e-02 | 34 |
| hsa0492111 | Cervix | CC | Oxytocin signaling pathway | 34/1267 | 154/8465 | 1.12e-02 | 3.42e-02 | 2.02e-02 | 34 |
| hsa04152 | Colorectum | AD | AMPK signaling pathway | 47/2092 | 121/8465 | 3.74e-04 | 2.82e-03 | 1.80e-03 | 47 |
| hsa041521 | Colorectum | AD | AMPK signaling pathway | 47/2092 | 121/8465 | 3.74e-04 | 2.82e-03 | 1.80e-03 | 47 |
| hsa041522 | Colorectum | MSS | AMPK signaling pathway | 41/1875 | 121/8465 | 1.91e-03 | 9.83e-03 | 6.03e-03 | 41 |
| hsa041523 | Colorectum | MSS | AMPK signaling pathway | 41/1875 | 121/8465 | 1.91e-03 | 9.83e-03 | 6.03e-03 | 41 |
| hsa041524 | Colorectum | FAP | AMPK signaling pathway | 37/1404 | 121/8465 | 8.97e-05 | 8.56e-04 | 5.21e-04 | 37 |
| hsa041525 | Colorectum | FAP | AMPK signaling pathway | 37/1404 | 121/8465 | 8.97e-05 | 8.56e-04 | 5.21e-04 | 37 |
| hsa041526 | Colorectum | CRC | AMPK signaling pathway | 31/1091 | 121/8465 | 1.04e-04 | 1.57e-03 | 1.07e-03 | 31 |
| hsa041527 | Colorectum | CRC | AMPK signaling pathway | 31/1091 | 121/8465 | 1.04e-04 | 1.57e-03 | 1.07e-03 | 31 |
| hsa0415210 | Esophagus | ESCC | AMPK signaling pathway | 80/4205 | 121/8465 | 1.73e-04 | 6.67e-04 | 3.42e-04 | 80 |
| hsa0415213 | Esophagus | ESCC | AMPK signaling pathway | 80/4205 | 121/8465 | 1.73e-04 | 6.67e-04 | 3.42e-04 | 80 |
| hsa041528 | Liver | NAFLD | AMPK signaling pathway | 28/1043 | 121/8465 | 6.26e-04 | 9.78e-03 | 7.88e-03 | 28 |
| hsa0415211 | Liver | NAFLD | AMPK signaling pathway | 28/1043 | 121/8465 | 6.26e-04 | 9.78e-03 | 7.88e-03 | 28 |
| hsa0415221 | Liver | Cirrhotic | AMPK signaling pathway | 49/2530 | 121/8465 | 7.90e-03 | 2.74e-02 | 1.69e-02 | 49 |
| hsa0415231 | Liver | Cirrhotic | AMPK signaling pathway | 49/2530 | 121/8465 | 7.90e-03 | 2.74e-02 | 1.69e-02 | 49 |
| hsa0415241 | Liver | HCC | AMPK signaling pathway | 77/4020 | 121/8465 | 2.32e-04 | 1.11e-03 | 6.18e-04 | 77 |
| hsa0415251 | Liver | HCC | AMPK signaling pathway | 77/4020 | 121/8465 | 2.32e-04 | 1.11e-03 | 6.18e-04 | 77 |
| hsa04921 | Lung | IAC | Oxytocin signaling pathway | 33/1053 | 154/8465 | 1.09e-03 | 7.82e-03 | 5.19e-03 | 33 |
| hsa049211 | Lung | IAC | Oxytocin signaling pathway | 33/1053 | 154/8465 | 1.09e-03 | 7.82e-03 | 5.19e-03 | 33 |
| Page: 1 2 |
Top |
Cell-cell communication analysis |
| Identification of potential cell-cell interactions between two cell types and their ligand-receptor pairs for different disease states |
| Ligand | Receptor | LRpair | Pathway | Tissue | Disease Stage |
| Page: 1 |
Top |
Single-cell gene regulatory network inference analysis |
| Find out the significant the regulons (TFs) and the target genes of each regulon across cell types for different disease states |
| TF | Cell Type | Tissue | Disease Stage | Target Gene | RSS | Regulon Activity |
| ∗The dot plots of a searched regulon are shown for all cell subpopulations in each disease state of each tissue based on the regulon specific score inferred using pySCENIC and by calculating the average expression. |
| Page: 1 |
Top |
Somatic mutation of malignant transformation related genes |
| Annotation of somatic variants for genes involved in malignant transformation |
| Hugo Symbol | Variant Class | Variant Classification | dbSNP RS | HGVSc | HGVSp | HGVSp Short | SWISSPROT | BIOTYPE | SIFT | PolyPhen | Tumor Sample Barcode | Tissue | Histology | Sex | Age | Stage | Therapy Types | Drugs | Outcome |
| EEF2 | SNV | Missense_Mutation | c.2069N>T | p.Gly690Val | p.G690V | P13639 | protein_coding | deleterious(0) | probably_damaging(1) | TCGA-A2-A04P-01 | Breast | breast invasive carcinoma | Female | <65 | III/IV | Chemotherapy | taxol | PD | |
| EEF2 | SNV | Missense_Mutation | novel | c.1130N>T | p.Pro377Leu | p.P377L | P13639 | protein_coding | tolerated(0.56) | benign(0) | TCGA-A7-A6VX-01 | Breast | breast invasive carcinoma | Female | >=65 | I/II | Chemotherapy | docetaxel | CR |
| EEF2 | SNV | Missense_Mutation | c.615N>G | p.Ile205Met | p.I205M | P13639 | protein_coding | deleterious(0) | benign(0.248) | TCGA-A8-A06X-01 | Breast | breast invasive carcinoma | Female | >=65 | I/II | Unknown | Unknown | SD | |
| EEF2 | SNV | Missense_Mutation | c.358N>G | p.Arg120Gly | p.R120G | P13639 | protein_coding | deleterious(0) | probably_damaging(0.995) | TCGA-AR-A24K-01 | Breast | breast invasive carcinoma | Female | <65 | I/II | Unspecific | Paclitaxel | SD | |
| EEF2 | SNV | Missense_Mutation | rs778994144 | c.688G>A | p.Glu230Lys | p.E230K | P13639 | protein_coding | tolerated(1) | probably_damaging(0.993) | TCGA-BH-A0BR-01 | Breast | breast invasive carcinoma | Female | <65 | I/II | Unknown | Unknown | SD |
| EEF2 | SNV | Missense_Mutation | novel | c.586N>A | p.Glu196Lys | p.E196K | P13639 | protein_coding | tolerated(0.21) | benign(0.027) | TCGA-C8-A3M7-01 | Breast | breast invasive carcinoma | Female | <65 | III/IV | Unknown | Unknown | PD |
| EEF2 | SNV | Missense_Mutation | c.1738N>T | p.Arg580Cys | p.R580C | P13639 | protein_coding | deleterious(0.04) | possibly_damaging(0.869) | TCGA-EW-A1IW-01 | Breast | breast invasive carcinoma | Female | >=65 | I/II | Hormone Therapy | aromasin | SD | |
| EEF2 | insertion | Nonsense_Mutation | novel | c.839_840insTTGCTCTGTTGCTTAGGCTGGAGTGCAATGG | p.Glu281CysfsTer5 | p.E281Cfs*5 | P13639 | protein_coding | TCGA-AN-A0FV-01 | Breast | breast invasive carcinoma | Female | <65 | I/II | Unknown | Unknown | SD | ||
| EEF2 | SNV | Missense_Mutation | novel | c.31N>A | p.Ala11Thr | p.A11T | P13639 | protein_coding | tolerated(0.32) | benign(0.001) | TCGA-2W-A8YY-01 | Cervix | cervical & endocervical cancer | Female | <65 | I/II | Chemotherapy | cisplatin | CR |
| EEF2 | SNV | Missense_Mutation | c.1801N>T | p.Arg601Trp | p.R601W | P13639 | protein_coding | deleterious(0) | probably_damaging(0.936) | TCGA-EA-A3HT-01 | Cervix | cervical & endocervical cancer | Female | >=65 | I/II | Unknown | Unknown | SD |
| Page: 1 2 3 4 5 6 7 8 9 10 11 12 |
Top |
Related drugs of malignant transformation related genes |
| Identification of chemicals and drugs interact with genes involved in malignant transfromation |
| (DGIdb 4.0) |
| Entrez ID | Symbol | Category | Interaction Types | Drug Claim Name | Drug Name | PMIDs |
| 1938 | EEF2 | DRUGGABLE GENOME, KINASE | SS1(DSFV)-PE38 | |||
| 1938 | EEF2 | DRUGGABLE GENOME, KINASE | inhibitor | CHEMBL1201550 | DENILEUKIN DIFTITOX | |
| 1938 | EEF2 | DRUGGABLE GENOME, KINASE | VB4-845 | OPORTUZUMAB MONATOX | ||
| 1938 | EEF2 | DRUGGABLE GENOME, KINASE | LACTIMIDOMYCIN | LACTIMIDOMYCIN | 20118940 | |
| 1938 | EEF2 | DRUGGABLE GENOME, KINASE | CYCLOHEXIMIDE | CYCLOHEXIMIDE | 20118940 |
| Page: 1 |

Copyright 2023-Present -The University of Texas Health Science Center at Houston |