
|
|||||
|
 | |
| |
| |
| |
| |
| |
|
Gene: ZBTB7A |
Gene summary for ZBTB7A |
| Gene information | Species | Human | Gene symbol | ZBTB7A | Gene ID | 51341 |
| Gene name | zinc finger and BTB domain containing 7A | |
| Gene Alias | FBI-1 | |
| Cytomap | 19p13.3 | |
| Gene Type | protein-coding | GO ID | GO:0000122 | UniProtAcc | O95365 |
Top |
Malignant transformation analysis |
| Identification of the aberrant gene expression in precancerous and cancerous lesions by comparing the gene expression of stem-like cells in diseased tissues with normal stem cells |
| Entrez ID | Symbol | Replicates | Species | Organ | Tissue | Adj P-value | Log2FC | Malignancy |
| 51341 | ZBTB7A | HTA11_3410_2000001011 | Human | Colorectum | AD | 2.82e-06 | -4.15e-01 | 0.0155 |
| 51341 | ZBTB7A | HTA11_347_2000001011 | Human | Colorectum | AD | 2.03e-18 | 6.56e-01 | -0.1954 |
| 51341 | ZBTB7A | HTA11_411_2000001011 | Human | Colorectum | SER | 7.02e-03 | 7.51e-01 | -0.2602 |
| 51341 | ZBTB7A | HTA11_83_2000001011 | Human | Colorectum | SER | 6.42e-06 | 6.01e-01 | -0.1526 |
| 51341 | ZBTB7A | HTA11_696_2000001011 | Human | Colorectum | AD | 1.91e-06 | 4.91e-01 | -0.1464 |
| 51341 | ZBTB7A | HTA11_1391_2000001011 | Human | Colorectum | AD | 1.58e-04 | 5.56e-01 | -0.059 |
| 51341 | ZBTB7A | HTA11_99999970781_79442 | Human | Colorectum | MSS | 4.44e-05 | -3.69e-01 | 0.294 |
| 51341 | ZBTB7A | A002-C-010 | Human | Colorectum | FAP | 8.87e-06 | -3.40e-01 | 0.242 |
| 51341 | ZBTB7A | A015-C-203 | Human | Colorectum | FAP | 1.20e-24 | -2.58e-01 | -0.1294 |
| 51341 | ZBTB7A | A002-C-201 | Human | Colorectum | FAP | 1.52e-07 | -8.98e-02 | 0.0324 |
| 51341 | ZBTB7A | A002-C-203 | Human | Colorectum | FAP | 8.04e-06 | -1.54e-01 | 0.2786 |
| 51341 | ZBTB7A | A001-C-108 | Human | Colorectum | FAP | 1.79e-12 | -1.26e-01 | -0.0272 |
| 51341 | ZBTB7A | A002-C-205 | Human | Colorectum | FAP | 2.46e-15 | -2.90e-01 | -0.1236 |
| 51341 | ZBTB7A | A001-C-104 | Human | Colorectum | FAP | 6.73e-03 | -2.29e-01 | 0.0184 |
| 51341 | ZBTB7A | A015-C-005 | Human | Colorectum | FAP | 4.48e-02 | -1.76e-01 | -0.0336 |
| 51341 | ZBTB7A | A015-C-006 | Human | Colorectum | FAP | 1.27e-10 | -2.72e-02 | -0.0994 |
| 51341 | ZBTB7A | A015-C-106 | Human | Colorectum | FAP | 4.99e-08 | -2.24e-01 | -0.0511 |
| 51341 | ZBTB7A | A002-C-114 | Human | Colorectum | FAP | 3.92e-12 | -2.61e-02 | -0.1561 |
| 51341 | ZBTB7A | A015-C-104 | Human | Colorectum | FAP | 1.06e-25 | -2.57e-01 | -0.1899 |
| 51341 | ZBTB7A | A001-C-014 | Human | Colorectum | FAP | 1.95e-12 | -2.05e-01 | 0.0135 |
| Page: 1 2 3 4 5 6 7 8 9 |
| Tissue | Expression Dynamics | Abbreviation |
| Colorectum (GSE201348) |  | FAP: Familial adenomatous polyposis |
| CRC: Colorectal cancer | ||
| Colorectum (HTA11) |  | AD: Adenomas |
| SER: Sessile serrated lesions | ||
| MSI-H: Microsatellite-high colorectal cancer | ||
| MSS: Microsatellite stable colorectal cancer | ||
| Esophagus | 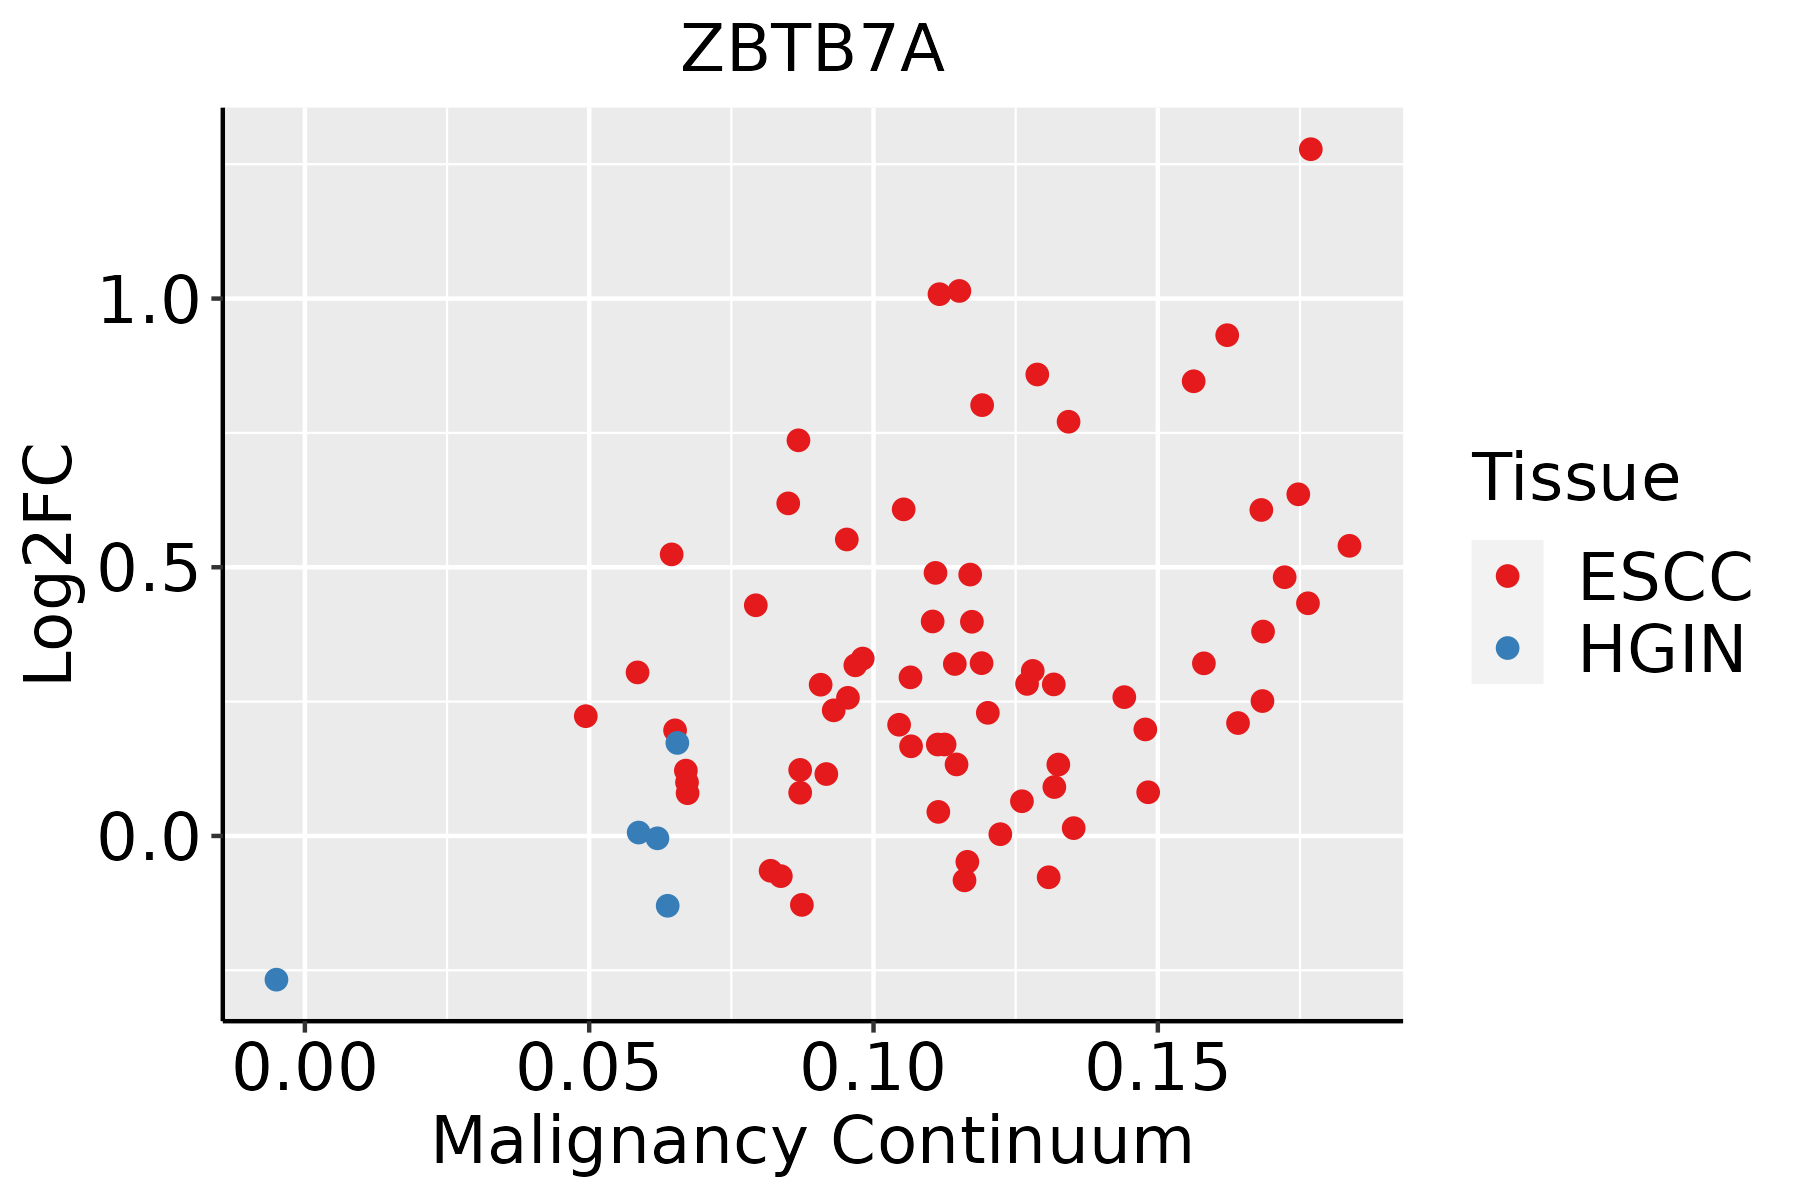 | ESCC: Esophageal squamous cell carcinoma |
| HGIN: High-grade intraepithelial neoplasias | ||
| LGIN: Low-grade intraepithelial neoplasias | ||
| Liver | 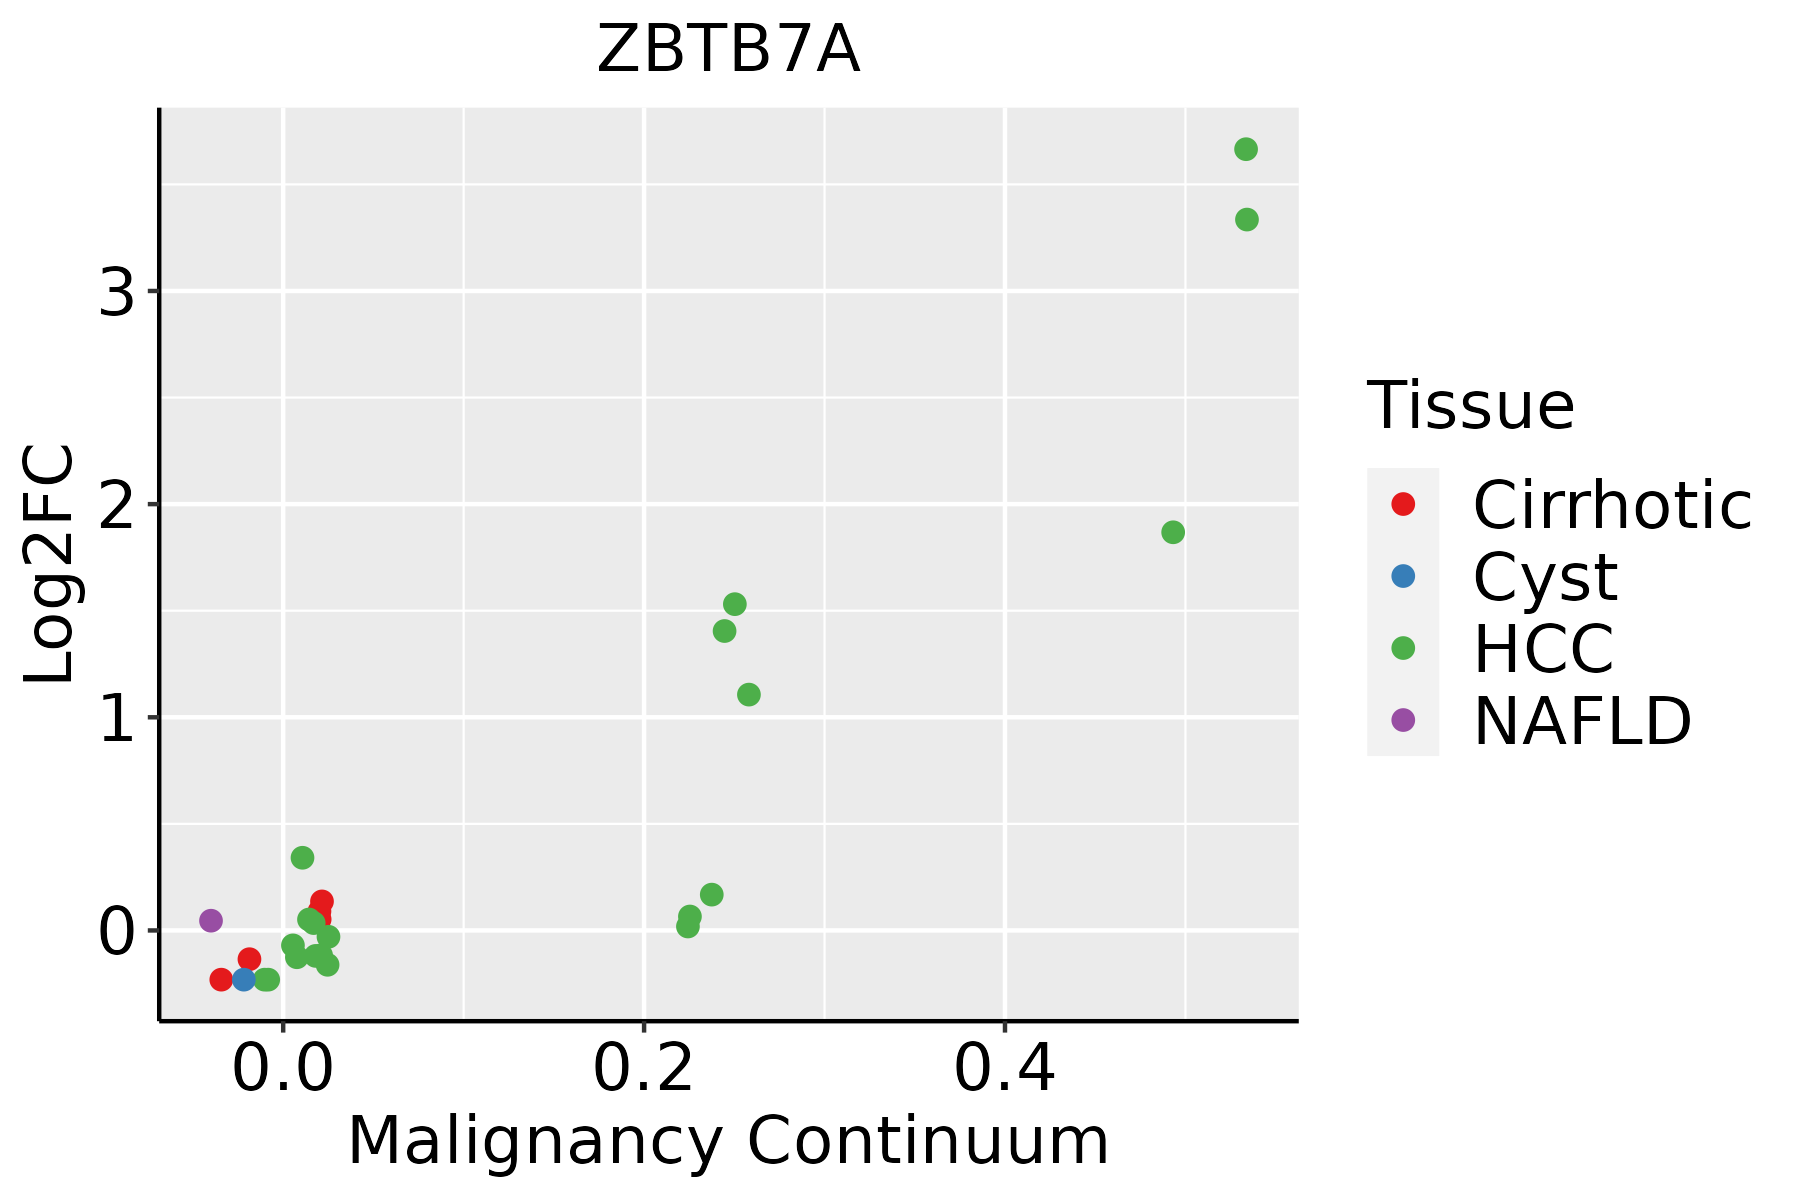 | HCC: Hepatocellular carcinoma |
| NAFLD: Non-alcoholic fatty liver disease | ||
| Oral Cavity | 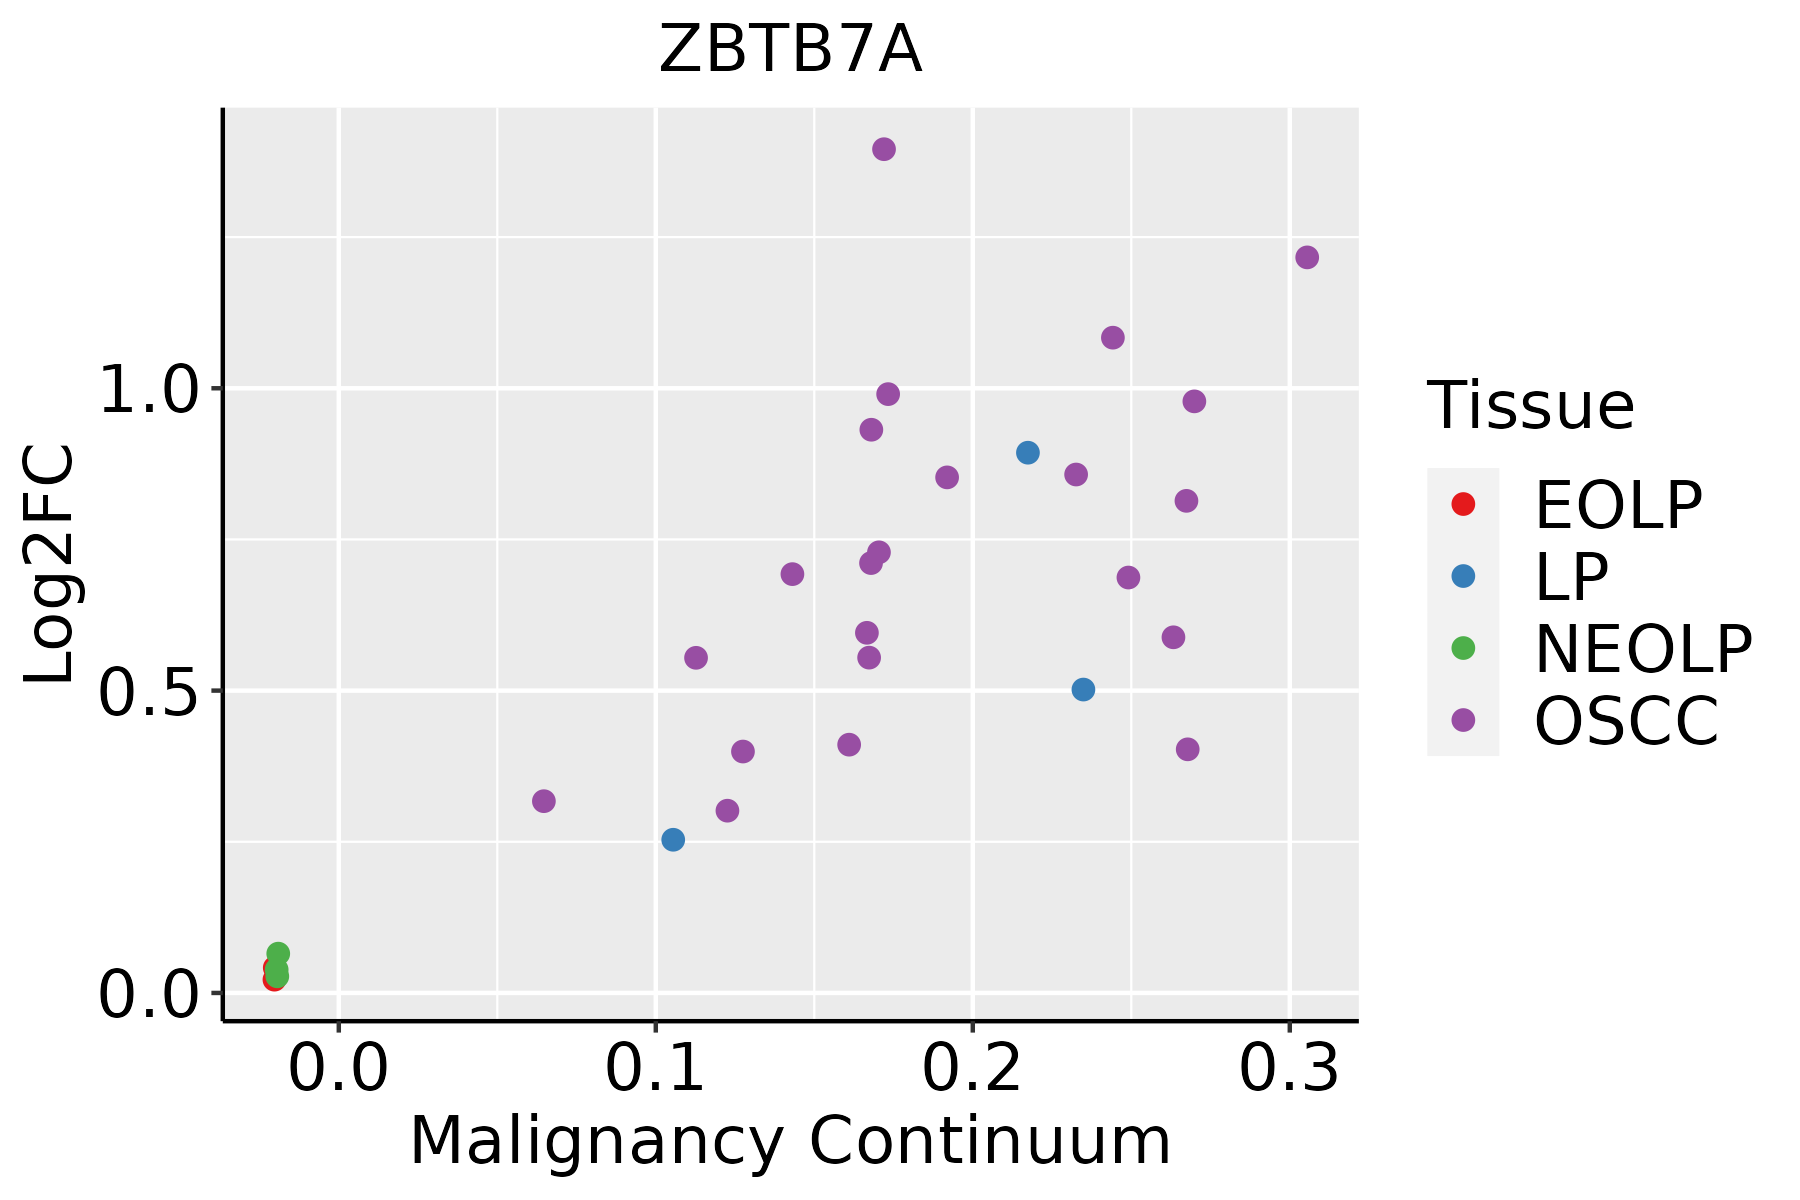 | EOLP: Erosive Oral lichen planus |
| LP: leukoplakia | ||
| NEOLP: Non-erosive oral lichen planus | ||
| OSCC: Oral squamous cell carcinoma | ||
| Prostate |  | BPH: Benign Prostatic Hyperplasia |
| Skin | 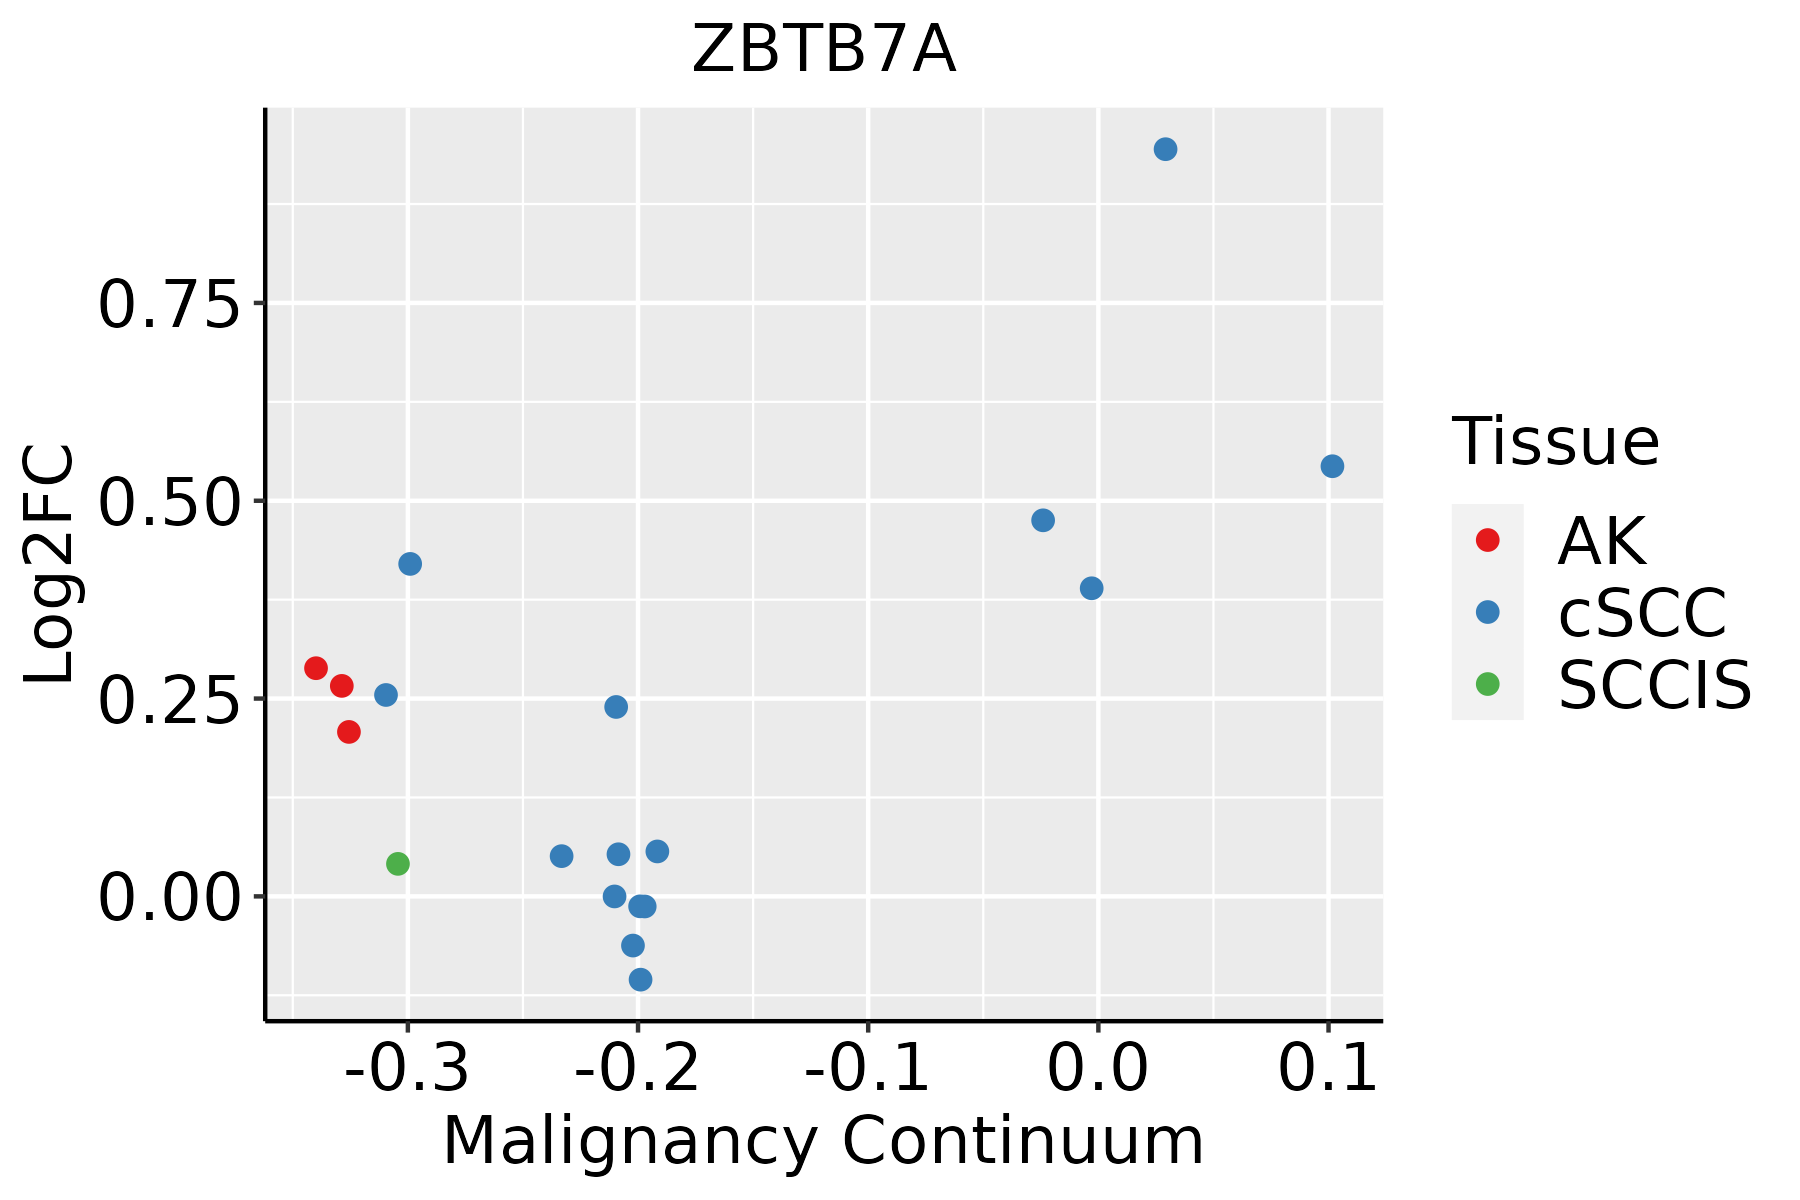 | AK: Actinic keratosis |
| cSCC: Cutaneous squamous cell carcinoma | ||
| SCCIS:squamous cell carcinoma in situ | ||
| Thyroid | 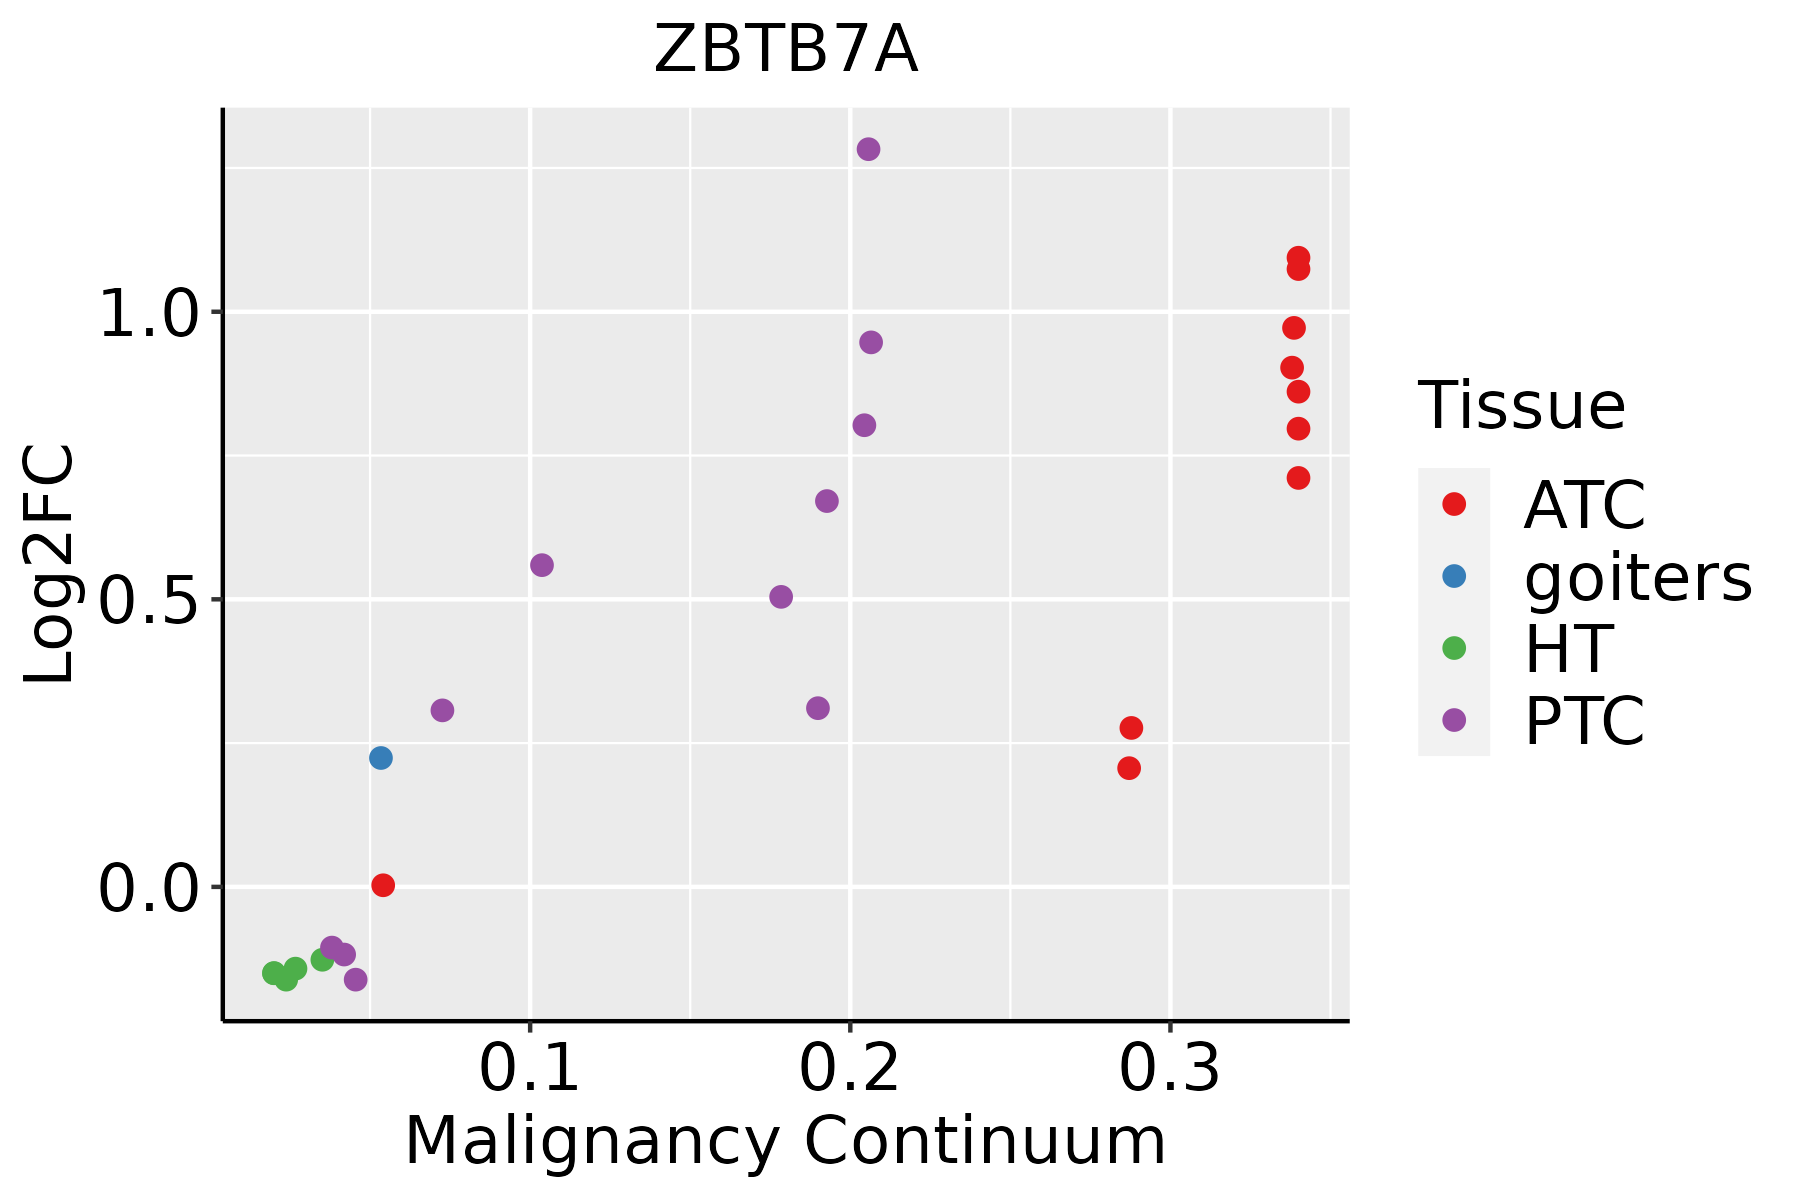 | ATC: Anaplastic thyroid cancer |
| HT: Hashimoto's thyroiditis | ||
| PTC: Papillary thyroid cancer |
| ∗log2FC in expression of this searched gene in stem-like cells from each diseased tissue sample relative to stem-like cells in normal samples in each tissue plotted against the malignancy continuum. Samples are colored based on if they are from different disease stage. |
Top |
Malignant transformation related pathway analysis |
| Find out the enriched GO biological processes and KEGG pathways involved in transition from healthy to precancer to cancer |
| Tissue | Disease Stage | Enriched GO biological Processes |
| Colorectum | AD |  |
| Colorectum | SER |  |
| Colorectum | MSS |  |
| Colorectum | MSI-H |  |
| Colorectum | FAP |  |
| ∗Top 15 enriched GO BP terms are showed in the bar plot of each disease state in each tissue. Each row represents a significant GO biological process which is colored according to the -log10(p.adjust). |
| Page: 1 2 3 4 5 6 7 8 9 |
| GO ID | Tissue | Disease Stage | Description | Gene Ratio | Bg Ratio | pvalue | p.adjust | Count |
| GO:006201222 | Liver | HCC | regulation of small molecule metabolic process | 190/7958 | 334/18723 | 6.77e-08 | 1.40e-06 | 190 |
| GO:000918522 | Liver | HCC | ribonucleoside diphosphate metabolic process | 72/7958 | 106/18723 | 1.05e-07 | 2.03e-06 | 72 |
| GO:004603122 | Liver | HCC | ADP metabolic process | 63/7958 | 90/18723 | 1.17e-07 | 2.25e-06 | 63 |
| GO:000913522 | Liver | HCC | purine nucleoside diphosphate metabolic process | 70/7958 | 103/18723 | 1.52e-07 | 2.82e-06 | 70 |
| GO:000917922 | Liver | HCC | purine ribonucleoside diphosphate metabolic process | 70/7958 | 103/18723 | 1.52e-07 | 2.82e-06 | 70 |
| GO:000913222 | Liver | HCC | nucleoside diphosphate metabolic process | 81/7958 | 124/18723 | 2.34e-07 | 4.17e-06 | 81 |
| GO:000610921 | Liver | HCC | regulation of carbohydrate metabolic process | 109/7958 | 178/18723 | 3.36e-07 | 5.78e-06 | 109 |
| GO:004693922 | Liver | HCC | nucleotide phosphorylation | 68/7958 | 101/18723 | 3.95e-07 | 6.70e-06 | 68 |
| GO:000616522 | Liver | HCC | nucleoside diphosphate phosphorylation | 66/7958 | 99/18723 | 1.01e-06 | 1.52e-05 | 66 |
| GO:000609622 | Liver | HCC | glycolytic process | 56/7958 | 81/18723 | 1.11e-06 | 1.65e-05 | 56 |
| GO:000675722 | Liver | HCC | ATP generation from ADP | 56/7958 | 82/18723 | 2.06e-06 | 2.83e-05 | 56 |
| GO:004340121 | Liver | HCC | steroid hormone mediated signaling pathway | 84/7958 | 136/18723 | 4.42e-06 | 5.62e-05 | 84 |
| GO:003051821 | Liver | HCC | intracellular steroid hormone receptor signaling pathway | 73/7958 | 116/18723 | 7.04e-06 | 8.41e-05 | 73 |
| GO:000038021 | Liver | HCC | alternative mRNA splicing, via spliceosome | 52/7958 | 77/18723 | 7.87e-06 | 9.27e-05 | 52 |
| GO:003410122 | Liver | HCC | erythrocyte homeostasis | 79/7958 | 129/18723 | 1.32e-05 | 1.47e-04 | 79 |
| GO:000226222 | Liver | HCC | myeloid cell homeostasis | 93/7958 | 157/18723 | 1.67e-05 | 1.81e-04 | 93 |
| GO:007155921 | Liver | HCC | response to transforming growth factor beta | 141/7958 | 256/18723 | 3.08e-05 | 3.16e-04 | 141 |
| GO:003314321 | Liver | HCC | regulation of intracellular steroid hormone receptor signaling pathway | 49/7958 | 74/18723 | 3.21e-05 | 3.26e-04 | 49 |
| GO:004347021 | Liver | HCC | regulation of carbohydrate catabolic process | 39/7958 | 56/18723 | 3.63e-05 | 3.61e-04 | 39 |
| GO:003021812 | Liver | HCC | erythrocyte differentiation | 73/7958 | 120/18723 | 3.82e-05 | 3.80e-04 | 73 |
| Page: 1 2 3 4 5 6 7 8 9 10 11 12 13 14 15 16 17 18 19 20 21 22 23 24 25 26 27 28 29 30 31 32 33 34 35 36 37 38 39 40 41 42 43 44 45 46 47 48 49 50 51 |
| Pathway ID | Tissue | Disease Stage | Description | Gene Ratio | Bg Ratio | pvalue | p.adjust | qvalue | Count |
| Page: 1 |
Top |
Cell-cell communication analysis |
| Identification of potential cell-cell interactions between two cell types and their ligand-receptor pairs for different disease states |
| Ligand | Receptor | LRpair | Pathway | Tissue | Disease Stage |
| Page: 1 |
Top |
Single-cell gene regulatory network inference analysis |
| Find out the significant the regulons (TFs) and the target genes of each regulon across cell types for different disease states |
| TF | Cell Type | Tissue | Disease Stage | Target Gene | RSS | Regulon Activity |
| ZBTB7A | MLUM | Breast | DCIS | MALAT1,DDX5,PPDPF, etc. | 6.46e-01 |  |
| ZBTB7A | BN | Liver | HCC | RNF166,PPP3R1,XPC, etc. | 4.84e-02 |  |
| ∗The dot plots of a searched regulon are shown for all cell subpopulations in each disease state of each tissue based on the regulon specific score inferred using pySCENIC and by calculating the average expression. |
| Page: 1 |
Top |
Somatic mutation of malignant transformation related genes |
| Annotation of somatic variants for genes involved in malignant transformation |
| Hugo Symbol | Variant Class | Variant Classification | dbSNP RS | HGVSc | HGVSp | HGVSp Short | SWISSPROT | BIOTYPE | SIFT | PolyPhen | Tumor Sample Barcode | Tissue | Histology | Sex | Age | Stage | Therapy Types | Drugs | Outcome |
| ZBTB7A | SNV | Missense_Mutation | novel | c.1125N>T | p.Lys375Asn | p.K375N | O95365 | protein_coding | deleterious(0) | probably_damaging(0.973) | TCGA-GM-A2DD-01 | Breast | breast invasive carcinoma | Female | <65 | I/II | Chemotherapy | fluorouracil | CR |
| ZBTB7A | SNV | Missense_Mutation | rs753845110 | c.1684N>A | p.Gly562Ser | p.G562S | O95365 | protein_coding | tolerated_low_confidence(0.71) | benign(0.001) | TCGA-2W-A8YY-01 | Cervix | cervical & endocervical cancer | Female | <65 | I/II | Chemotherapy | cisplatin | CR |
| ZBTB7A | SNV | Missense_Mutation | novel | c.1435N>A | p.Asp479Asn | p.D479N | O95365 | protein_coding | deleterious(0) | possibly_damaging(0.872) | TCGA-2W-A8YY-01 | Cervix | cervical & endocervical cancer | Female | <65 | I/II | Chemotherapy | cisplatin | CR |
| ZBTB7A | SNV | Missense_Mutation | novel | c.700N>A | p.Gly234Arg | p.G234R | O95365 | protein_coding | tolerated(0.18) | possibly_damaging(0.502) | TCGA-2W-A8YY-01 | Cervix | cervical & endocervical cancer | Female | <65 | I/II | Chemotherapy | cisplatin | CR |
| ZBTB7A | insertion | Frame_Shift_Ins | rs749935719 | c.522dupC | p.Ala175ArgfsTer19 | p.A175Rfs*19 | O95365 | protein_coding | TCGA-EA-A6QX-01 | Cervix | cervical & endocervical cancer | Female | <65 | III/IV | Unknown | Unknown | SD | ||
| ZBTB7A | SNV | Missense_Mutation | c.1217N>T | p.Gly406Val | p.G406V | O95365 | protein_coding | deleterious(0) | probably_damaging(0.999) | TCGA-AA-3866-01 | Colorectum | colon adenocarcinoma | Female | >=65 | I/II | Unknown | Unknown | SD | |
| ZBTB7A | SNV | Missense_Mutation | novel | c.1211A>G | p.His404Arg | p.H404R | O95365 | protein_coding | deleterious(0.01) | probably_damaging(0.975) | TCGA-AA-3984-01 | Colorectum | colon adenocarcinoma | Female | <65 | I/II | Unknown | Unknown | SD |
| ZBTB7A | SNV | Missense_Mutation | novel | c.1220A>T | p.Glu407Val | p.E407V | O95365 | protein_coding | deleterious(0) | probably_damaging(0.976) | TCGA-AA-A022-01 | Colorectum | colon adenocarcinoma | Female | >=65 | I/II | Unknown | Unknown | SD |
| ZBTB7A | SNV | Missense_Mutation | c.469N>A | p.Ala157Thr | p.A157T | O95365 | protein_coding | deleterious(0.03) | possibly_damaging(0.713) | TCGA-CK-4951-01 | Colorectum | colon adenocarcinoma | Female | >=65 | I/II | Unknown | Unknown | PD | |
| ZBTB7A | SNV | Missense_Mutation | c.28N>A | p.Gly10Arg | p.G10R | O95365 | protein_coding | deleterious(0) | probably_damaging(0.989) | TCGA-CM-4744-01 | Colorectum | colon adenocarcinoma | Male | >=65 | I/II | Unknown | Unknown | SD |
| Page: 1 2 3 4 5 |
Top |
Related drugs of malignant transformation related genes |
| Identification of chemicals and drugs interact with genes involved in malignant transfromation |
| (DGIdb 4.0) |
| Entrez ID | Symbol | Category | Interaction Types | Drug Claim Name | Drug Name | PMIDs |
| Page: 1 |

Copyright 2023-Present -The University of Texas Health Science Center at Houston |