
|
|||||
|
 | |
| |
| |
| |
| |
| |
|
Gene: ZBTB2 |
Gene summary for ZBTB2 |
| Gene information | Species | Human | Gene symbol | ZBTB2 | Gene ID | 57621 |
| Gene name | zinc finger and BTB domain containing 2 | |
| Gene Alias | ZNF437 | |
| Cytomap | 6q25.1 | |
| Gene Type | protein-coding | GO ID | GO:0000122 | UniProtAcc | Q8N680 |
Top |
Malignant transformation analysis |
| Identification of the aberrant gene expression in precancerous and cancerous lesions by comparing the gene expression of stem-like cells in diseased tissues with normal stem cells |
| Entrez ID | Symbol | Replicates | Species | Organ | Tissue | Adj P-value | Log2FC | Malignancy |
| 57621 | ZBTB2 | LZE4T | Human | Esophagus | ESCC | 2.05e-03 | -1.19e-02 | 0.0811 |
| 57621 | ZBTB2 | LZE24T | Human | Esophagus | ESCC | 6.19e-08 | 1.22e-01 | 0.0596 |
| 57621 | ZBTB2 | P2T-E | Human | Esophagus | ESCC | 6.30e-07 | 8.50e-02 | 0.1177 |
| 57621 | ZBTB2 | P4T-E | Human | Esophagus | ESCC | 1.18e-06 | 1.79e-01 | 0.1323 |
| 57621 | ZBTB2 | P5T-E | Human | Esophagus | ESCC | 2.68e-10 | 2.87e-02 | 0.1327 |
| 57621 | ZBTB2 | P8T-E | Human | Esophagus | ESCC | 6.28e-07 | 8.27e-02 | 0.0889 |
| 57621 | ZBTB2 | P9T-E | Human | Esophagus | ESCC | 5.84e-04 | 5.82e-03 | 0.1131 |
| 57621 | ZBTB2 | P10T-E | Human | Esophagus | ESCC | 8.27e-06 | -5.79e-02 | 0.116 |
| 57621 | ZBTB2 | P11T-E | Human | Esophagus | ESCC | 6.25e-03 | 3.35e-01 | 0.1426 |
| 57621 | ZBTB2 | P15T-E | Human | Esophagus | ESCC | 6.17e-07 | 2.33e-01 | 0.1149 |
| 57621 | ZBTB2 | P16T-E | Human | Esophagus | ESCC | 2.73e-05 | 1.31e-01 | 0.1153 |
| 57621 | ZBTB2 | P17T-E | Human | Esophagus | ESCC | 1.15e-02 | 3.08e-02 | 0.1278 |
| 57621 | ZBTB2 | P19T-E | Human | Esophagus | ESCC | 3.19e-02 | 1.39e-01 | 0.1662 |
| 57621 | ZBTB2 | P20T-E | Human | Esophagus | ESCC | 3.10e-06 | 9.51e-03 | 0.1124 |
| 57621 | ZBTB2 | P21T-E | Human | Esophagus | ESCC | 3.71e-15 | 6.86e-02 | 0.1617 |
| 57621 | ZBTB2 | P22T-E | Human | Esophagus | ESCC | 4.90e-07 | -1.54e-02 | 0.1236 |
| 57621 | ZBTB2 | P23T-E | Human | Esophagus | ESCC | 7.13e-07 | 3.71e-01 | 0.108 |
| 57621 | ZBTB2 | P24T-E | Human | Esophagus | ESCC | 3.62e-02 | 7.71e-02 | 0.1287 |
| 57621 | ZBTB2 | P26T-E | Human | Esophagus | ESCC | 6.77e-05 | 2.36e-01 | 0.1276 |
| 57621 | ZBTB2 | P27T-E | Human | Esophagus | ESCC | 1.64e-05 | 2.12e-01 | 0.1055 |
| Page: 1 2 3 |
| Tissue | Expression Dynamics | Abbreviation |
| Esophagus | 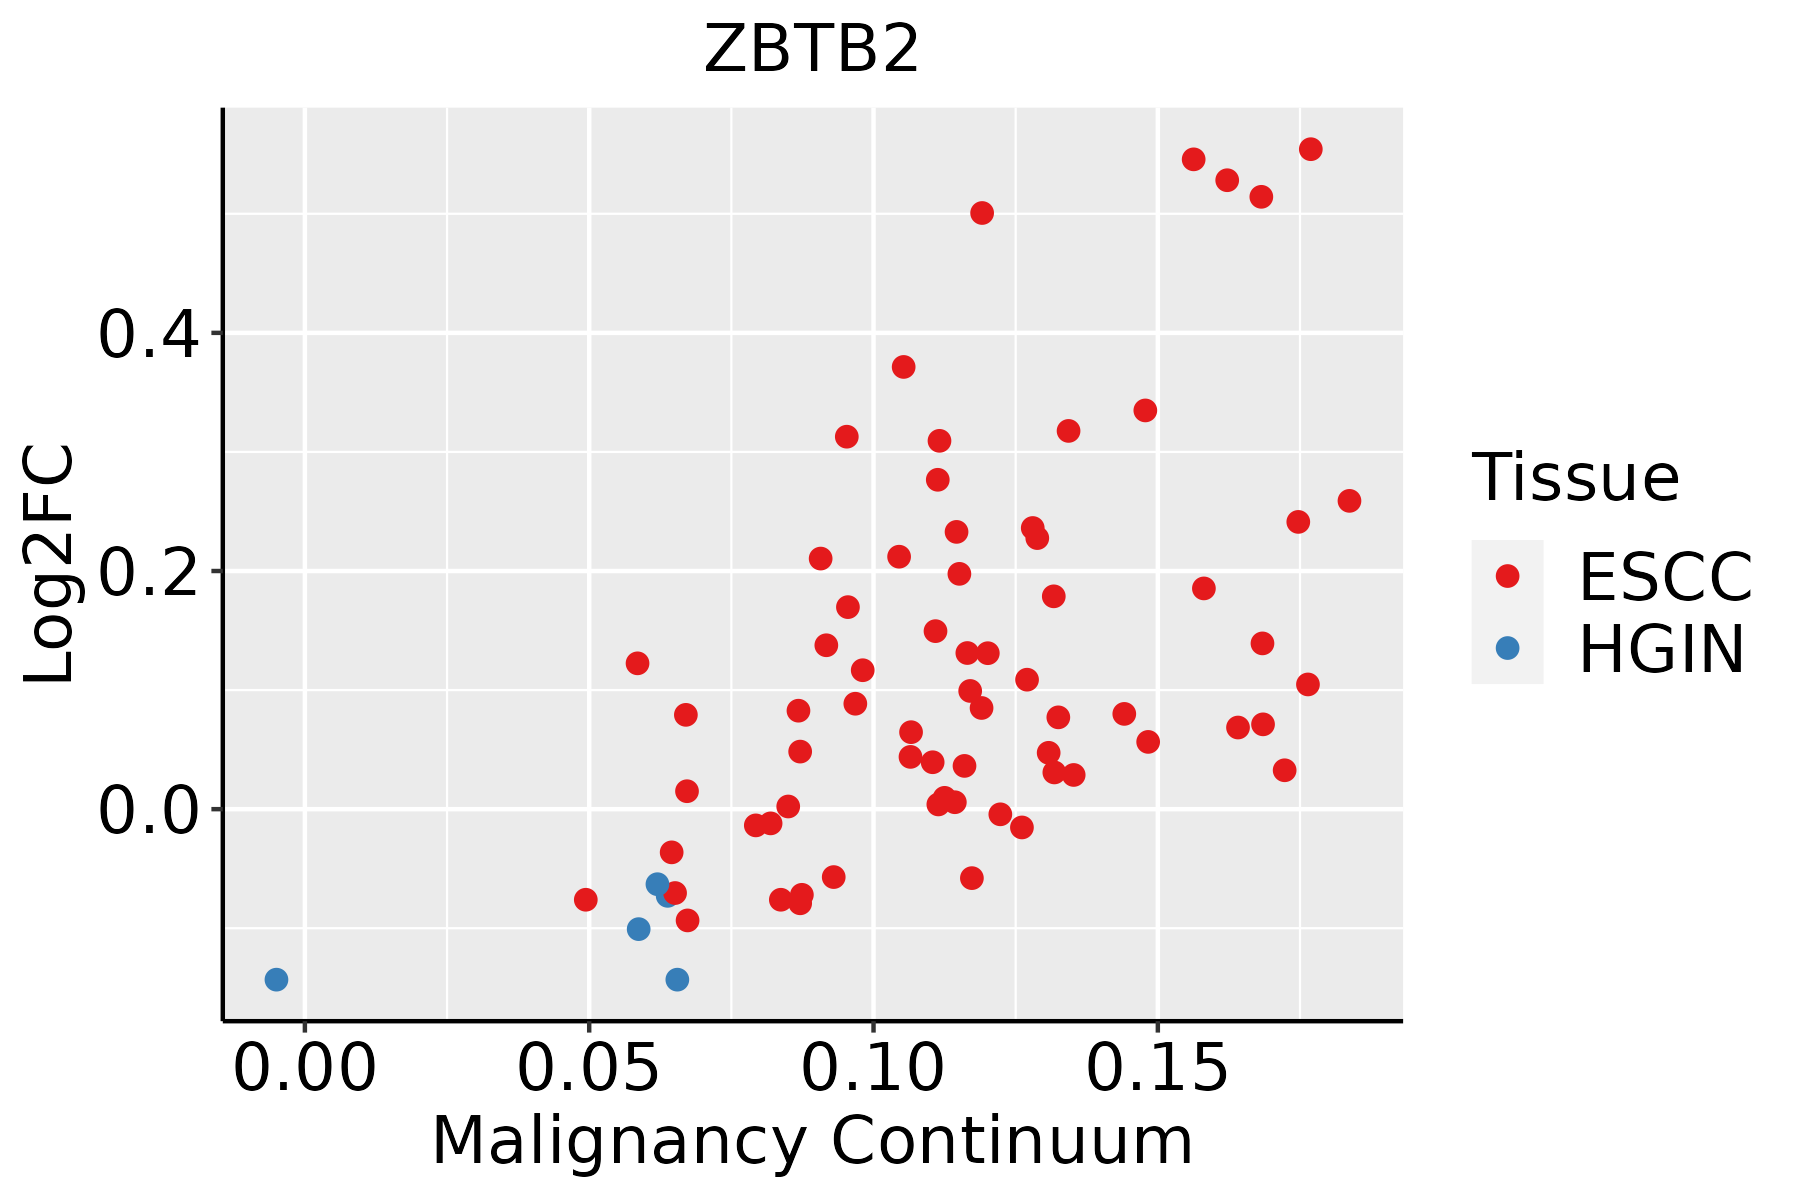 | ESCC: Esophageal squamous cell carcinoma |
| HGIN: High-grade intraepithelial neoplasias | ||
| LGIN: Low-grade intraepithelial neoplasias |
| ∗log2FC in expression of this searched gene in stem-like cells from each diseased tissue sample relative to stem-like cells in normal samples in each tissue plotted against the malignancy continuum. Samples are colored based on if they are from different disease stage. |
Top |
Malignant transformation related pathway analysis |
| Find out the enriched GO biological processes and KEGG pathways involved in transition from healthy to precancer to cancer |
| Tissue | Disease Stage | Enriched GO biological Processes |
| Colorectum | AD |  |
| Colorectum | SER |  |
| Colorectum | MSS |  |
| Colorectum | MSI-H |  |
| Colorectum | FAP |  |
| ∗Top 15 enriched GO BP terms are showed in the bar plot of each disease state in each tissue. Each row represents a significant GO biological process which is colored according to the -log10(p.adjust). |
| Page: 1 2 3 4 5 6 7 8 9 |
| GO ID | Tissue | Disease Stage | Description | Gene Ratio | Bg Ratio | pvalue | p.adjust | Count |
| GO:004259314 | Endometrium | EEC | glucose homeostasis | 56/2168 | 258/18723 | 2.26e-06 | 6.61e-05 | 56 |
| GO:003350014 | Endometrium | EEC | carbohydrate homeostasis | 56/2168 | 259/18723 | 2.56e-06 | 7.39e-05 | 56 |
| GO:004346714 | Endometrium | EEC | regulation of generation of precursor metabolites and energy | 34/2168 | 130/18723 | 3.36e-06 | 9.13e-05 | 34 |
| GO:000915017 | Endometrium | EEC | purine ribonucleotide metabolic process | 69/2168 | 368/18723 | 3.38e-05 | 5.77e-04 | 69 |
| GO:004693914 | Endometrium | EEC | nucleotide phosphorylation | 26/2168 | 101/18723 | 6.15e-05 | 9.28e-04 | 26 |
| GO:000913214 | Endometrium | EEC | nucleoside diphosphate metabolic process | 30/2168 | 124/18723 | 6.16e-05 | 9.28e-04 | 30 |
| GO:000913516 | Endometrium | EEC | purine nucleoside diphosphate metabolic process | 26/2168 | 103/18723 | 8.77e-05 | 1.24e-03 | 26 |
| GO:000917916 | Endometrium | EEC | purine ribonucleoside diphosphate metabolic process | 26/2168 | 103/18723 | 8.77e-05 | 1.24e-03 | 26 |
| GO:000616317 | Endometrium | EEC | purine nucleotide metabolic process | 71/2168 | 396/18723 | 1.14e-04 | 1.54e-03 | 71 |
| GO:000616514 | Endometrium | EEC | nucleoside diphosphate phosphorylation | 25/2168 | 99/18723 | 1.18e-04 | 1.58e-03 | 25 |
| GO:000925916 | Endometrium | EEC | ribonucleotide metabolic process | 69/2168 | 385/18723 | 1.43e-04 | 1.84e-03 | 69 |
| GO:000918515 | Endometrium | EEC | ribonucleoside diphosphate metabolic process | 26/2168 | 106/18723 | 1.46e-04 | 1.87e-03 | 26 |
| GO:007252117 | Endometrium | EEC | purine-containing compound metabolic process | 73/2168 | 416/18723 | 1.82e-04 | 2.24e-03 | 73 |
| GO:001969316 | Endometrium | EEC | ribose phosphate metabolic process | 70/2168 | 396/18723 | 1.96e-04 | 2.38e-03 | 70 |
| GO:000609615 | Endometrium | EEC | glycolytic process | 21/2168 | 81/18723 | 2.72e-04 | 3.09e-03 | 21 |
| GO:000675715 | Endometrium | EEC | ATP generation from ADP | 21/2168 | 82/18723 | 3.27e-04 | 3.61e-03 | 21 |
| GO:004603114 | Endometrium | EEC | ADP metabolic process | 22/2168 | 90/18723 | 4.82e-04 | 4.94e-03 | 22 |
| GO:190357816 | Endometrium | EEC | regulation of ATP metabolic process | 21/2168 | 87/18723 | 7.66e-04 | 7.16e-03 | 21 |
| GO:000911716 | Endometrium | EEC | nucleotide metabolic process | 80/2168 | 489/18723 | 8.65e-04 | 7.95e-03 | 80 |
| GO:000675315 | Endometrium | EEC | nucleoside phosphate metabolic process | 80/2168 | 497/18723 | 1.39e-03 | 1.14e-02 | 80 |
| Page: 1 2 3 4 5 6 7 8 9 10 11 12 13 14 15 16 17 18 19 20 21 22 23 24 25 26 27 28 29 30 31 32 33 34 35 36 37 38 39 40 41 42 43 44 45 46 47 48 49 50 51 52 53 54 55 56 |
| Pathway ID | Tissue | Disease Stage | Description | Gene Ratio | Bg Ratio | pvalue | p.adjust | qvalue | Count |
| Page: 1 |
Top |
Cell-cell communication analysis |
| Identification of potential cell-cell interactions between two cell types and their ligand-receptor pairs for different disease states |
| Ligand | Receptor | LRpair | Pathway | Tissue | Disease Stage |
| Page: 1 |
Top |
Single-cell gene regulatory network inference analysis |
| Find out the significant the regulons (TFs) and the target genes of each regulon across cell types for different disease states |
| TF | Cell Type | Tissue | Disease Stage | Target Gene | RSS | Regulon Activity |
| ZBTB2 | MYOFIB | Colorectum | CRC | EMCN,SPTLC2,NUAK1, etc. | 2.89e-02 |  |
| ∗The dot plots of a searched regulon are shown for all cell subpopulations in each disease state of each tissue based on the regulon specific score inferred using pySCENIC and by calculating the average expression. |
| Page: 1 |
Top |
Somatic mutation of malignant transformation related genes |
| Annotation of somatic variants for genes involved in malignant transformation |
| Hugo Symbol | Variant Class | Variant Classification | dbSNP RS | HGVSc | HGVSp | HGVSp Short | SWISSPROT | BIOTYPE | SIFT | PolyPhen | Tumor Sample Barcode | Tissue | Histology | Sex | Age | Stage | Therapy Types | Drugs | Outcome |
| ZBTB2 | SNV | Missense_Mutation | c.764N>T | p.Ala255Val | p.A255V | Q8N680 | protein_coding | tolerated(0.98) | benign(0.07) | TCGA-A8-A06X-01 | Breast | breast invasive carcinoma | Female | >=65 | I/II | Unknown | Unknown | SD | |
| ZBTB2 | SNV | Missense_Mutation | c.233N>G | p.His78Arg | p.H78R | Q8N680 | protein_coding | deleterious(0) | possibly_damaging(0.503) | TCGA-AR-A1AW-01 | Breast | breast invasive carcinoma | Female | >=65 | I/II | Chemotherapy | docetaxel | SD | |
| ZBTB2 | SNV | Missense_Mutation | c.406C>G | p.Gln136Glu | p.Q136E | Q8N680 | protein_coding | deleterious(0) | possibly_damaging(0.622) | TCGA-BH-A0C0-01 | Breast | breast invasive carcinoma | Female | <65 | I/II | Chemotherapy | carboplatin | SD | |
| ZBTB2 | SNV | Missense_Mutation | c.239N>A | p.Met80Lys | p.M80K | Q8N680 | protein_coding | deleterious(0) | probably_damaging(0.977) | TCGA-D8-A1XZ-01 | Breast | breast invasive carcinoma | Female | >=65 | III/IV | Hormone Therapy | tamoxiphen+anastrozolum | SD | |
| ZBTB2 | SNV | Missense_Mutation | c.629N>G | p.Pro210Arg | p.P210R | Q8N680 | protein_coding | tolerated(0.58) | benign(0.044) | TCGA-D8-A27G-01 | Breast | breast invasive carcinoma | Female | >=65 | I/II | Unknown | Unknown | SD | |
| ZBTB2 | SNV | Missense_Mutation | c.28N>G | p.Leu10Val | p.L10V | Q8N680 | protein_coding | deleterious(0) | probably_damaging(0.981) | TCGA-EW-A1J5-01 | Breast | breast invasive carcinoma | Female | <65 | I/II | Chemotherapy | adriamycin | SD | |
| ZBTB2 | insertion | Frame_Shift_Ins | novel | c.823_824insCGAAGGGCGATCCATTCTCCTGGGC | p.Ile275ThrfsTer18 | p.I275Tfs*18 | Q8N680 | protein_coding | TCGA-BH-A0AW-01 | Breast | breast invasive carcinoma | Female | <65 | I/II | Chemotherapy | carboplatin | SD | ||
| ZBTB2 | SNV | Missense_Mutation | c.602N>T | p.Ser201Leu | p.S201L | Q8N680 | protein_coding | tolerated(0.22) | benign(0.144) | TCGA-EA-A439-01 | Cervix | cervical & endocervical cancer | Female | <65 | I/II | Unknown | Unknown | PD | |
| ZBTB2 | SNV | Missense_Mutation | rs762417728 | c.635C>T | p.Pro212Leu | p.P212L | Q8N680 | protein_coding | tolerated(0.33) | benign(0.025) | TCGA-DM-A1HB-01 | Colorectum | colon adenocarcinoma | Male | >=65 | III/IV | Unknown | Unknown | SD |
| ZBTB2 | SNV | Missense_Mutation | rs191541534 | c.340N>A | p.Ala114Thr | p.A114T | Q8N680 | protein_coding | tolerated(0.11) | benign(0.02) | TCGA-DM-A28H-01 | Colorectum | colon adenocarcinoma | Male | <65 | III/IV | Unknown | Unknown | PD |
| Page: 1 2 3 4 5 6 |
Top |
Related drugs of malignant transformation related genes |
| Identification of chemicals and drugs interact with genes involved in malignant transfromation |
| (DGIdb 4.0) |
| Entrez ID | Symbol | Category | Interaction Types | Drug Claim Name | Drug Name | PMIDs |
| Page: 1 |

Copyright 2023-Present -The University of Texas Health Science Center at Houston |