
|
|||||
|
 | |
| |
| |
| |
| |
| |
|
Gene: TBP |
Gene summary for TBP |
| Gene information | Species | Human | Gene symbol | TBP | Gene ID | 6908 |
| Gene name | TATA-box binding protein | |
| Gene Alias | GTF2D | |
| Cytomap | 6q27 | |
| Gene Type | protein-coding | GO ID | GO:0000003 | UniProtAcc | P20226 |
Top |
Malignant transformation analysis |
| Identification of the aberrant gene expression in precancerous and cancerous lesions by comparing the gene expression of stem-like cells in diseased tissues with normal stem cells |
| Entrez ID | Symbol | Replicates | Species | Organ | Tissue | Adj P-value | Log2FC | Malignancy |
| 6908 | TBP | LZE4T | Human | Esophagus | ESCC | 3.49e-05 | 2.16e-01 | 0.0811 |
| 6908 | TBP | LZE7T | Human | Esophagus | ESCC | 2.90e-07 | 4.81e-01 | 0.0667 |
| 6908 | TBP | LZE8T | Human | Esophagus | ESCC | 1.25e-07 | 2.29e-01 | 0.067 |
| 6908 | TBP | LZE22T | Human | Esophagus | ESCC | 2.13e-02 | 2.55e-01 | 0.068 |
| 6908 | TBP | LZE24T | Human | Esophagus | ESCC | 8.64e-20 | 4.70e-01 | 0.0596 |
| 6908 | TBP | LZE6T | Human | Esophagus | ESCC | 7.23e-04 | 1.94e-01 | 0.0845 |
| 6908 | TBP | P1T-E | Human | Esophagus | ESCC | 1.35e-03 | 2.34e-01 | 0.0875 |
| 6908 | TBP | P2T-E | Human | Esophagus | ESCC | 3.80e-22 | 3.37e-01 | 0.1177 |
| 6908 | TBP | P4T-E | Human | Esophagus | ESCC | 8.86e-24 | 4.98e-01 | 0.1323 |
| 6908 | TBP | P5T-E | Human | Esophagus | ESCC | 1.88e-18 | 3.62e-01 | 0.1327 |
| 6908 | TBP | P8T-E | Human | Esophagus | ESCC | 3.29e-19 | 2.92e-01 | 0.0889 |
| 6908 | TBP | P9T-E | Human | Esophagus | ESCC | 1.89e-09 | 1.70e-01 | 0.1131 |
| 6908 | TBP | P10T-E | Human | Esophagus | ESCC | 2.81e-24 | 3.88e-01 | 0.116 |
| 6908 | TBP | P11T-E | Human | Esophagus | ESCC | 2.33e-09 | 3.77e-01 | 0.1426 |
| 6908 | TBP | P12T-E | Human | Esophagus | ESCC | 7.43e-17 | 3.06e-01 | 0.1122 |
| 6908 | TBP | P15T-E | Human | Esophagus | ESCC | 2.05e-18 | 4.13e-01 | 0.1149 |
| 6908 | TBP | P16T-E | Human | Esophagus | ESCC | 9.44e-29 | 5.30e-01 | 0.1153 |
| 6908 | TBP | P17T-E | Human | Esophagus | ESCC | 5.80e-08 | 2.44e-01 | 0.1278 |
| 6908 | TBP | P19T-E | Human | Esophagus | ESCC | 2.04e-09 | 8.31e-01 | 0.1662 |
| 6908 | TBP | P20T-E | Human | Esophagus | ESCC | 4.59e-21 | 3.76e-01 | 0.1124 |
| Page: 1 2 3 4 |
| Tissue | Expression Dynamics | Abbreviation |
| Esophagus | 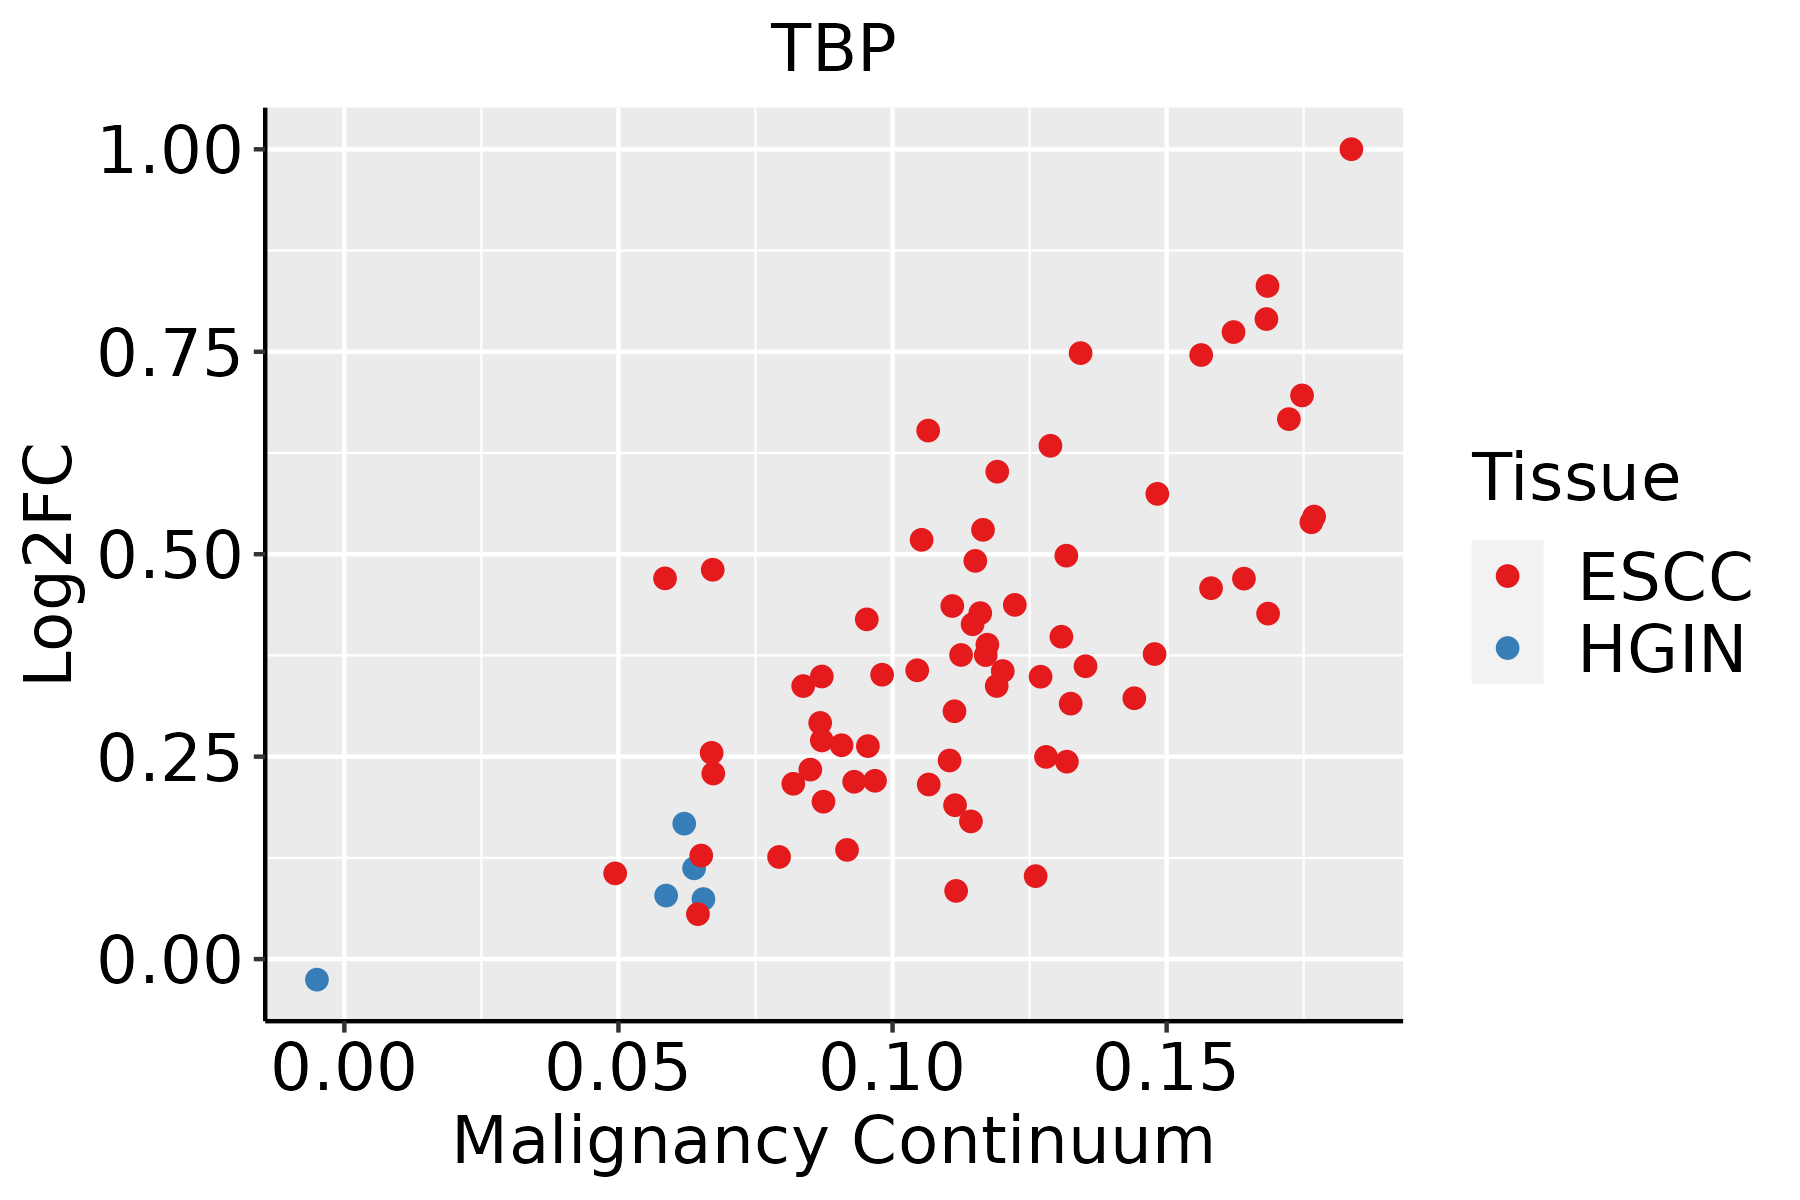 | ESCC: Esophageal squamous cell carcinoma |
| HGIN: High-grade intraepithelial neoplasias | ||
| LGIN: Low-grade intraepithelial neoplasias | ||
| Liver | 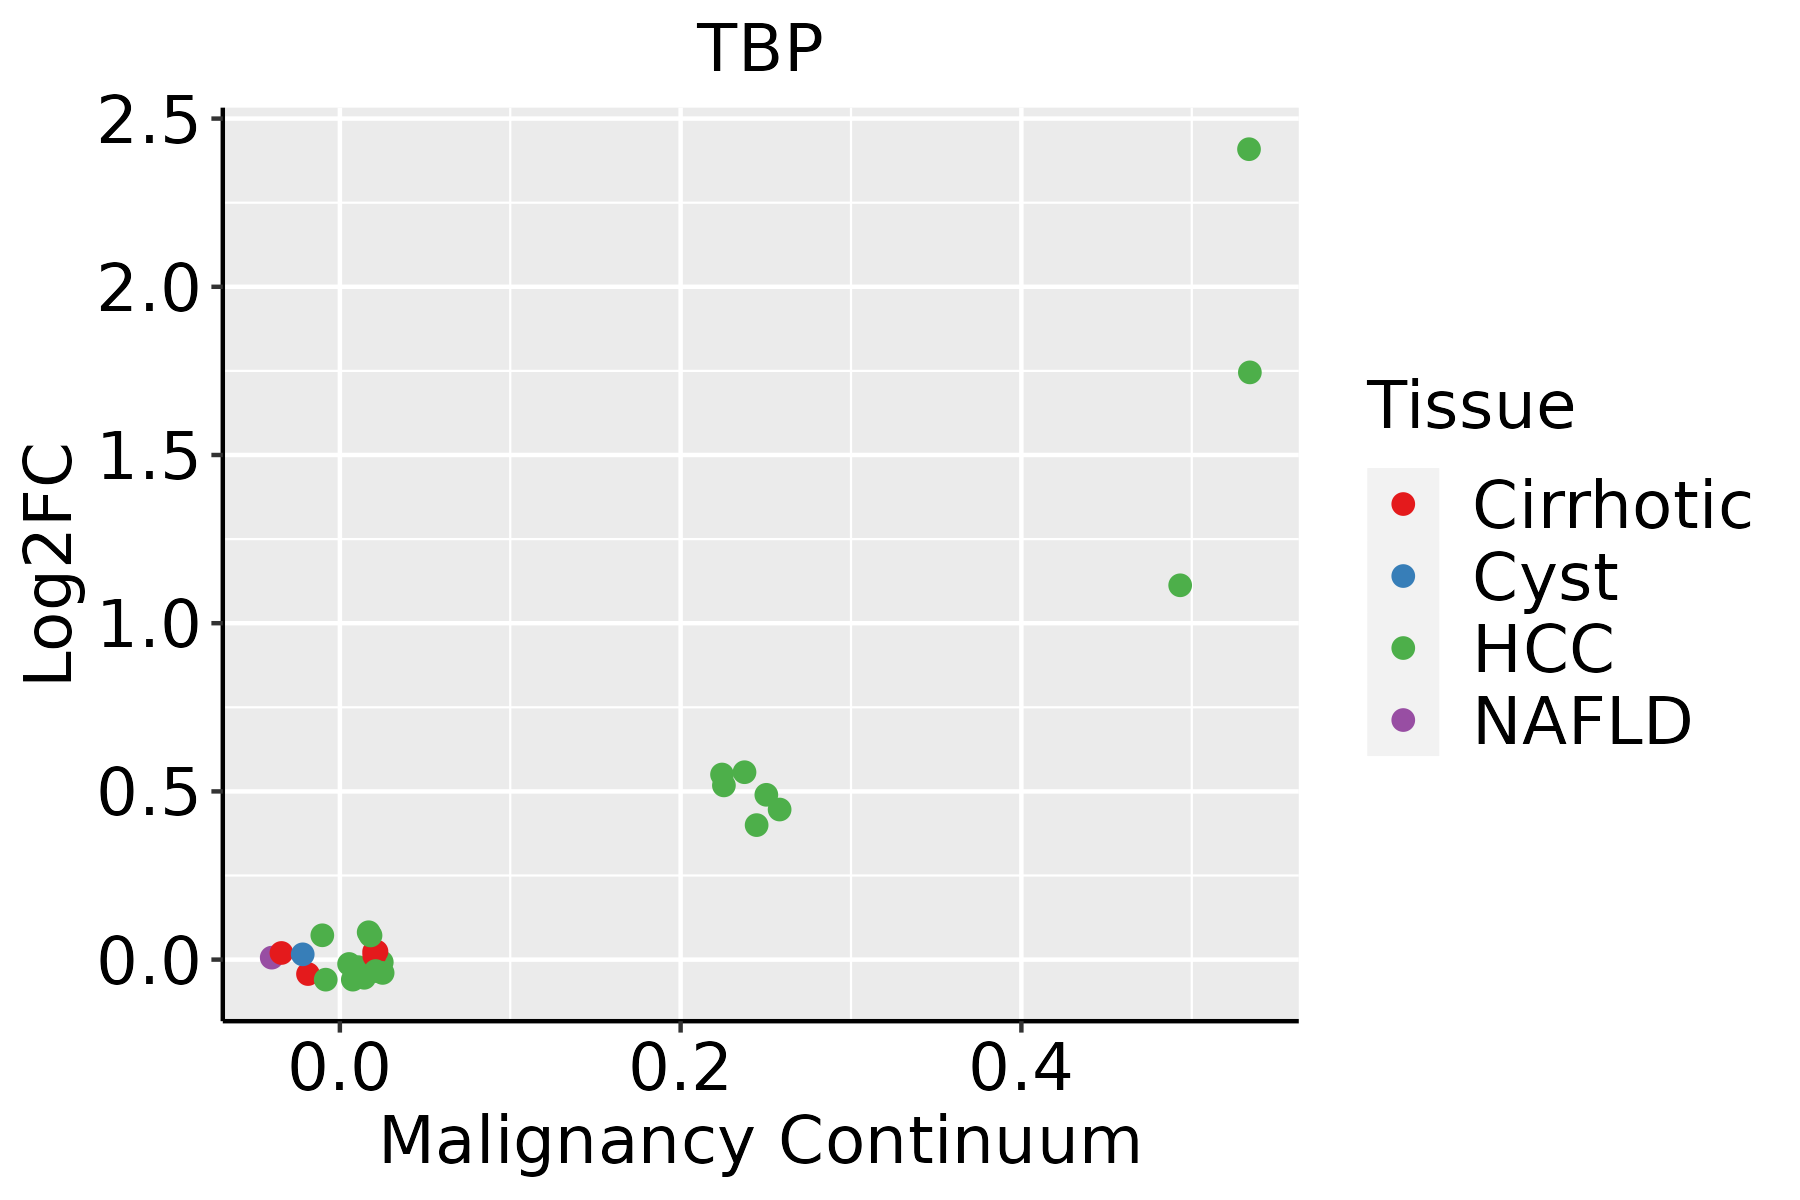 | HCC: Hepatocellular carcinoma |
| NAFLD: Non-alcoholic fatty liver disease |
| ∗log2FC in expression of this searched gene in stem-like cells from each diseased tissue sample relative to stem-like cells in normal samples in each tissue plotted against the malignancy continuum. Samples are colored based on if they are from different disease stage. |
Top |
Malignant transformation related pathway analysis |
| Find out the enriched GO biological processes and KEGG pathways involved in transition from healthy to precancer to cancer |
| Tissue | Disease Stage | Enriched GO biological Processes |
| Colorectum | AD |  |
| Colorectum | SER |  |
| Colorectum | MSS |  |
| Colorectum | MSI-H |  |
| Colorectum | FAP |  |
| ∗Top 15 enriched GO BP terms are showed in the bar plot of each disease state in each tissue. Each row represents a significant GO biological process which is colored according to the -log10(p.adjust). |
| Page: 1 2 3 4 5 6 7 8 9 |
| GO ID | Tissue | Disease Stage | Description | Gene Ratio | Bg Ratio | pvalue | p.adjust | Count |
| GO:20007564 | Esophagus | ESCC | regulation of peptidyl-lysine acetylation | 43/8552 | 63/18723 | 2.43e-04 | 1.50e-03 | 43 |
| GO:000717810 | Esophagus | ESCC | transmembrane receptor protein serine/threonine kinase signaling pathway | 195/8552 | 355/18723 | 2.58e-04 | 1.58e-03 | 195 |
| GO:004802517 | Esophagus | ESCC | negative regulation of mRNA splicing, via spliceosome | 17/8552 | 20/18723 | 3.43e-04 | 2.01e-03 | 17 |
| GO:000920012 | Esophagus | ESCC | deoxyribonucleoside triphosphate metabolic process | 15/8552 | 17/18723 | 3.48e-04 | 2.03e-03 | 15 |
| GO:00062203 | Esophagus | ESCC | pyrimidine nucleotide metabolic process | 35/8552 | 50/18723 | 4.33e-04 | 2.44e-03 | 35 |
| GO:199082316 | Esophagus | ESCC | response to leukemia inhibitory factor | 60/8552 | 95/18723 | 4.41e-04 | 2.48e-03 | 60 |
| GO:00091473 | Esophagus | ESCC | pyrimidine nucleoside triphosphate metabolic process | 20/8552 | 25/18723 | 4.81e-04 | 2.69e-03 | 20 |
| GO:00903122 | Esophagus | ESCC | positive regulation of protein deacetylation | 20/8552 | 25/18723 | 4.81e-04 | 2.69e-03 | 20 |
| GO:199083015 | Esophagus | ESCC | cellular response to leukemia inhibitory factor | 59/8552 | 94/18723 | 6.19e-04 | 3.32e-03 | 59 |
| GO:200073614 | Esophagus | ESCC | regulation of stem cell differentiation | 39/8552 | 58/18723 | 7.43e-04 | 3.86e-03 | 39 |
| GO:000926212 | Esophagus | ESCC | deoxyribonucleotide metabolic process | 31/8552 | 44/18723 | 7.70e-04 | 3.99e-03 | 31 |
| GO:000038119 | Esophagus | ESCC | regulation of alternative mRNA splicing, via spliceosome | 40/8552 | 60/18723 | 8.30e-04 | 4.28e-03 | 40 |
| GO:00725273 | Esophagus | ESCC | pyrimidine-containing compound metabolic process | 52/8552 | 82/18723 | 9.03e-04 | 4.61e-03 | 52 |
| GO:19019835 | Esophagus | ESCC | regulation of protein acetylation | 49/8552 | 77/18723 | 1.12e-03 | 5.60e-03 | 49 |
| GO:00092633 | Esophagus | ESCC | deoxyribonucleotide biosynthetic process | 13/8552 | 15/18723 | 1.31e-03 | 6.26e-03 | 13 |
| GO:00353074 | Esophagus | ESCC | positive regulation of protein dephosphorylation | 31/8552 | 45/18723 | 1.40e-03 | 6.62e-03 | 31 |
| GO:00350653 | Esophagus | ESCC | regulation of histone acetylation | 36/8552 | 54/18723 | 1.49e-03 | 7.06e-03 | 36 |
| GO:00603485 | Esophagus | ESCC | bone development | 115/8552 | 205/18723 | 1.67e-03 | 7.72e-03 | 115 |
| GO:001969212 | Esophagus | ESCC | deoxyribose phosphate metabolic process | 29/8552 | 42/18723 | 1.87e-03 | 8.46e-03 | 29 |
| GO:00170156 | Esophagus | ESCC | regulation of transforming growth factor beta receptor signaling pathway | 75/8552 | 128/18723 | 2.19e-03 | 9.71e-03 | 75 |
| Page: 1 2 3 4 5 6 7 8 9 10 11 12 13 14 15 16 17 18 19 20 21 22 23 24 25 26 27 28 29 30 31 32 33 34 35 36 37 38 39 40 41 42 43 44 45 46 47 48 49 50 51 52 53 54 55 56 57 58 59 60 61 62 63 64 65 66 67 68 69 70 71 72 73 74 |
| Pathway ID | Tissue | Disease Stage | Description | Gene Ratio | Bg Ratio | pvalue | p.adjust | qvalue | Count |
| hsa05016210 | Esophagus | ESCC | Huntington disease | 226/4205 | 306/8465 | 1.38e-18 | 8.72e-17 | 4.46e-17 | 226 |
| hsa05166211 | Esophagus | ESCC | Human T-cell leukemia virus 1 infection | 164/4205 | 222/8465 | 8.13e-14 | 2.09e-12 | 1.07e-12 | 164 |
| hsa0516510 | Esophagus | ESCC | Human papillomavirus infection | 215/4205 | 331/8465 | 7.86e-09 | 7.12e-08 | 3.65e-08 | 215 |
| hsa0520325 | Esophagus | ESCC | Viral carcinogenesis | 137/4205 | 204/8465 | 2.47e-07 | 1.88e-06 | 9.62e-07 | 137 |
| hsa0501728 | Esophagus | ESCC | Spinocerebellar ataxia | 94/4205 | 143/8465 | 6.77e-05 | 2.90e-04 | 1.48e-04 | 94 |
| hsa030222 | Esophagus | ESCC | Basal transcription factors | 35/4205 | 45/8465 | 1.01e-04 | 4.06e-04 | 2.08e-04 | 35 |
| hsa0501638 | Esophagus | ESCC | Huntington disease | 226/4205 | 306/8465 | 1.38e-18 | 8.72e-17 | 4.46e-17 | 226 |
| hsa05166310 | Esophagus | ESCC | Human T-cell leukemia virus 1 infection | 164/4205 | 222/8465 | 8.13e-14 | 2.09e-12 | 1.07e-12 | 164 |
| hsa0516515 | Esophagus | ESCC | Human papillomavirus infection | 215/4205 | 331/8465 | 7.86e-09 | 7.12e-08 | 3.65e-08 | 215 |
| hsa0520335 | Esophagus | ESCC | Viral carcinogenesis | 137/4205 | 204/8465 | 2.47e-07 | 1.88e-06 | 9.62e-07 | 137 |
| hsa0501736 | Esophagus | ESCC | Spinocerebellar ataxia | 94/4205 | 143/8465 | 6.77e-05 | 2.90e-04 | 1.48e-04 | 94 |
| hsa0302211 | Esophagus | ESCC | Basal transcription factors | 35/4205 | 45/8465 | 1.01e-04 | 4.06e-04 | 2.08e-04 | 35 |
| hsa0501622 | Liver | HCC | Huntington disease | 219/4020 | 306/8465 | 3.06e-18 | 3.42e-16 | 1.90e-16 | 219 |
| hsa0516622 | Liver | HCC | Human T-cell leukemia virus 1 infection | 139/4020 | 222/8465 | 3.17e-06 | 2.79e-05 | 1.55e-05 | 139 |
| hsa0501721 | Liver | HCC | Spinocerebellar ataxia | 92/4020 | 143/8465 | 3.20e-05 | 1.88e-04 | 1.04e-04 | 92 |
| hsa051652 | Liver | HCC | Human papillomavirus infection | 188/4020 | 331/8465 | 3.34e-04 | 1.49e-03 | 8.29e-04 | 188 |
| hsa052032 | Liver | HCC | Viral carcinogenesis | 117/4020 | 204/8465 | 2.68e-03 | 8.98e-03 | 5.00e-03 | 117 |
| hsa0501632 | Liver | HCC | Huntington disease | 219/4020 | 306/8465 | 3.06e-18 | 3.42e-16 | 1.90e-16 | 219 |
| hsa0516632 | Liver | HCC | Human T-cell leukemia virus 1 infection | 139/4020 | 222/8465 | 3.17e-06 | 2.79e-05 | 1.55e-05 | 139 |
| hsa0501731 | Liver | HCC | Spinocerebellar ataxia | 92/4020 | 143/8465 | 3.20e-05 | 1.88e-04 | 1.04e-04 | 92 |
| Page: 1 2 |
Top |
Cell-cell communication analysis |
| Identification of potential cell-cell interactions between two cell types and their ligand-receptor pairs for different disease states |
| Ligand | Receptor | LRpair | Pathway | Tissue | Disease Stage |
| Page: 1 |
Top |
Single-cell gene regulatory network inference analysis |
| Find out the significant the regulons (TFs) and the target genes of each regulon across cell types for different disease states |
| TF | Cell Type | Tissue | Disease Stage | Target Gene | RSS | Regulon Activity |
| TBP | NK | Breast | DCIS | AGMAT,FBRSL1,MCM2, etc. | 9.96e-02 |  |
| TBP | PLA | Breast | DCIS | AGMAT,FBRSL1,MCM2, etc. | 1.38e-01 | |
| TBP | BMEM | Breast | DCIS | AGMAT,FBRSL1,MCM2, etc. | 1.06e-01 | |
| TBP | BAS | Cervix | N_HPV | PLCXD1,EN1,PIWIL1, etc. | 2.36e-01 |  |
| TBP | MON | Colorectum | MSI-H | CORO2A,CPD,NKIRAS2, etc. | 5.04e-01 |  |
| TBP | END | Colorectum | ADJ | TAB1,TRNT1,C2, etc. | 2.78e-01 |  |
| TBP | END | Colorectum | CRC | TAB1,TRNT1,C2, etc. | 3.63e-01 |  |
| TBP | END | Colorectum | Healthy | TAB1,TRNT1,C2, etc. | 1.98e-01 |  |
| TBP | END | Colorectum | MSI-H | TAB1,TRNT1,C2, etc. | 5.65e-01 | |
| TBP | CD8TEFF | Endometrium | ADJ | TBX21,SCYL3,ZNF737, etc. | 2.06e-02 |  |
| ∗The dot plots of a searched regulon are shown for all cell subpopulations in each disease state of each tissue based on the regulon specific score inferred using pySCENIC and by calculating the average expression. |
| Page: 1 2 3 |
Top |
Somatic mutation of malignant transformation related genes |
| Annotation of somatic variants for genes involved in malignant transformation |
| Hugo Symbol | Variant Class | Variant Classification | dbSNP RS | HGVSc | HGVSp | HGVSp Short | SWISSPROT | BIOTYPE | SIFT | PolyPhen | Tumor Sample Barcode | Tissue | Histology | Sex | Age | Stage | Therapy Types | Drugs | Outcome |
| TBP | SNV | Missense_Mutation | novel | c.101A>G | p.Tyr34Cys | p.Y34C | P20226 | protein_coding | deleterious_low_confidence(0.03) | probably_damaging(0.993) | TCGA-3C-AALI-01 | Breast | breast invasive carcinoma | Female | <65 | I/II | Unspecific | Poly E | Complete Response |
| TBP | SNV | Missense_Mutation | c.392C>G | p.Pro131Arg | p.P131R | P20226 | protein_coding | deleterious(0.01) | benign(0.296) | TCGA-AN-A0FK-01 | Breast | breast invasive carcinoma | Female | >=65 | III/IV | Unknown | Unknown | SD | |
| TBP | SNV | Missense_Mutation | c.713C>A | p.Ala238Asp | p.A238D | P20226 | protein_coding | deleterious(0) | probably_damaging(0.999) | TCGA-AN-A0FL-01 | Breast | breast invasive carcinoma | Female | <65 | I/II | Unknown | Unknown | SD | |
| TBP | SNV | Missense_Mutation | novel | c.940N>A | p.Gly314Ser | p.G314S | P20226 | protein_coding | deleterious(0.01) | probably_damaging(0.997) | TCGA-BH-A0HW-01 | Breast | breast invasive carcinoma | Female | <65 | I/II | Chemotherapy | doxorubicin | SD |
| TBP | SNV | Missense_Mutation | novel | c.821T>C | p.Val274Ala | p.V274A | P20226 | protein_coding | tolerated(0.43) | probably_damaging(0.996) | TCGA-2W-A8YY-01 | Cervix | cervical & endocervical cancer | Female | <65 | I/II | Chemotherapy | cisplatin | CR |
| TBP | SNV | Missense_Mutation | c.722N>C | p.Val241Ala | p.V241A | P20226 | protein_coding | deleterious(0) | probably_damaging(0.996) | TCGA-AA-3710-01 | Colorectum | colon adenocarcinoma | Female | >=65 | I/II | Unknown | Unknown | SD | |
| TBP | SNV | Missense_Mutation | c.671C>T | p.Ala224Val | p.A224V | P20226 | protein_coding | deleterious(0.01) | probably_damaging(0.984) | TCGA-D5-6931-01 | Colorectum | colon adenocarcinoma | Male | >=65 | III/IV | Unknown | Unknown | SD | |
| TBP | SNV | Missense_Mutation | novel | c.70N>C | p.Gly24Arg | p.G24R | P20226 | protein_coding | tolerated_low_confidence(0.29) | benign(0.123) | TCGA-AG-A01J-01 | Colorectum | rectum adenocarcinoma | Female | <65 | I/II | Unknown | Unknown | SD |
| TBP | insertion | Frame_Shift_Ins | novel | c.864_865insC | p.Gly290TrpfsTer27 | p.G290Wfs*27 | P20226 | protein_coding | TCGA-AG-3892-01 | Colorectum | rectum adenocarcinoma | Female | <65 | I/II | Unknown | Unknown | SD | ||
| TBP | SNV | Missense_Mutation | rs756227958 | c.556N>T | p.Arg186Cys | p.R186C | P20226 | protein_coding | deleterious(0) | probably_damaging(0.945) | TCGA-A5-A1OF-01 | Endometrium | uterine corpus endometrioid carcinoma | Female | <65 | I/II | Unknown | Unknown | SD |
| Page: 1 2 3 |
Top |
Related drugs of malignant transformation related genes |
| Identification of chemicals and drugs interact with genes involved in malignant transfromation |
| (DGIdb 4.0) |
| Entrez ID | Symbol | Category | Interaction Types | Drug Claim Name | Drug Name | PMIDs |
| 6908 | TBP | TRANSCRIPTION FACTOR | HORMONES | 7848271 | ||
| 6908 | TBP | TRANSCRIPTION FACTOR | RETINOIC ACID | 8413615 | ||
| 6908 | TBP | TRANSCRIPTION FACTOR | VP-16 | ETOPOSIDE PHOSPHATE | 1646402 |
| Page: 1 |

Copyright 2023-Present -The University of Texas Health Science Center at Houston |