
|
|||||
|
 | |
| |
| |
| |
| |
| |
|
Gene: SLC4A4 |
Gene summary for SLC4A4 |
| Gene information | Species | Human | Gene symbol | SLC4A4 | Gene ID | 8671 |
| Gene name | solute carrier family 4 member 4 | |
| Gene Alias | HNBC1 | |
| Cytomap | 4q13.3 | |
| Gene Type | protein-coding | GO ID | GO:0003008 | UniProtAcc | A0A024RD97 |
Top |
Malignant transformation analysis |
| Identification of the aberrant gene expression in precancerous and cancerous lesions by comparing the gene expression of stem-like cells in diseased tissues with normal stem cells |
| Entrez ID | Symbol | Replicates | Species | Organ | Tissue | Adj P-value | Log2FC | Malignancy |
| 8671 | SLC4A4 | HTA11_3410_2000001011 | Human | Colorectum | AD | 6.13e-42 | -1.03e+00 | 0.0155 |
| 8671 | SLC4A4 | HTA11_2951_2000001011 | Human | Colorectum | AD | 2.89e-07 | -1.03e+00 | 0.0216 |
| 8671 | SLC4A4 | HTA11_1938_2000001011 | Human | Colorectum | AD | 1.21e-09 | -7.14e-01 | -0.0811 |
| 8671 | SLC4A4 | HTA11_78_2000001011 | Human | Colorectum | AD | 3.83e-02 | -2.11e-01 | -0.1088 |
| 8671 | SLC4A4 | HTA11_347_2000001011 | Human | Colorectum | AD | 3.32e-15 | 1.02e+00 | -0.1954 |
| 8671 | SLC4A4 | HTA11_411_2000001011 | Human | Colorectum | SER | 5.72e-03 | 5.50e-01 | -0.2602 |
| 8671 | SLC4A4 | HTA11_3361_2000001011 | Human | Colorectum | AD | 6.29e-04 | -5.82e-01 | -0.1207 |
| 8671 | SLC4A4 | HTA11_696_2000001011 | Human | Colorectum | AD | 7.53e-04 | 1.98e-01 | -0.1464 |
| 8671 | SLC4A4 | HTA11_1391_2000001011 | Human | Colorectum | AD | 3.39e-11 | -6.38e-01 | -0.059 |
| 8671 | SLC4A4 | HTA11_5212_2000001011 | Human | Colorectum | AD | 6.52e-03 | 3.91e-01 | -0.2061 |
| 8671 | SLC4A4 | HTA11_866_3004761011 | Human | Colorectum | AD | 1.21e-44 | -1.13e+00 | 0.096 |
| 8671 | SLC4A4 | HTA11_4255_2000001011 | Human | Colorectum | SER | 2.35e-04 | -7.62e-01 | 0.0446 |
| 8671 | SLC4A4 | HTA11_9408_2000001011 | Human | Colorectum | AD | 1.55e-07 | -1.19e+00 | 0.0451 |
| 8671 | SLC4A4 | HTA11_8622_2000001021 | Human | Colorectum | SER | 1.28e-08 | -9.31e-01 | 0.0528 |
| 8671 | SLC4A4 | HTA11_10623_2000001011 | Human | Colorectum | AD | 1.46e-05 | -6.13e-01 | -0.0177 |
| 8671 | SLC4A4 | HTA11_10711_2000001011 | Human | Colorectum | AD | 1.66e-23 | -1.05e+00 | 0.0338 |
| 8671 | SLC4A4 | HTA11_7696_3000711011 | Human | Colorectum | AD | 1.10e-51 | -1.13e+00 | 0.0674 |
| 8671 | SLC4A4 | HTA11_6818_2000001011 | Human | Colorectum | AD | 2.26e-12 | -8.35e-01 | 0.0112 |
| 8671 | SLC4A4 | HTA11_11156_2000001011 | Human | Colorectum | AD | 1.41e-02 | -8.87e-01 | 0.0397 |
| 8671 | SLC4A4 | HTA11_6818_2000001021 | Human | Colorectum | AD | 5.09e-21 | -1.03e+00 | 0.0588 |
| Page: 1 2 3 4 5 6 7 |
| Tissue | Expression Dynamics | Abbreviation |
| Colorectum (GSE201348) |  | FAP: Familial adenomatous polyposis |
| CRC: Colorectal cancer | ||
| Colorectum (HTA11) |  | AD: Adenomas |
| SER: Sessile serrated lesions | ||
| MSI-H: Microsatellite-high colorectal cancer | ||
| MSS: Microsatellite stable colorectal cancer | ||
| GC | 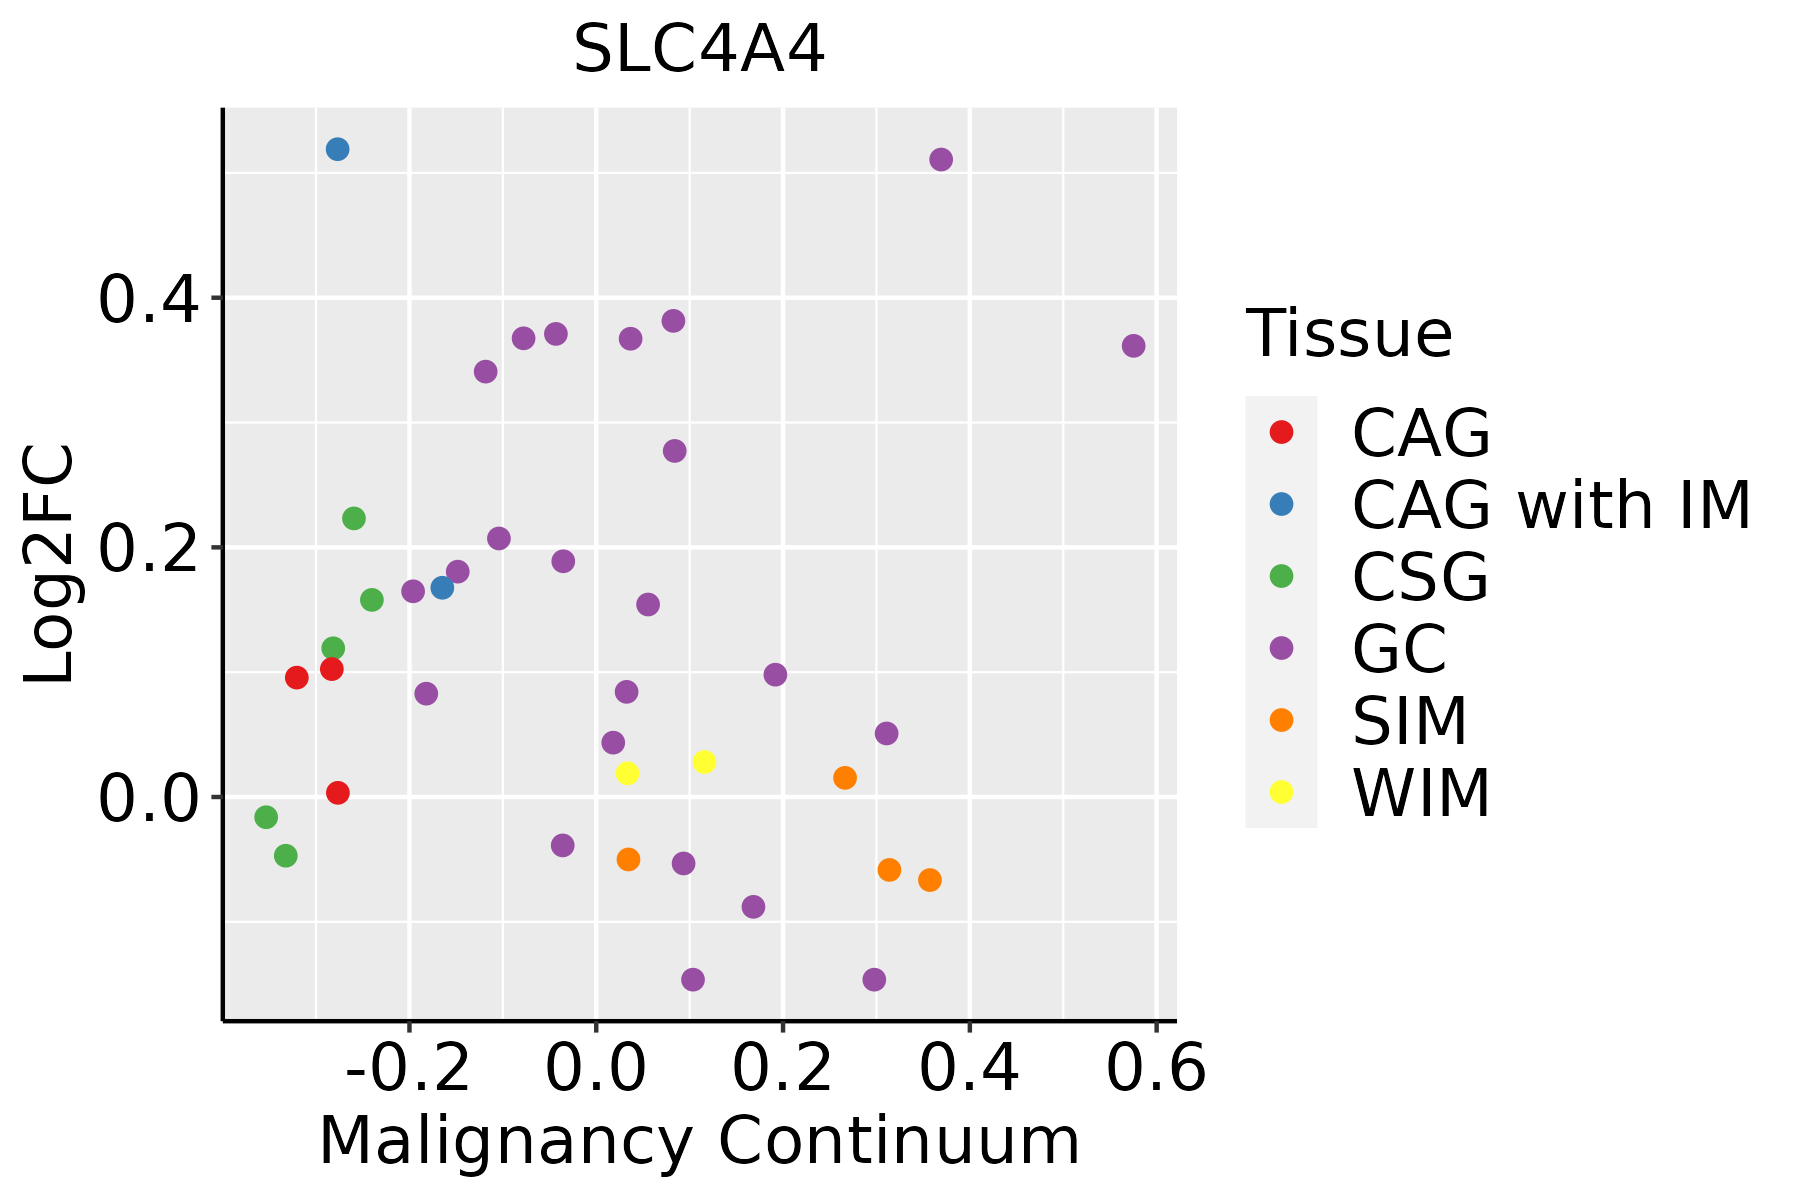 | CAG: Chronic atrophic gastritis |
| CAG with IM: Chronic atrophic gastritis with intestinal metaplasia | ||
| CSG: Chronic superficial gastritis | ||
| GC: Gastric cancer | ||
| SIM: Severe intestinal metaplasia | ||
| WIM: Wild intestinal metaplasia | ||
| Liver |  | HCC: Hepatocellular carcinoma |
| NAFLD: Non-alcoholic fatty liver disease | ||
| Lung | 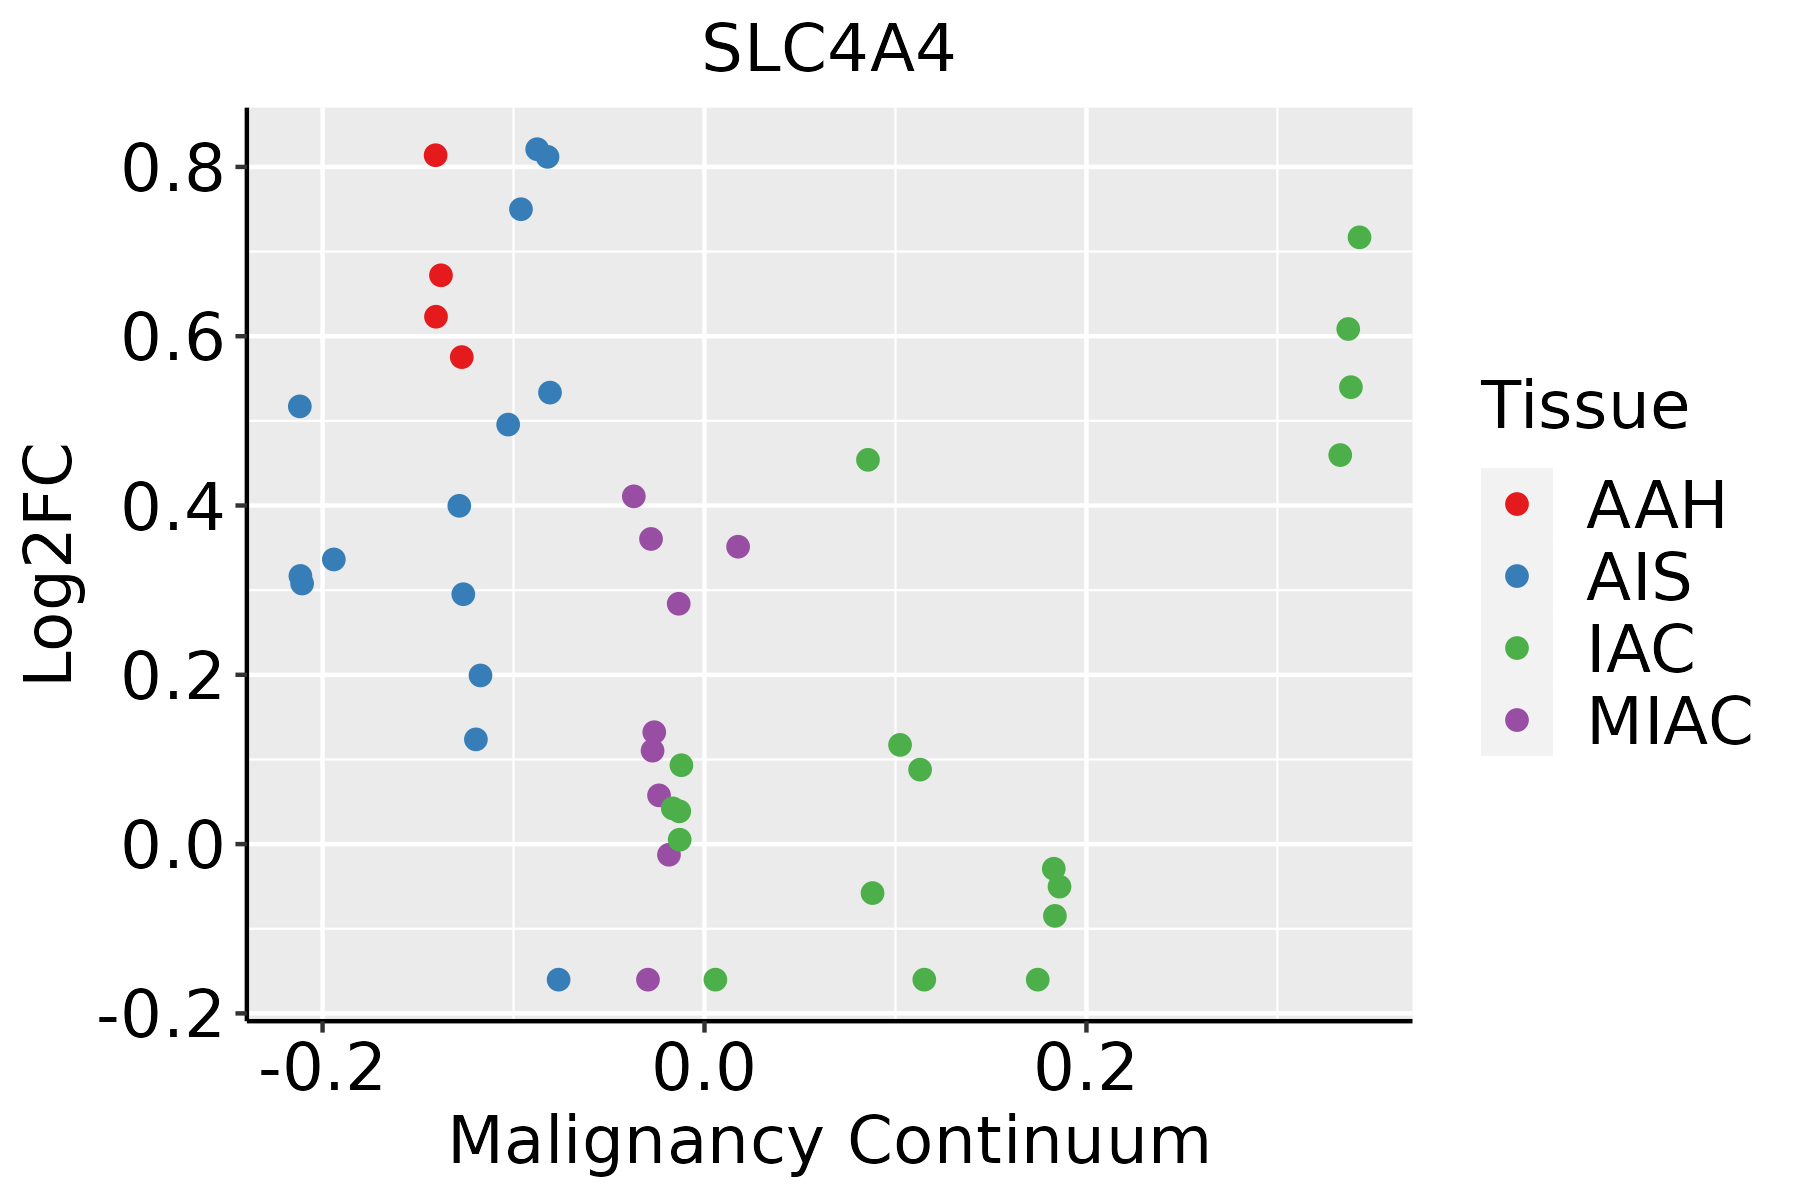 | AAH: Atypical adenomatous hyperplasia |
| AIS: Adenocarcinoma in situ | ||
| IAC: Invasive lung adenocarcinoma | ||
| MIA: Minimally invasive adenocarcinoma | ||
| Prostate | 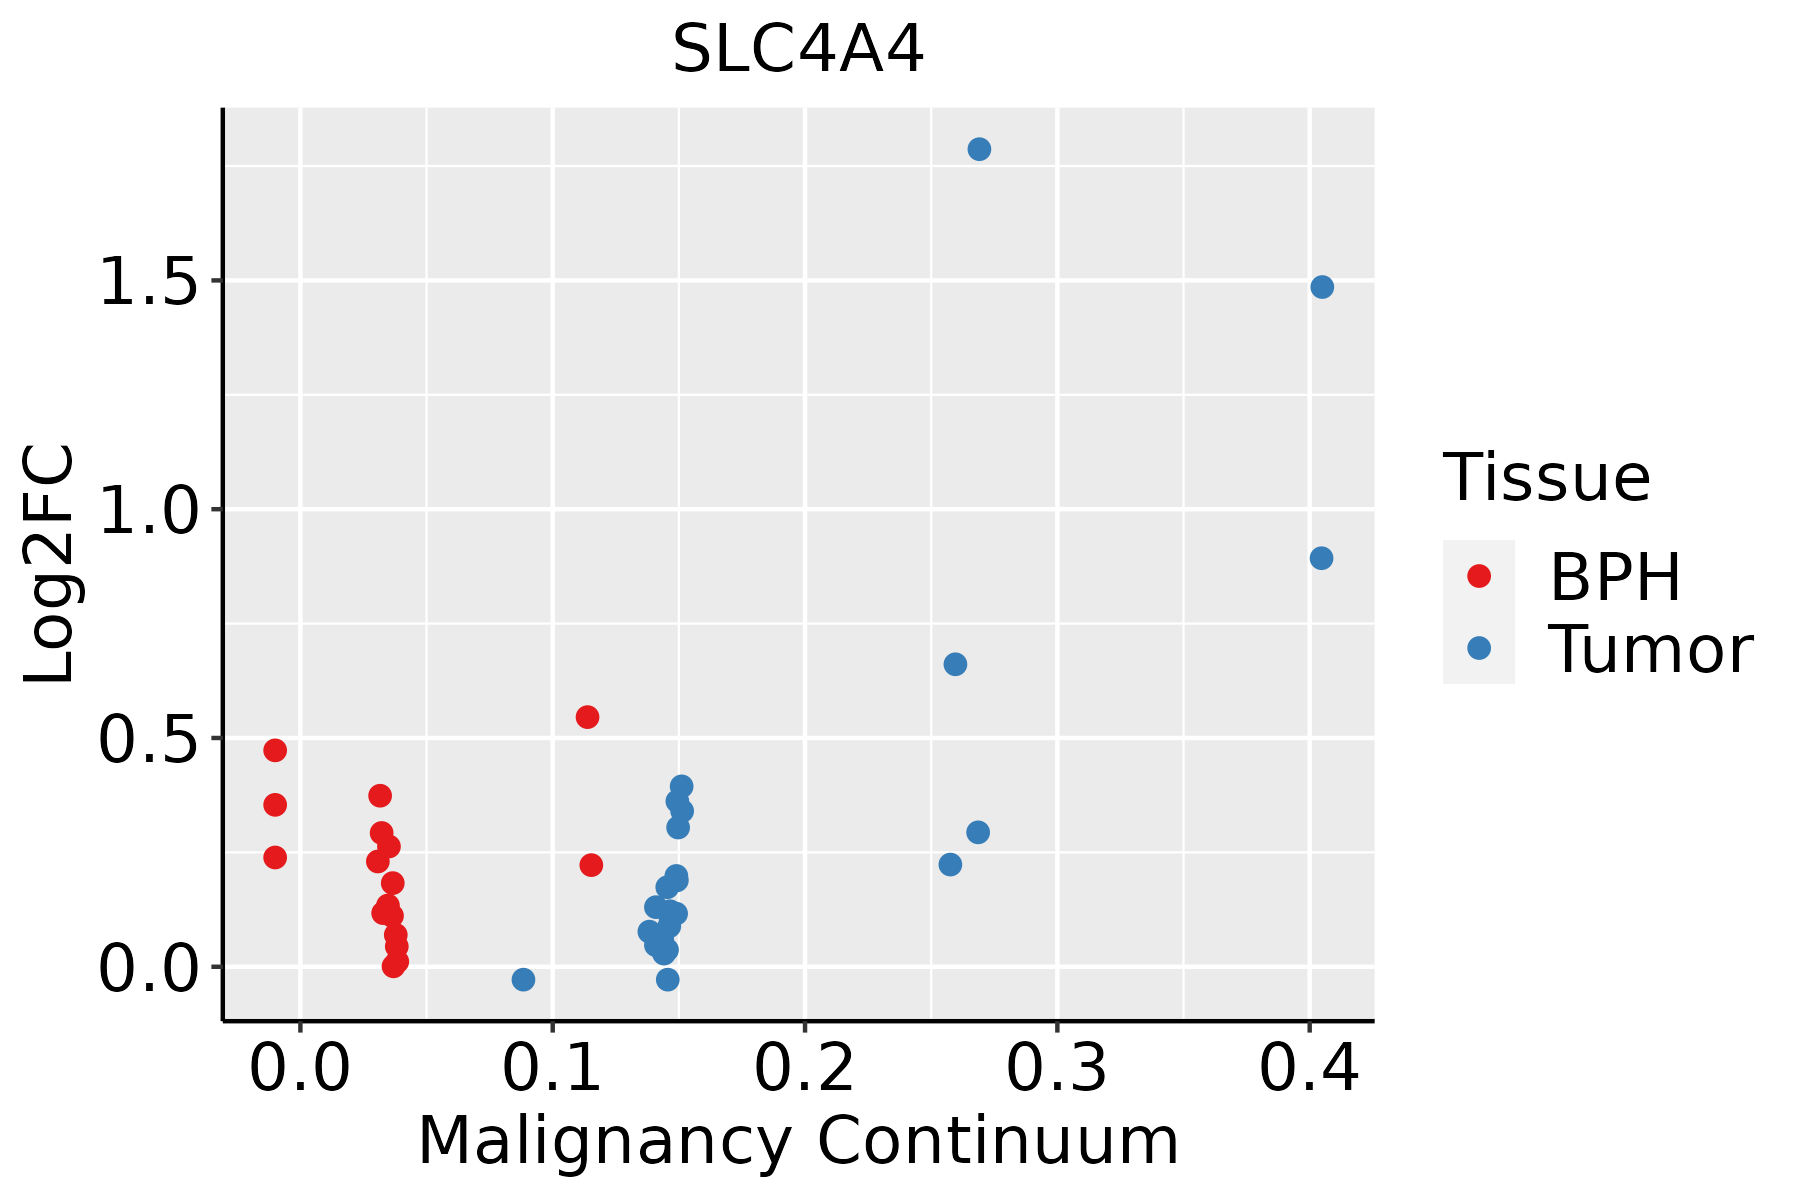 | BPH: Benign Prostatic Hyperplasia |
| Thyroid |  | ATC: Anaplastic thyroid cancer |
| HT: Hashimoto's thyroiditis | ||
| PTC: Papillary thyroid cancer |
| ∗log2FC in expression of this searched gene in stem-like cells from each diseased tissue sample relative to stem-like cells in normal samples in each tissue plotted against the malignancy continuum. Samples are colored based on if they are from different disease stage. |
Top |
Malignant transformation related pathway analysis |
| Find out the enriched GO biological processes and KEGG pathways involved in transition from healthy to precancer to cancer |
| Tissue | Disease Stage | Enriched GO biological Processes |
| Colorectum | AD |  |
| Colorectum | SER |  |
| Colorectum | MSS |  |
| Colorectum | MSI-H |  |
| Colorectum | FAP |  |
| ∗Top 15 enriched GO BP terms are showed in the bar plot of each disease state in each tissue. Each row represents a significant GO biological process which is colored according to the -log10(p.adjust). |
| Page: 1 2 3 4 5 6 7 8 9 |
| GO ID | Tissue | Disease Stage | Description | Gene Ratio | Bg Ratio | pvalue | p.adjust | Count |
| GO:004693925 | Thyroid | HT | nucleotide phosphorylation | 14/1272 | 101/18723 | 8.27e-03 | 4.78e-02 | 14 |
| GO:001605217 | Thyroid | HT | carbohydrate catabolic process | 19/1272 | 154/18723 | 8.39e-03 | 4.79e-02 | 19 |
| GO:0009896113 | Thyroid | PTC | positive regulation of catabolic process | 278/5968 | 492/18723 | 3.35e-30 | 2.64e-27 | 278 |
| GO:0031331113 | Thyroid | PTC | positive regulation of cellular catabolic process | 249/5968 | 427/18723 | 5.28e-30 | 3.58e-27 | 249 |
| GO:0046034113 | Thyroid | PTC | ATP metabolic process | 167/5968 | 277/18723 | 1.18e-22 | 2.66e-20 | 167 |
| GO:0006091112 | Thyroid | PTC | generation of precursor metabolites and energy | 252/5968 | 490/18723 | 8.24e-20 | 1.13e-17 | 252 |
| GO:001969327 | Thyroid | PTC | ribose phosphate metabolic process | 176/5968 | 396/18723 | 8.28e-08 | 1.70e-06 | 176 |
| GO:000915028 | Thyroid | PTC | purine ribonucleotide metabolic process | 165/5968 | 368/18723 | 1.03e-07 | 2.05e-06 | 165 |
| GO:007252127 | Thyroid | PTC | purine-containing compound metabolic process | 182/5968 | 416/18723 | 1.92e-07 | 3.51e-06 | 182 |
| GO:000925927 | Thyroid | PTC | ribonucleotide metabolic process | 170/5968 | 385/18723 | 2.32e-07 | 4.08e-06 | 170 |
| GO:0043467110 | Thyroid | PTC | regulation of generation of precursor metabolites and energy | 68/5968 | 130/18723 | 1.03e-06 | 1.52e-05 | 68 |
| GO:000616327 | Thyroid | PTC | purine nucleotide metabolic process | 170/5968 | 396/18723 | 2.02e-06 | 2.75e-05 | 170 |
| GO:000918526 | Thyroid | PTC | ribonucleoside diphosphate metabolic process | 57/5968 | 106/18723 | 2.40e-06 | 3.17e-05 | 57 |
| GO:000913225 | Thyroid | PTC | nucleoside diphosphate metabolic process | 64/5968 | 124/18723 | 3.80e-06 | 4.78e-05 | 64 |
| GO:000913526 | Thyroid | PTC | purine nucleoside diphosphate metabolic process | 55/5968 | 103/18723 | 4.75e-06 | 5.79e-05 | 55 |
| GO:000917926 | Thyroid | PTC | purine ribonucleoside diphosphate metabolic process | 55/5968 | 103/18723 | 4.75e-06 | 5.79e-05 | 55 |
| GO:000675325 | Thyroid | PTC | nucleoside phosphate metabolic process | 205/5968 | 497/18723 | 5.24e-06 | 6.35e-05 | 205 |
| GO:000911725 | Thyroid | PTC | nucleotide metabolic process | 202/5968 | 489/18723 | 5.46e-06 | 6.60e-05 | 202 |
| GO:0046031110 | Thyroid | PTC | ADP metabolic process | 49/5968 | 90/18723 | 7.58e-06 | 8.77e-05 | 49 |
| GO:0046939110 | Thyroid | PTC | nucleotide phosphorylation | 52/5968 | 101/18723 | 3.25e-05 | 3.08e-04 | 52 |
| Page: 1 2 3 4 5 6 7 8 9 10 11 12 13 14 15 16 17 18 19 20 21 22 23 24 25 26 |
| Pathway ID | Tissue | Disease Stage | Description | Gene Ratio | Bg Ratio | pvalue | p.adjust | qvalue | Count |
| hsa04972 | Colorectum | AD | Pancreatic secretion | 36/2092 | 102/8465 | 1.06e-02 | 3.98e-02 | 2.54e-02 | 36 |
| hsa04964 | Colorectum | AD | Proximal tubule bicarbonate reclamation | 11/2092 | 23/8465 | 1.35e-02 | 4.86e-02 | 3.10e-02 | 11 |
| hsa049721 | Colorectum | AD | Pancreatic secretion | 36/2092 | 102/8465 | 1.06e-02 | 3.98e-02 | 2.54e-02 | 36 |
| hsa049641 | Colorectum | AD | Proximal tubule bicarbonate reclamation | 11/2092 | 23/8465 | 1.35e-02 | 4.86e-02 | 3.10e-02 | 11 |
| hsa049642 | Colorectum | SER | Proximal tubule bicarbonate reclamation | 10/1580 | 23/8465 | 5.33e-03 | 3.28e-02 | 2.38e-02 | 10 |
| hsa049722 | Colorectum | SER | Pancreatic secretion | 30/1580 | 102/8465 | 5.41e-03 | 3.28e-02 | 2.38e-02 | 30 |
| hsa049643 | Colorectum | SER | Proximal tubule bicarbonate reclamation | 10/1580 | 23/8465 | 5.33e-03 | 3.28e-02 | 2.38e-02 | 10 |
| hsa049723 | Colorectum | SER | Pancreatic secretion | 30/1580 | 102/8465 | 5.41e-03 | 3.28e-02 | 2.38e-02 | 30 |
| hsa049724 | Colorectum | MSS | Pancreatic secretion | 33/1875 | 102/8465 | 1.09e-02 | 3.75e-02 | 2.30e-02 | 33 |
| hsa049725 | Colorectum | MSS | Pancreatic secretion | 33/1875 | 102/8465 | 1.09e-02 | 3.75e-02 | 2.30e-02 | 33 |
| hsa049726 | Colorectum | FAP | Pancreatic secretion | 34/1404 | 102/8465 | 2.43e-05 | 2.78e-04 | 1.69e-04 | 34 |
| hsa04976 | Colorectum | FAP | Bile secretion | 24/1404 | 89/8465 | 8.76e-03 | 3.21e-02 | 1.96e-02 | 24 |
| hsa049727 | Colorectum | FAP | Pancreatic secretion | 34/1404 | 102/8465 | 2.43e-05 | 2.78e-04 | 1.69e-04 | 34 |
| hsa049761 | Colorectum | FAP | Bile secretion | 24/1404 | 89/8465 | 8.76e-03 | 3.21e-02 | 1.96e-02 | 24 |
| hsa049728 | Colorectum | CRC | Pancreatic secretion | 32/1091 | 102/8465 | 7.86e-07 | 4.37e-05 | 2.96e-05 | 32 |
| hsa049644 | Colorectum | CRC | Proximal tubule bicarbonate reclamation | 8/1091 | 23/8465 | 6.09e-03 | 3.04e-02 | 2.06e-02 | 8 |
| hsa049729 | Colorectum | CRC | Pancreatic secretion | 32/1091 | 102/8465 | 7.86e-07 | 4.37e-05 | 2.96e-05 | 32 |
| hsa049645 | Colorectum | CRC | Proximal tubule bicarbonate reclamation | 8/1091 | 23/8465 | 6.09e-03 | 3.04e-02 | 2.06e-02 | 8 |
| Page: 1 |
Top |
Cell-cell communication analysis |
| Identification of potential cell-cell interactions between two cell types and their ligand-receptor pairs for different disease states |
| Ligand | Receptor | LRpair | Pathway | Tissue | Disease Stage |
| Page: 1 |
Top |
Single-cell gene regulatory network inference analysis |
| Find out the significant the regulons (TFs) and the target genes of each regulon across cell types for different disease states |
| TF | Cell Type | Tissue | Disease Stage | Target Gene | RSS | Regulon Activity |
| ∗The dot plots of a searched regulon are shown for all cell subpopulations in each disease state of each tissue based on the regulon specific score inferred using pySCENIC and by calculating the average expression. |
| Page: 1 |
Top |
Somatic mutation of malignant transformation related genes |
| Annotation of somatic variants for genes involved in malignant transformation |
| Hugo Symbol | Variant Class | Variant Classification | dbSNP RS | HGVSc | HGVSp | HGVSp Short | SWISSPROT | BIOTYPE | SIFT | PolyPhen | Tumor Sample Barcode | Tissue | Histology | Sex | Age | Stage | Therapy Types | Drugs | Outcome |
| SLC4A4 | SNV | Missense_Mutation | c.2167N>A | p.Ala723Thr | p.A723T | Q9Y6R1 | protein_coding | deleterious(0) | benign(0.232) | TCGA-A2-A04P-01 | Breast | breast invasive carcinoma | Female | <65 | III/IV | Chemotherapy | taxol | PD | |
| SLC4A4 | SNV | Missense_Mutation | c.1245N>A | p.Met415Ile | p.M415I | Q9Y6R1 | protein_coding | tolerated(0.28) | benign(0.133) | TCGA-A2-A0CL-01 | Breast | breast invasive carcinoma | Female | <65 | III/IV | Chemotherapy | cytoxan | SD | |
| SLC4A4 | SNV | Missense_Mutation | c.151C>A | p.His51Asn | p.H51N | Q9Y6R1 | protein_coding | tolerated(0.18) | benign(0.138) | TCGA-A8-A07Z-01 | Breast | breast invasive carcinoma | Female | >=65 | I/II | Unspecific | Exemestane | SD | |
| SLC4A4 | SNV | Missense_Mutation | c.3144N>A | p.Asp1048Glu | p.D1048E | Q9Y6R1 | protein_coding | tolerated(1) | benign(0) | TCGA-A8-A097-01 | Breast | breast invasive carcinoma | Female | >=65 | I/II | Hormone Therapy | tamoxiphen | SD | |
| SLC4A4 | SNV | Missense_Mutation | c.898N>T | p.Ile300Phe | p.I300F | Q9Y6R1 | protein_coding | deleterious(0.03) | benign(0.033) | TCGA-A8-A09M-01 | Breast | breast invasive carcinoma | Female | >=65 | III/IV | Chemotherapy | paclitaxel | CR | |
| SLC4A4 | SNV | Missense_Mutation | c.358N>T | p.Gly120Trp | p.G120W | Q9Y6R1 | protein_coding | deleterious(0) | probably_damaging(1) | TCGA-A8-A09Q-01 | Breast | breast invasive carcinoma | Female | >=65 | III/IV | Hormone Therapy | anastrozole | SD | |
| SLC4A4 | SNV | Missense_Mutation | rs753466011 | c.2125G>T | p.Ala709Ser | p.A709S | Q9Y6R1 | protein_coding | tolerated(0.54) | benign(0.015) | TCGA-AN-A046-01 | Breast | breast invasive carcinoma | Female | >=65 | I/II | Unknown | Unknown | SD |
| SLC4A4 | SNV | Missense_Mutation | c.268N>A | p.Glu90Lys | p.E90K | Q9Y6R1 | protein_coding | tolerated(0.06) | possibly_damaging(0.624) | TCGA-AR-A255-01 | Breast | breast invasive carcinoma | Female | <65 | I/II | Targeted Molecular therapy | trastuzumab | SD | |
| SLC4A4 | SNV | Missense_Mutation | c.2018A>G | p.Glu673Gly | p.E673G | Q9Y6R1 | protein_coding | deleterious(0.02) | possibly_damaging(0.555) | TCGA-BH-A0E2-01 | Breast | breast invasive carcinoma | Female | <65 | III/IV | Chemotherapy | doxorubicin | SD | |
| SLC4A4 | SNV | Missense_Mutation | c.3049G>A | p.Glu1017Lys | p.E1017K | Q9Y6R1 | protein_coding | tolerated(0.72) | benign(0.007) | TCGA-C8-A26Y-01 | Breast | breast invasive carcinoma | Female | >=65 | I/II | Unknown | Unknown | SD |
| Page: 1 2 3 4 5 6 7 8 9 10 11 12 13 14 15 16 |
Top |
Related drugs of malignant transformation related genes |
| Identification of chemicals and drugs interact with genes involved in malignant transfromation |
| (DGIdb 4.0) |
| Entrez ID | Symbol | Category | Interaction Types | Drug Claim Name | Drug Name | PMIDs |
| Page: 1 |

Copyright 2023-Present -The University of Texas Health Science Center at Houston |