
|
|||||
|
 | |
| |
| |
| |
| |
| |
|
Gene: SELENOK |
Gene summary for SELENOK |
| Gene information | Species | Human | Gene symbol | SELENOK | Gene ID | 58515 |
| Gene name | selenoprotein K | |
| Gene Alias | HSPC030 | |
| Cytomap | 3p21.1 | |
| Gene Type | protein-coding | GO ID | GO:0001775 | UniProtAcc | Q9Y6D0 |
Top |
Malignant transformation analysis |
| Identification of the aberrant gene expression in precancerous and cancerous lesions by comparing the gene expression of stem-like cells in diseased tissues with normal stem cells |
| Entrez ID | Symbol | Replicates | Species | Organ | Tissue | Adj P-value | Log2FC | Malignancy |
| 58515 | SELENOK | GSM4909281 | Human | Breast | IDC | 5.58e-16 | 5.46e-01 | 0.21 |
| 58515 | SELENOK | GSM4909285 | Human | Breast | IDC | 4.55e-05 | 1.21e-01 | 0.21 |
| 58515 | SELENOK | GSM4909286 | Human | Breast | IDC | 1.45e-15 | 1.67e-01 | 0.1081 |
| 58515 | SELENOK | GSM4909290 | Human | Breast | IDC | 7.34e-11 | 3.76e-01 | 0.2096 |
| 58515 | SELENOK | GSM4909298 | Human | Breast | IDC | 1.90e-14 | 3.08e-01 | 0.1551 |
| 58515 | SELENOK | GSM4909299 | Human | Breast | IDC | 2.07e-04 | 3.12e-01 | 0.035 |
| 58515 | SELENOK | GSM4909300 | Human | Breast | IDC | 1.95e-02 | 3.29e-01 | 0.0334 |
| 58515 | SELENOK | GSM4909301 | Human | Breast | IDC | 5.13e-07 | 4.32e-01 | 0.1577 |
| 58515 | SELENOK | GSM4909305 | Human | Breast | IDC | 7.03e-07 | 2.18e-01 | 0.0436 |
| 58515 | SELENOK | GSM4909306 | Human | Breast | IDC | 3.92e-03 | 1.26e-01 | 0.1564 |
| 58515 | SELENOK | GSM4909308 | Human | Breast | IDC | 5.67e-15 | 2.86e-01 | 0.158 |
| 58515 | SELENOK | GSM4909311 | Human | Breast | IDC | 3.21e-13 | -1.64e-01 | 0.1534 |
| 58515 | SELENOK | GSM4909319 | Human | Breast | IDC | 8.35e-20 | -6.02e-02 | 0.1563 |
| 58515 | SELENOK | ctrl6 | Human | Breast | Precancer | 3.22e-20 | 7.21e-01 | -0.0061 |
| 58515 | SELENOK | brca1 | Human | Breast | Precancer | 1.06e-23 | -4.89e-01 | -0.0338 |
| 58515 | SELENOK | brca2 | Human | Breast | Precancer | 2.31e-20 | -4.89e-01 | -0.024 |
| 58515 | SELENOK | brca3 | Human | Breast | Precancer | 2.31e-20 | -4.89e-01 | -0.0263 |
| 58515 | SELENOK | brca10 | Human | Breast | Precancer | 2.97e-32 | 8.18e-01 | -0.0029 |
| 58515 | SELENOK | brca11 | Human | Breast | Precancer | 2.81e-02 | 6.74e-01 | 0.0193 |
| 58515 | SELENOK | M1 | Human | Breast | IDC | 1.90e-02 | 1.22e-01 | 0.1577 |
| Page: 1 2 3 4 5 6 7 8 9 10 |
| Tissue | Expression Dynamics | Abbreviation |
| Breast |  | IDC: Invasive ductal carcinoma |
| DCIS: Ductal carcinoma in situ | ||
| Precancer(BRCA1-mut): Precancerous lesion from BRCA1 mutation carriers | ||
| Cervix | 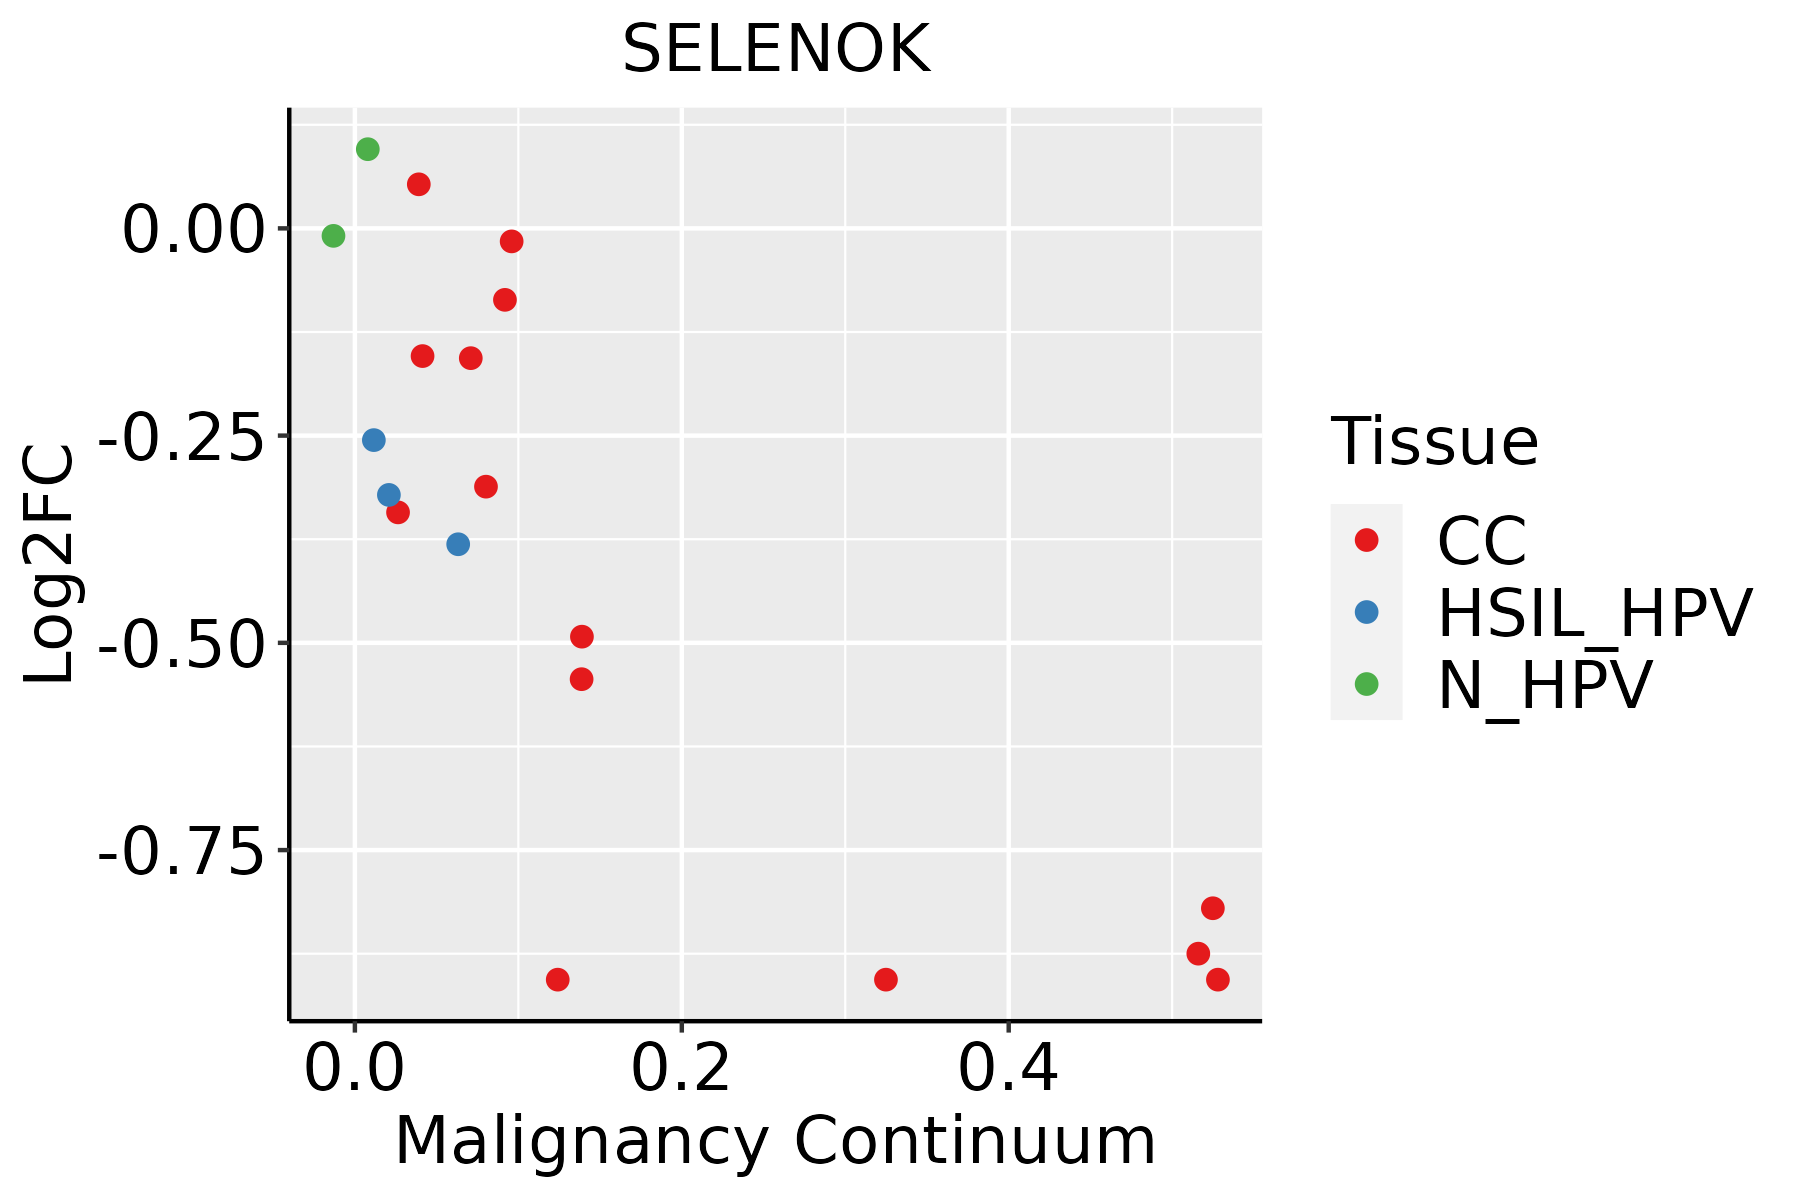 | CC: Cervix cancer |
| HSIL_HPV: HPV-infected high-grade squamous intraepithelial lesions | ||
| N_HPV: HPV-infected normal cervix | ||
| Colorectum (GSE201348) |  | FAP: Familial adenomatous polyposis |
| CRC: Colorectal cancer | ||
| Colorectum (HTA11) | 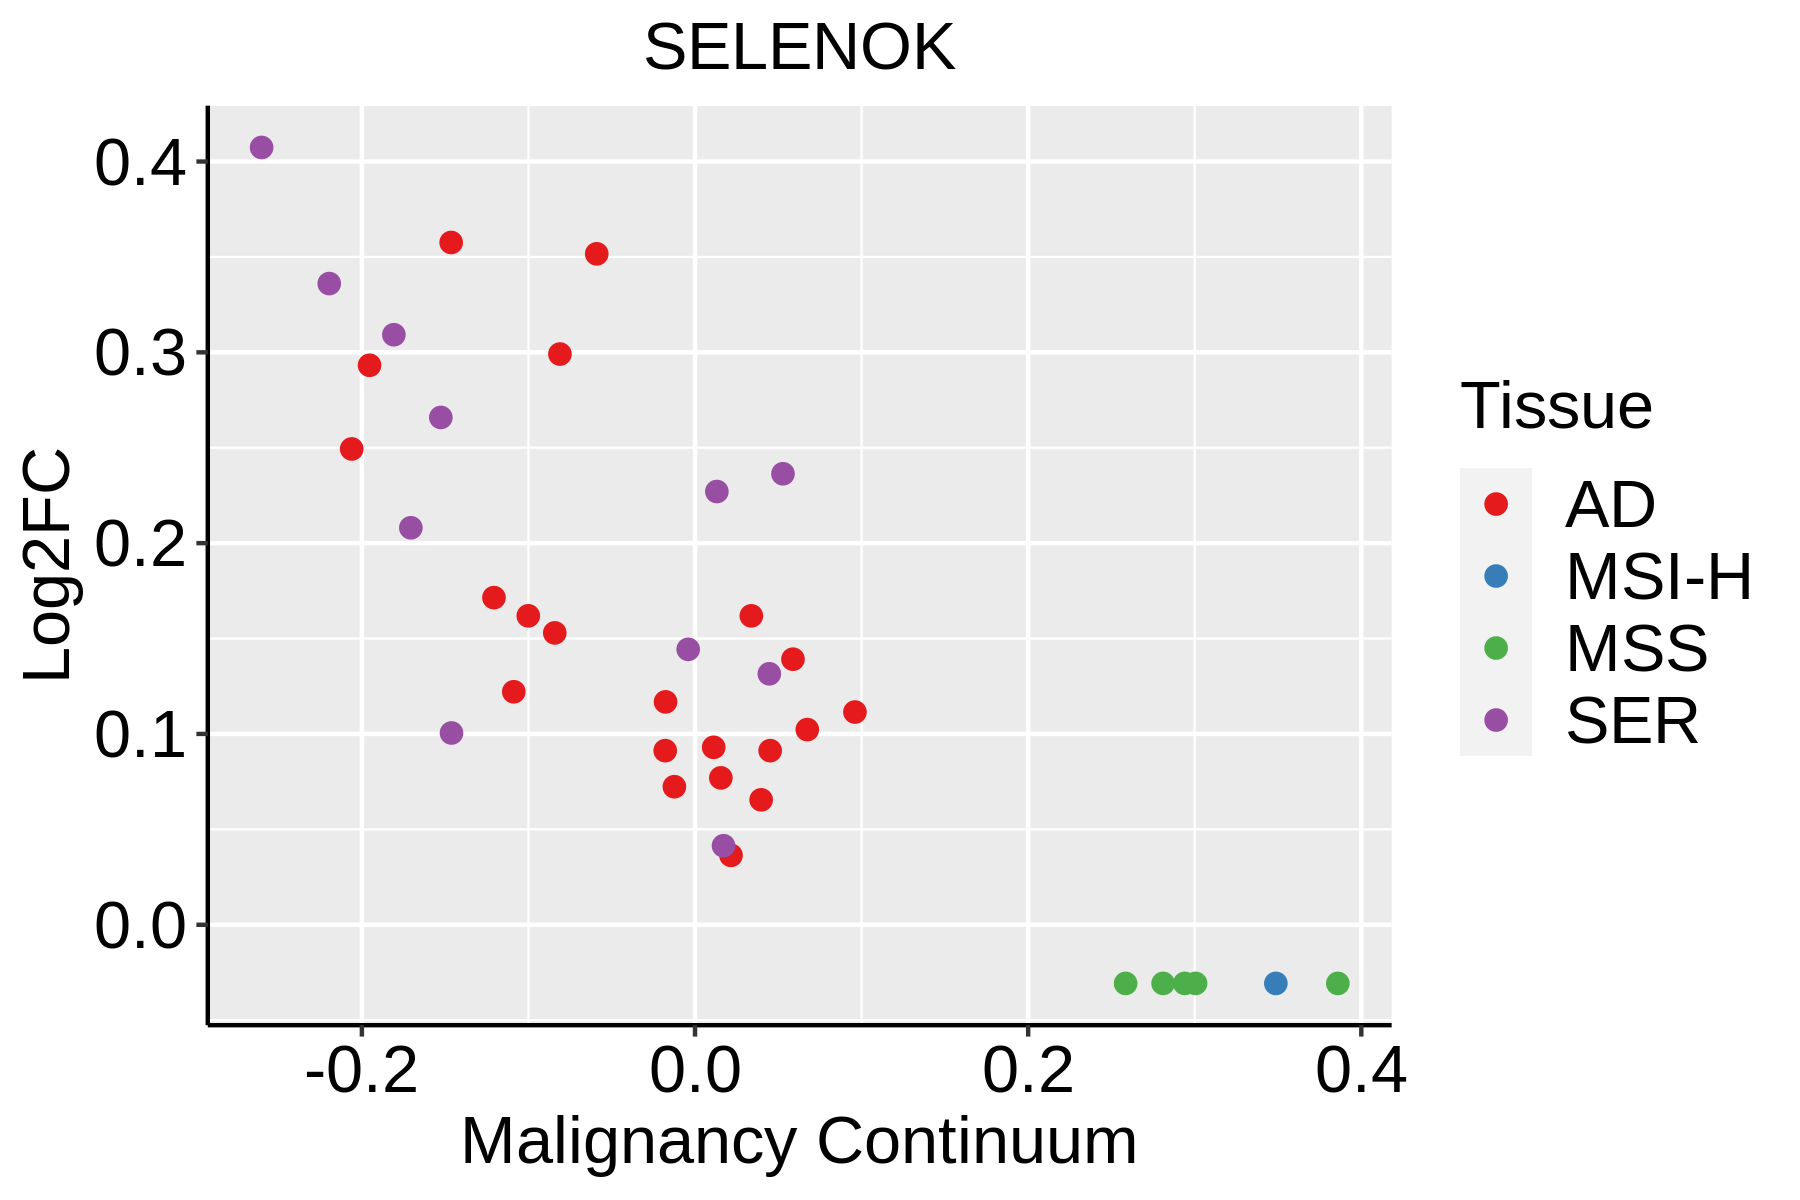 | AD: Adenomas |
| SER: Sessile serrated lesions | ||
| MSI-H: Microsatellite-high colorectal cancer | ||
| MSS: Microsatellite stable colorectal cancer | ||
| Endometrium |  | AEH: Atypical endometrial hyperplasia |
| EEC: Endometrioid Cancer | ||
| Esophagus | 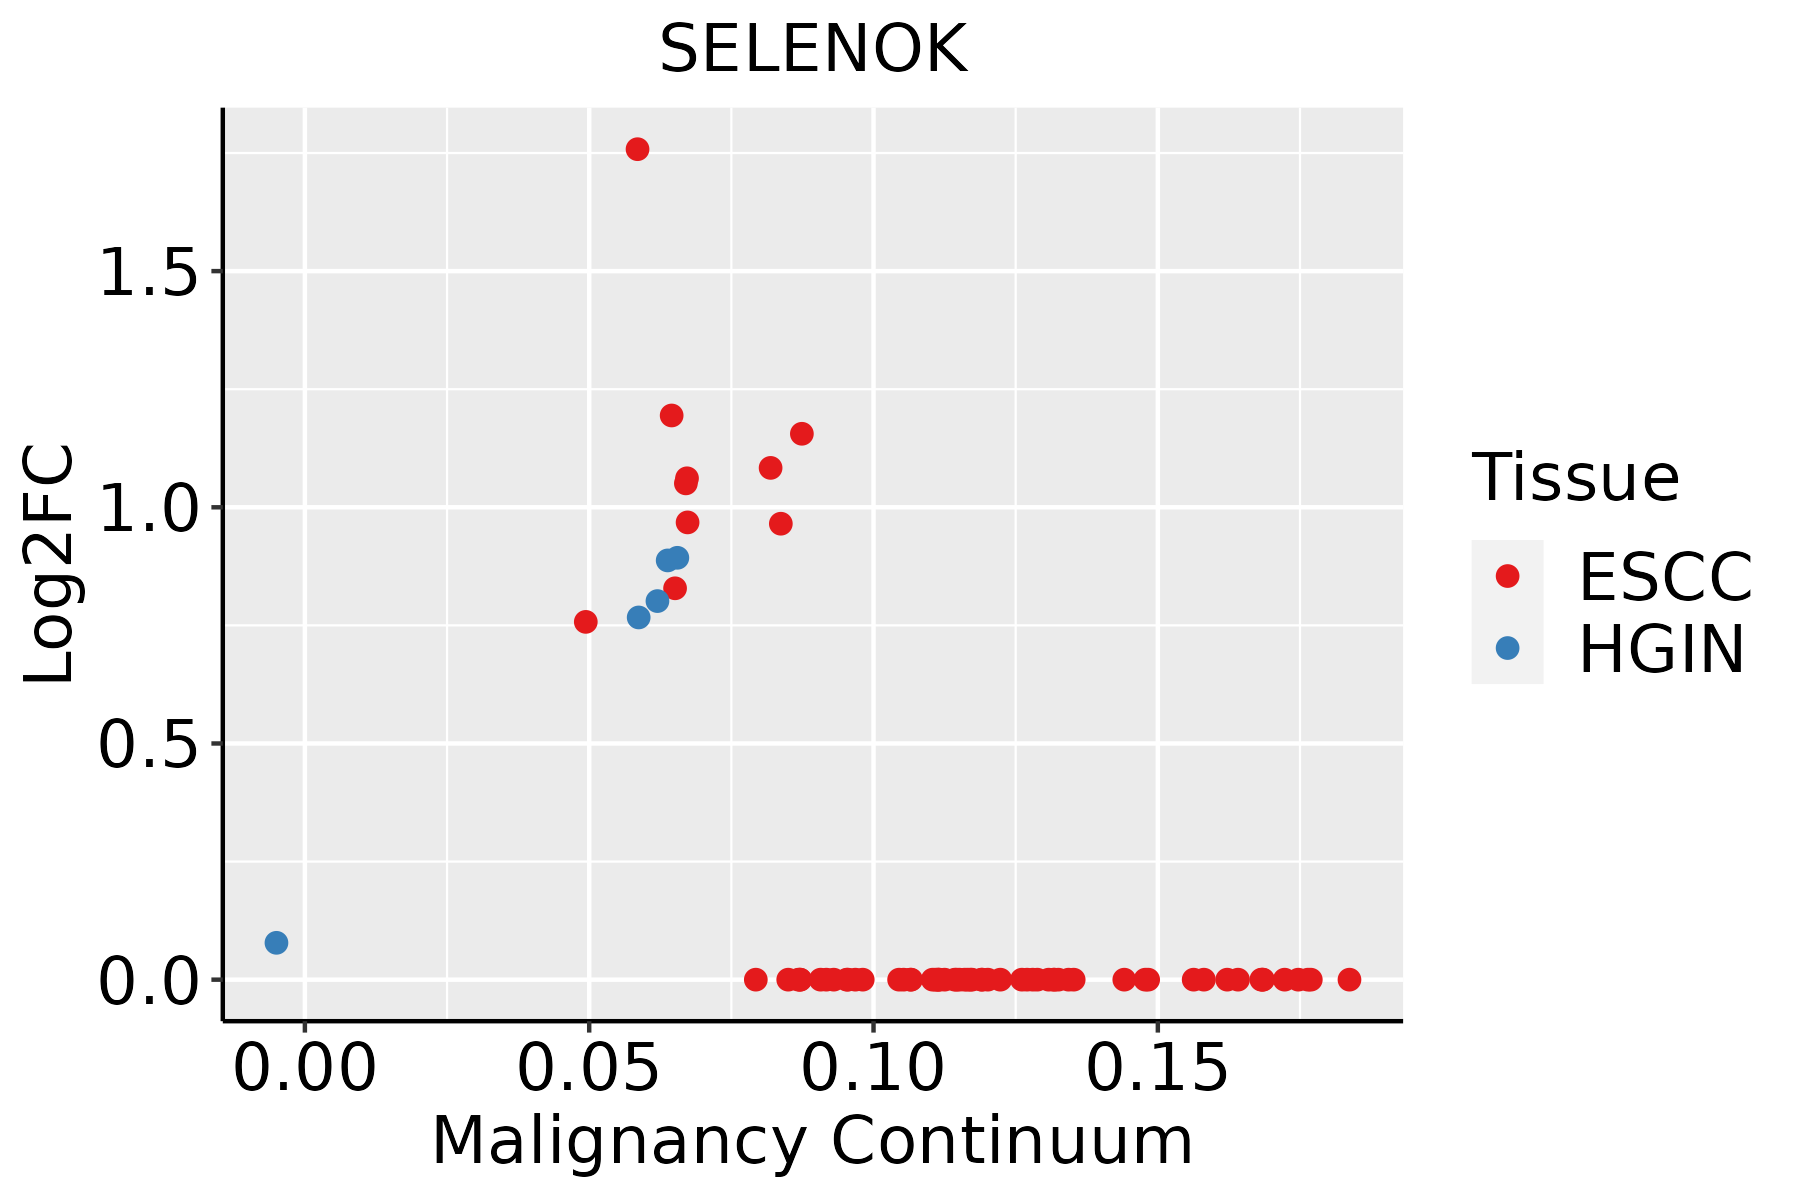 | ESCC: Esophageal squamous cell carcinoma |
| HGIN: High-grade intraepithelial neoplasias | ||
| LGIN: Low-grade intraepithelial neoplasias | ||
| GC | 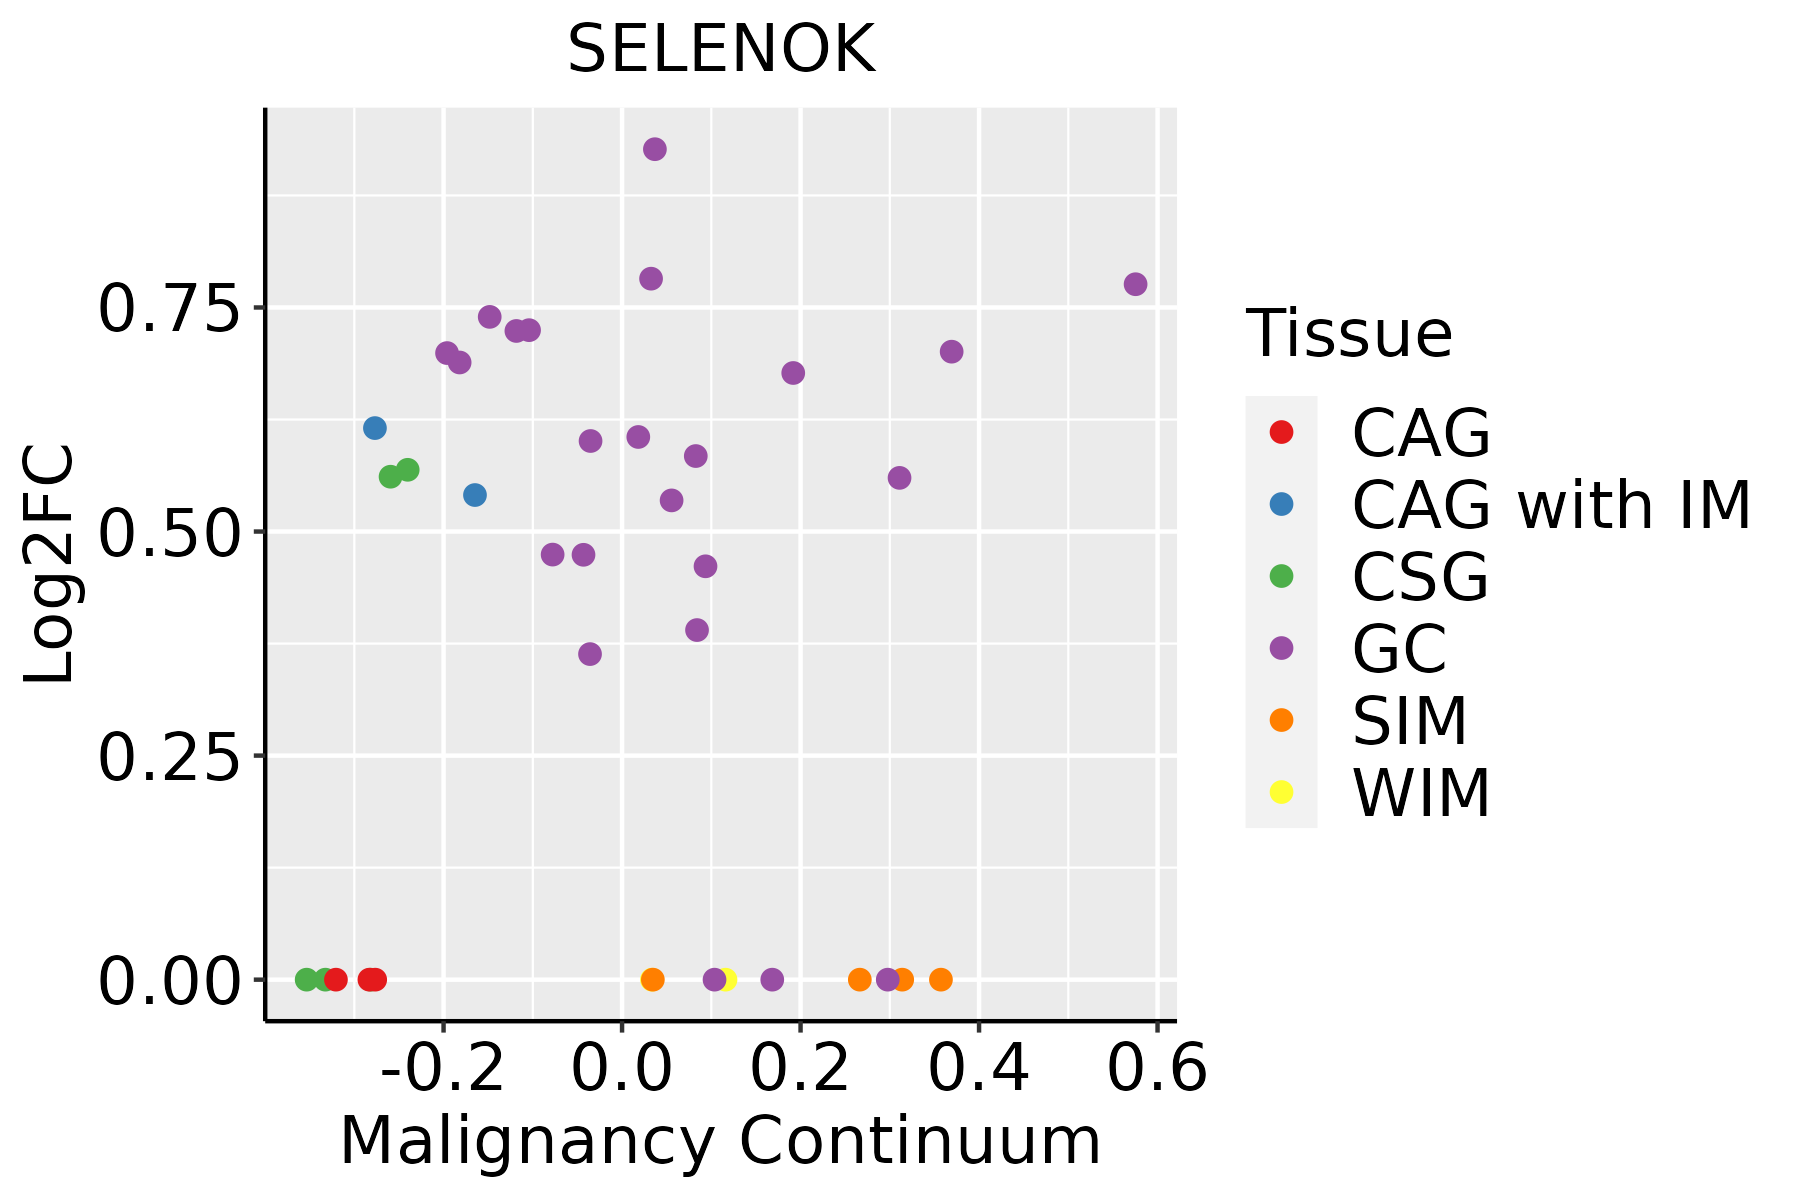 | CAG: Chronic atrophic gastritis |
| CAG with IM: Chronic atrophic gastritis with intestinal metaplasia | ||
| CSG: Chronic superficial gastritis | ||
| GC: Gastric cancer | ||
| SIM: Severe intestinal metaplasia | ||
| WIM: Wild intestinal metaplasia | ||
| Liver | 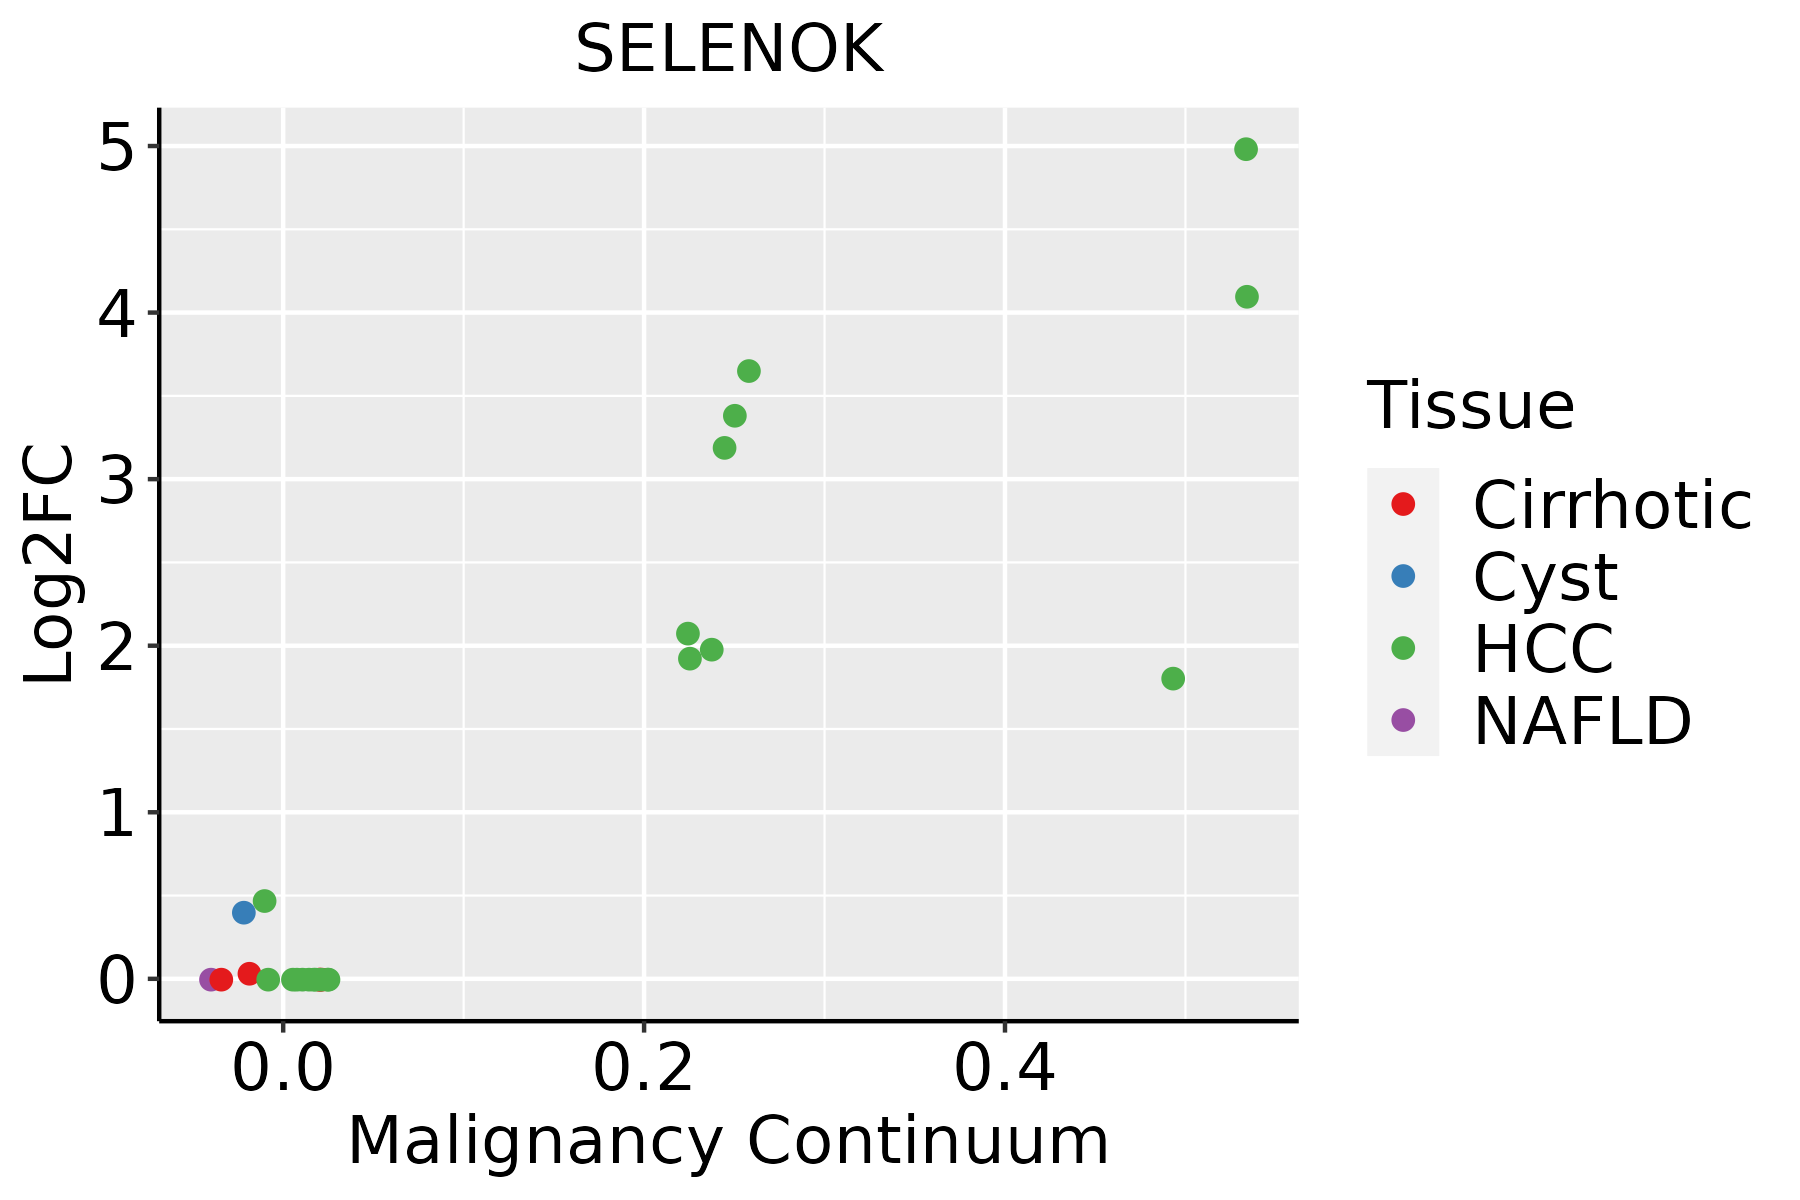 | HCC: Hepatocellular carcinoma |
| NAFLD: Non-alcoholic fatty liver disease | ||
| Lung | 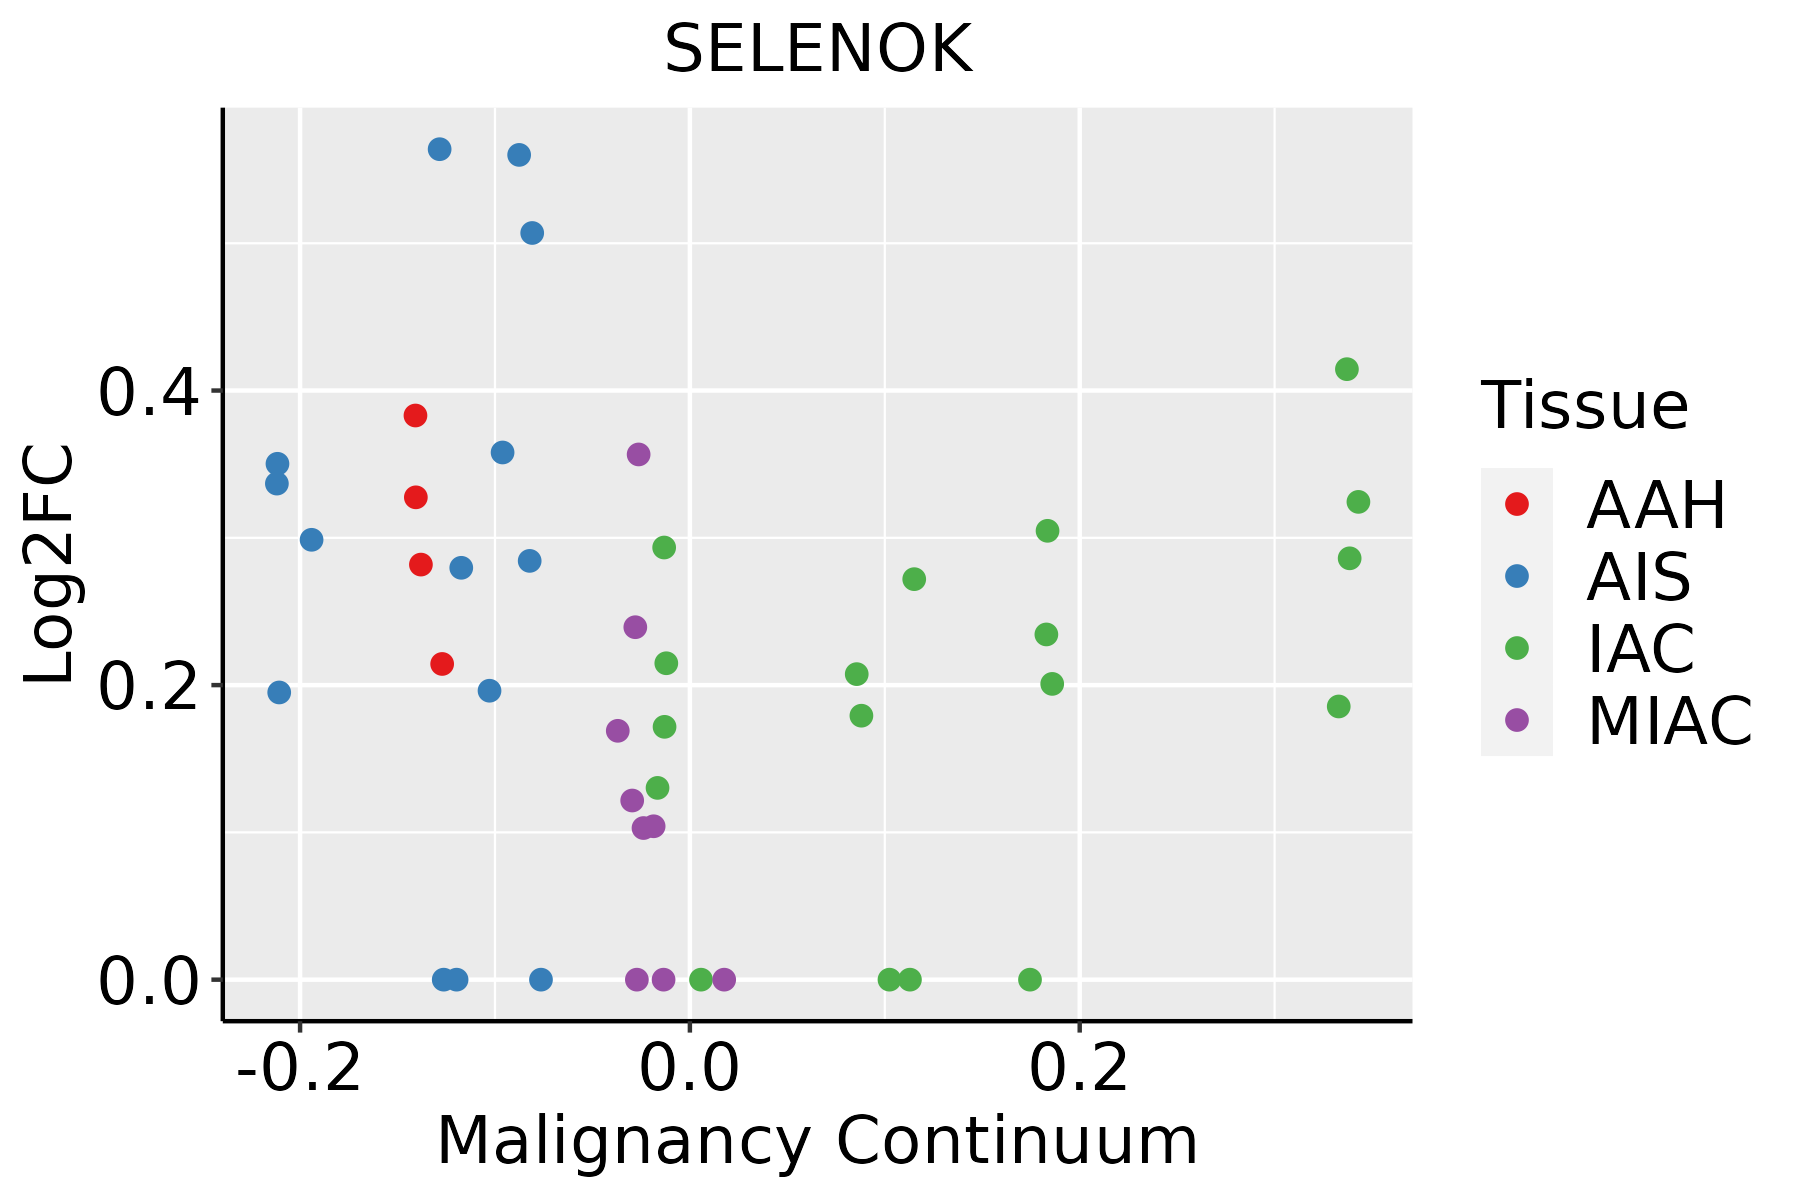 | AAH: Atypical adenomatous hyperplasia |
| AIS: Adenocarcinoma in situ | ||
| IAC: Invasive lung adenocarcinoma | ||
| MIA: Minimally invasive adenocarcinoma | ||
| Oral Cavity | 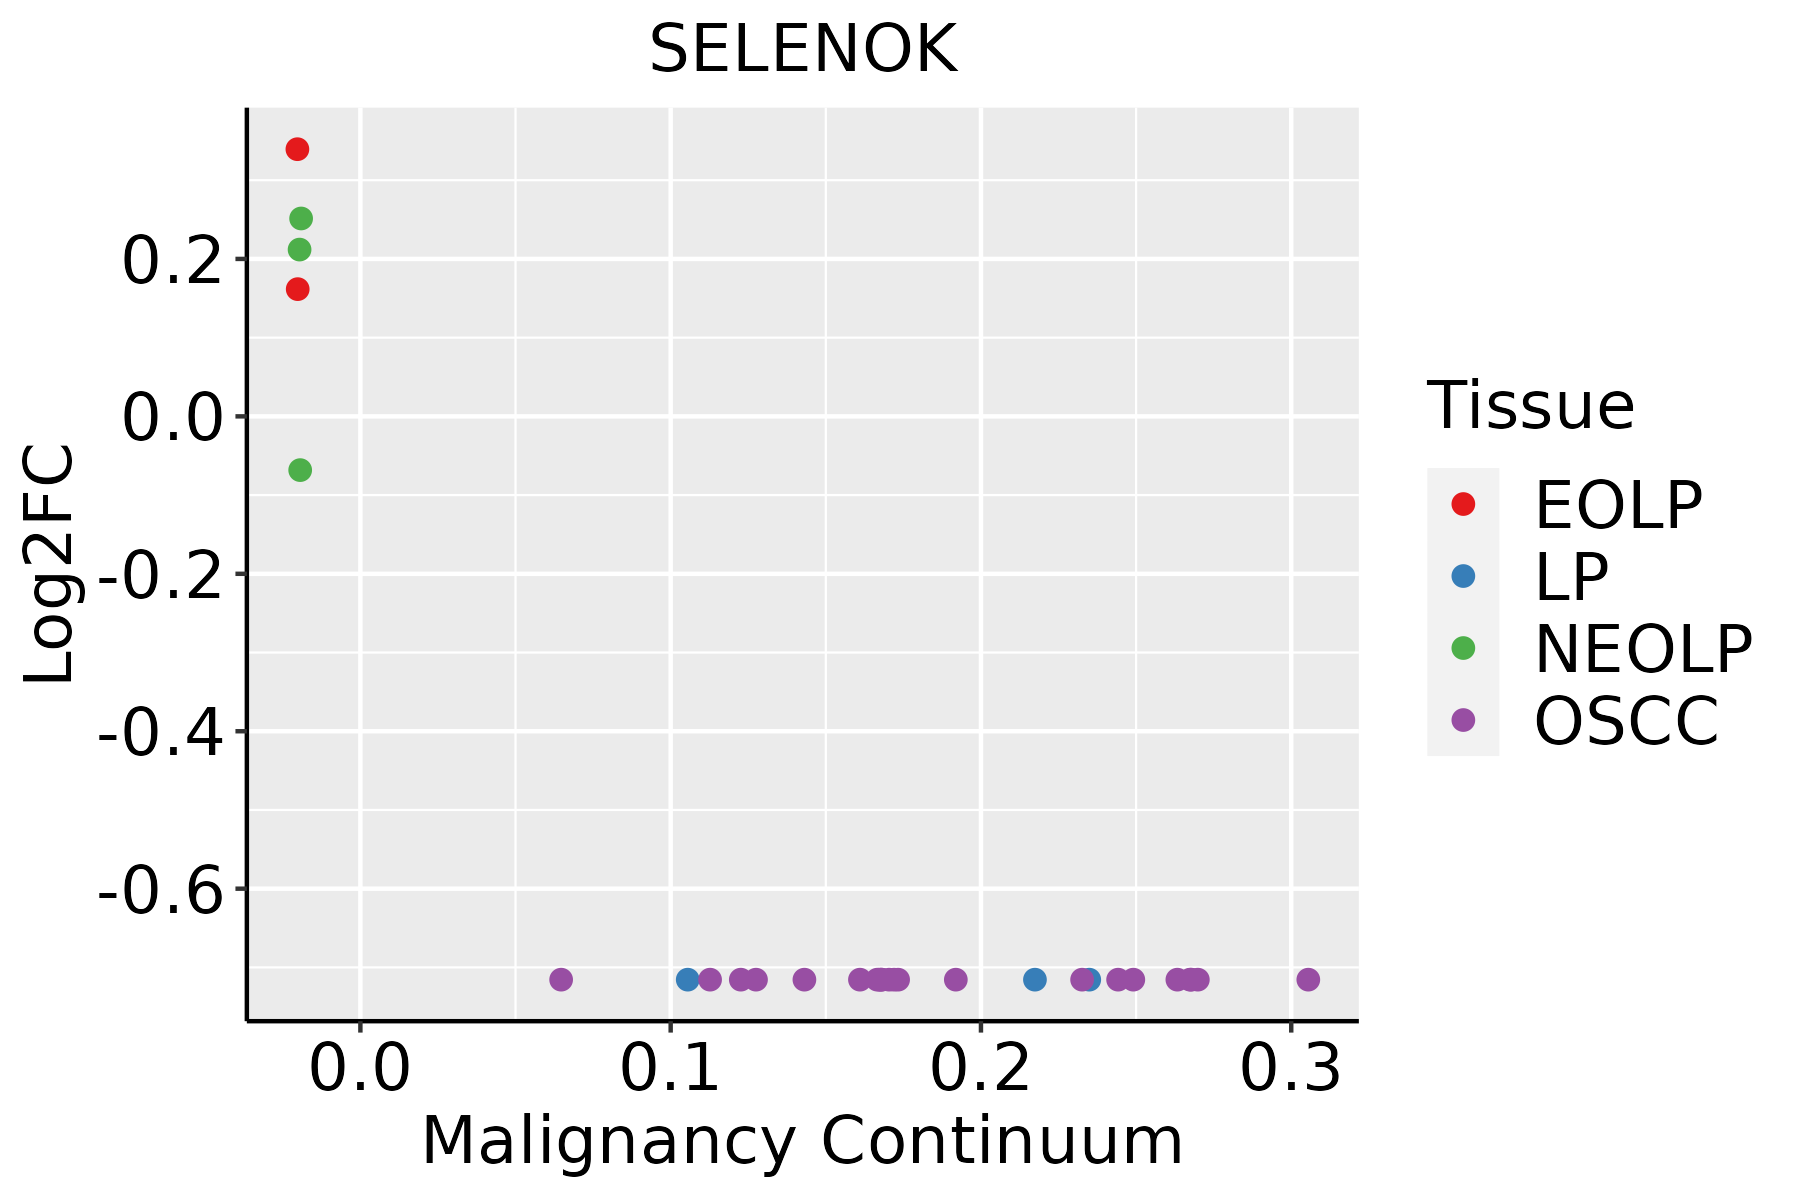 | EOLP: Erosive Oral lichen planus |
| LP: leukoplakia | ||
| NEOLP: Non-erosive oral lichen planus | ||
| OSCC: Oral squamous cell carcinoma | ||
| Prostate | 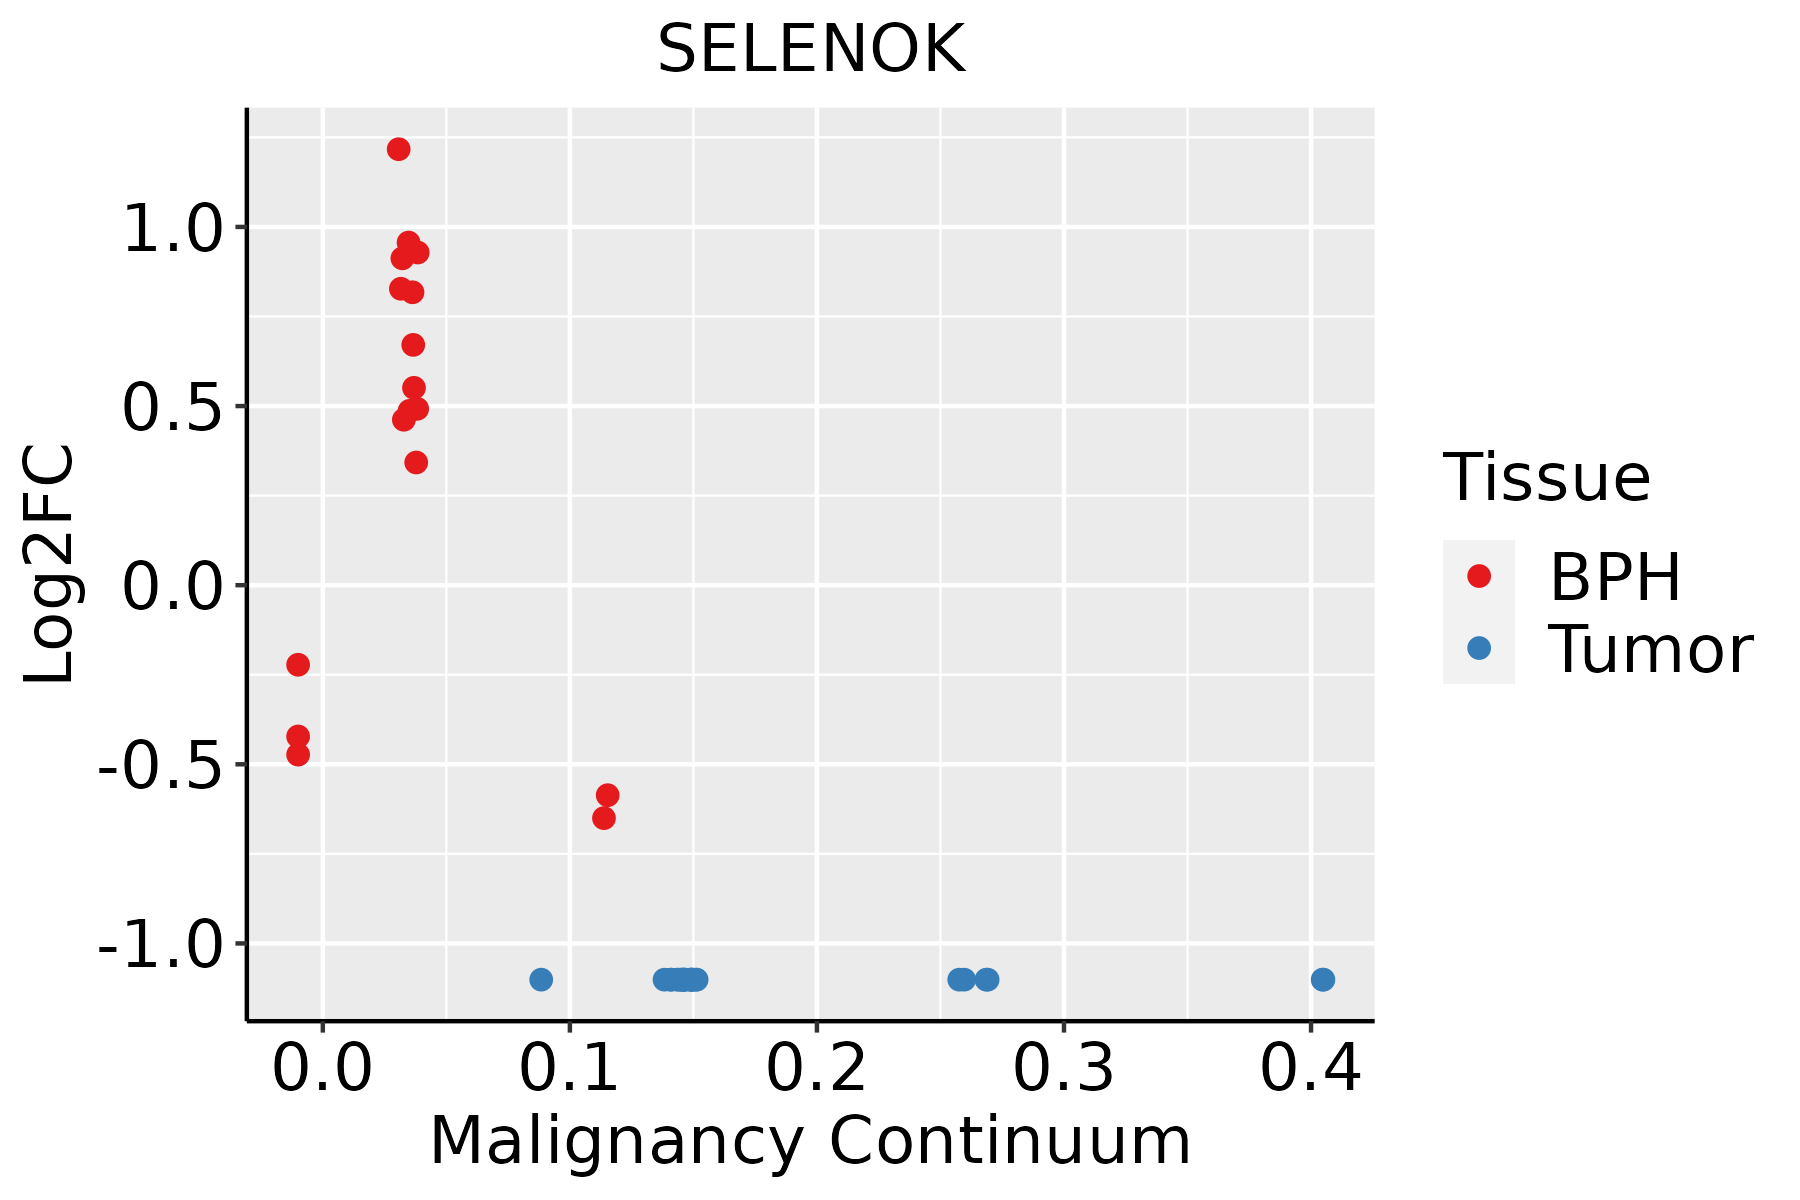 | BPH: Benign Prostatic Hyperplasia |
| Thyroid |  | ATC: Anaplastic thyroid cancer |
| HT: Hashimoto's thyroiditis | ||
| PTC: Papillary thyroid cancer |
| ∗log2FC in expression of this searched gene in stem-like cells from each diseased tissue sample relative to stem-like cells in normal samples in each tissue plotted against the malignancy continuum. Samples are colored based on if they are from different disease stage. |
Top |
Malignant transformation related pathway analysis |
| Find out the enriched GO biological processes and KEGG pathways involved in transition from healthy to precancer to cancer |
| Tissue | Disease Stage | Enriched GO biological Processes |
| Colorectum | AD |  |
| Colorectum | SER |  |
| Colorectum | MSS |  |
| Colorectum | MSI-H |  |
| Colorectum | FAP |  |
| ∗Top 15 enriched GO BP terms are showed in the bar plot of each disease state in each tissue. Each row represents a significant GO biological process which is colored according to the -log10(p.adjust). |
| Page: 1 2 3 4 5 6 7 8 9 |
| GO ID | Tissue | Disease Stage | Description | Gene Ratio | Bg Ratio | pvalue | p.adjust | Count |
| GO:000697926 | Oral cavity | EOLP | response to oxidative stress | 87/2218 | 446/18723 | 1.62e-06 | 3.80e-05 | 87 |
| GO:005090014 | Oral cavity | EOLP | leukocyte migration | 74/2218 | 369/18723 | 3.40e-06 | 7.35e-05 | 74 |
| GO:00512517 | Oral cavity | EOLP | positive regulation of lymphocyte activation | 72/2218 | 362/18723 | 6.21e-06 | 1.22e-04 | 72 |
| GO:007066112 | Oral cavity | EOLP | leukocyte proliferation | 65/2218 | 318/18723 | 6.86e-06 | 1.33e-04 | 65 |
| GO:190303915 | Oral cavity | EOLP | positive regulation of leukocyte cell-cell adhesion | 52/2218 | 239/18723 | 9.14e-06 | 1.70e-04 | 52 |
| GO:000181915 | Oral cavity | EOLP | positive regulation of cytokine production | 87/2218 | 467/18723 | 1.08e-05 | 1.92e-04 | 87 |
| GO:007066310 | Oral cavity | EOLP | regulation of leukocyte proliferation | 52/2218 | 245/18723 | 1.89e-05 | 3.01e-04 | 52 |
| GO:00508677 | Oral cavity | EOLP | positive regulation of cell activation | 79/2218 | 420/18723 | 1.91e-05 | 3.02e-04 | 79 |
| GO:005160721 | Oral cavity | EOLP | defense response to virus | 55/2218 | 265/18723 | 2.16e-05 | 3.35e-04 | 55 |
| GO:014054621 | Oral cavity | EOLP | defense response to symbiont | 55/2218 | 265/18723 | 2.16e-05 | 3.35e-04 | 55 |
| GO:00026968 | Oral cavity | EOLP | positive regulation of leukocyte activation | 77/2218 | 409/18723 | 2.34e-05 | 3.52e-04 | 77 |
| GO:005087014 | Oral cavity | EOLP | positive regulation of T cell activation | 47/2218 | 216/18723 | 2.40e-05 | 3.58e-04 | 47 |
| GO:004209817 | Oral cavity | EOLP | T cell proliferation | 44/2218 | 199/18723 | 2.86e-05 | 4.14e-04 | 44 |
| GO:004354321 | Oral cavity | EOLP | protein acylation | 51/2218 | 243/18723 | 3.11e-05 | 4.41e-04 | 51 |
| GO:004665112 | Oral cavity | EOLP | lymphocyte proliferation | 58/2218 | 288/18723 | 3.29e-05 | 4.63e-04 | 58 |
| GO:002240918 | Oral cavity | EOLP | positive regulation of cell-cell adhesion | 57/2218 | 284/18723 | 4.23e-05 | 5.77e-04 | 57 |
| GO:00457308 | Oral cavity | EOLP | respiratory burst | 14/2218 | 37/18723 | 4.41e-05 | 5.93e-04 | 14 |
| GO:00329436 | Oral cavity | EOLP | mononuclear cell proliferation | 58/2218 | 291/18723 | 4.48e-05 | 5.99e-04 | 58 |
| GO:00506706 | Oral cavity | EOLP | regulation of lymphocyte proliferation | 47/2218 | 225/18723 | 7.03e-05 | 8.67e-04 | 47 |
| GO:007005923 | Oral cavity | EOLP | intrinsic apoptotic signaling pathway in response to endoplasmic reticulum stress | 19/2218 | 63/18723 | 8.12e-05 | 9.69e-04 | 19 |
| Page: 1 2 3 4 5 6 7 8 9 10 11 12 13 14 15 16 17 18 19 20 21 22 23 24 25 26 27 28 29 30 31 32 33 34 35 36 37 |
| Pathway ID | Tissue | Disease Stage | Description | Gene Ratio | Bg Ratio | pvalue | p.adjust | qvalue | Count |
| Page: 1 |
Top |
Cell-cell communication analysis |
| Identification of potential cell-cell interactions between two cell types and their ligand-receptor pairs for different disease states |
| Ligand | Receptor | LRpair | Pathway | Tissue | Disease Stage |
| Page: 1 |
Top |
Single-cell gene regulatory network inference analysis |
| Find out the significant the regulons (TFs) and the target genes of each regulon across cell types for different disease states |
| TF | Cell Type | Tissue | Disease Stage | Target Gene | RSS | Regulon Activity |
| ∗The dot plots of a searched regulon are shown for all cell subpopulations in each disease state of each tissue based on the regulon specific score inferred using pySCENIC and by calculating the average expression. |
| Page: 1 |
Top |
Somatic mutation of malignant transformation related genes |
| Annotation of somatic variants for genes involved in malignant transformation |
| Hugo Symbol | Variant Class | Variant Classification | dbSNP RS | HGVSc | HGVSp | HGVSp Short | SWISSPROT | BIOTYPE | SIFT | PolyPhen | Tumor Sample Barcode | Tissue | Histology | Sex | Age | Stage | Therapy Types | Drugs | Outcome |
| SELENOK | SNV | Missense_Mutation | c.14N>G | p.Ser5Trp | p.S5W | protein_coding | deleterious(0) | possibly_damaging(0.829) | TCGA-AC-A23H-01 | Breast | breast invasive carcinoma | Female | >=65 | I/II | Unknown | Unknown | PD | ||
| SELENOK | SNV | Missense_Mutation | c.149N>A | p.Arg50Lys | p.R50K | protein_coding | tolerated(0.48) | benign(0.026) | TCGA-EK-A2RJ-01 | Cervix | cervical & endocervical cancer | Female | <65 | I/II | Unknown | Unknown | SD | ||
| SELENOK | SNV | Missense_Mutation | c.245N>A | p.Gly82Asp | p.G82D | protein_coding | deleterious(0.01) | probably_damaging(0.999) | TCGA-WS-AB45-01 | Colorectum | colon adenocarcinoma | Female | <65 | I/II | Unknown | Unknown | SD | ||
| SELENOK | deletion | Frame_Shift_Del | novel | c.145delA | p.Arg49GlufsTer51 | p.R49Efs*51 | protein_coding | TCGA-5M-AAT6-01 | Colorectum | colon adenocarcinoma | Female | <65 | III/IV | Unknown | Unknown | PD | |||
| SELENOK | SNV | Missense_Mutation | c.81N>A | p.Phe27Leu | p.F27L | protein_coding | deleterious(0.02) | probably_damaging(0.973) | TCGA-AP-A059-01 | Endometrium | uterine corpus endometrioid carcinoma | Female | >=65 | I/II | Unknown | Unknown | SD | ||
| SELENOK | SNV | Missense_Mutation | rs376660375 | c.241N>T | p.Arg81Cys | p.R81C | protein_coding | deleterious(0.04) | benign(0.192) | TCGA-BG-A220-01 | Endometrium | uterine corpus endometrioid carcinoma | Female | >=65 | I/II | Unknown | Unknown | SD | |
| SELENOK | deletion | Frame_Shift_Del | novel | c.145delN | p.Arg49GlufsTer51 | p.R49Efs*51 | protein_coding | TCGA-AX-A1CE-01 | Endometrium | uterine corpus endometrioid carcinoma | Female | <65 | I/II | Unspecific | Paclitaxel | SD |
| Page: 1 |
Top |
Related drugs of malignant transformation related genes |
| Identification of chemicals and drugs interact with genes involved in malignant transfromation |
| (DGIdb 4.0) |
| Entrez ID | Symbol | Category | Interaction Types | Drug Claim Name | Drug Name | PMIDs |
| Page: 1 |

Copyright 2023-Present -The University of Texas Health Science Center at Houston |