
|
|||||
|
 | |
| |
| |
| |
| |
| |
|
Gene: RAN |
Gene summary for RAN |
| Gene information | Species | Human | Gene symbol | RAN | Gene ID | 5901 |
| Gene name | RAN, member RAS oncogene family | |
| Gene Alias | ARA24 | |
| Cytomap | 12q24.33 | |
| Gene Type | protein-coding | GO ID | GO:0000054 | UniProtAcc | B4DV51 |
Top |
Malignant transformation analysis |
| Identification of the aberrant gene expression in precancerous and cancerous lesions by comparing the gene expression of stem-like cells in diseased tissues with normal stem cells |
| Entrez ID | Symbol | Replicates | Species | Organ | Tissue | Adj P-value | Log2FC | Malignancy |
| 5901 | RAN | GSM4909282 | Human | Breast | IDC | 9.01e-03 | 2.32e-01 | -0.0288 |
| 5901 | RAN | GSM4909286 | Human | Breast | IDC | 4.25e-08 | -1.45e-01 | 0.1081 |
| 5901 | RAN | GSM4909288 | Human | Breast | IDC | 1.49e-04 | -6.56e-02 | 0.0988 |
| 5901 | RAN | GSM4909290 | Human | Breast | IDC | 9.90e-04 | 2.40e-01 | 0.2096 |
| 5901 | RAN | GSM4909291 | Human | Breast | IDC | 4.90e-02 | -4.21e-01 | 0.1753 |
| 5901 | RAN | GSM4909294 | Human | Breast | IDC | 3.22e-07 | 9.44e-03 | 0.2022 |
| 5901 | RAN | GSM4909296 | Human | Breast | IDC | 1.01e-15 | 4.80e-02 | 0.1524 |
| 5901 | RAN | GSM4909297 | Human | Breast | IDC | 7.28e-23 | -1.34e-01 | 0.1517 |
| 5901 | RAN | GSM4909298 | Human | Breast | IDC | 5.96e-03 | -2.11e-01 | 0.1551 |
| 5901 | RAN | GSM4909299 | Human | Breast | IDC | 4.27e-02 | -2.07e-01 | 0.035 |
| 5901 | RAN | GSM4909301 | Human | Breast | IDC | 8.91e-06 | -3.44e-01 | 0.1577 |
| 5901 | RAN | GSM4909302 | Human | Breast | IDC | 4.34e-03 | -3.79e-01 | 0.1545 |
| 5901 | RAN | GSM4909309 | Human | Breast | IDC | 2.21e-03 | -8.10e-02 | 0.0483 |
| 5901 | RAN | GSM4909311 | Human | Breast | IDC | 5.15e-49 | -4.78e-01 | 0.1534 |
| 5901 | RAN | GSM4909312 | Human | Breast | IDC | 7.30e-11 | -1.20e-01 | 0.1552 |
| 5901 | RAN | GSM4909313 | Human | Breast | IDC | 1.66e-06 | -3.83e-01 | 0.0391 |
| 5901 | RAN | GSM4909315 | Human | Breast | IDC | 3.82e-07 | 1.95e-01 | 0.21 |
| 5901 | RAN | GSM4909316 | Human | Breast | IDC | 2.48e-04 | 8.36e-02 | 0.21 |
| 5901 | RAN | GSM4909318 | Human | Breast | IDC | 2.74e-07 | 2.90e-01 | 0.2031 |
| 5901 | RAN | GSM4909319 | Human | Breast | IDC | 6.88e-66 | -4.29e-01 | 0.1563 |
| Page: 1 2 3 4 5 6 7 8 9 10 11 12 13 14 15 16 |
| Tissue | Expression Dynamics | Abbreviation |
| Breast | 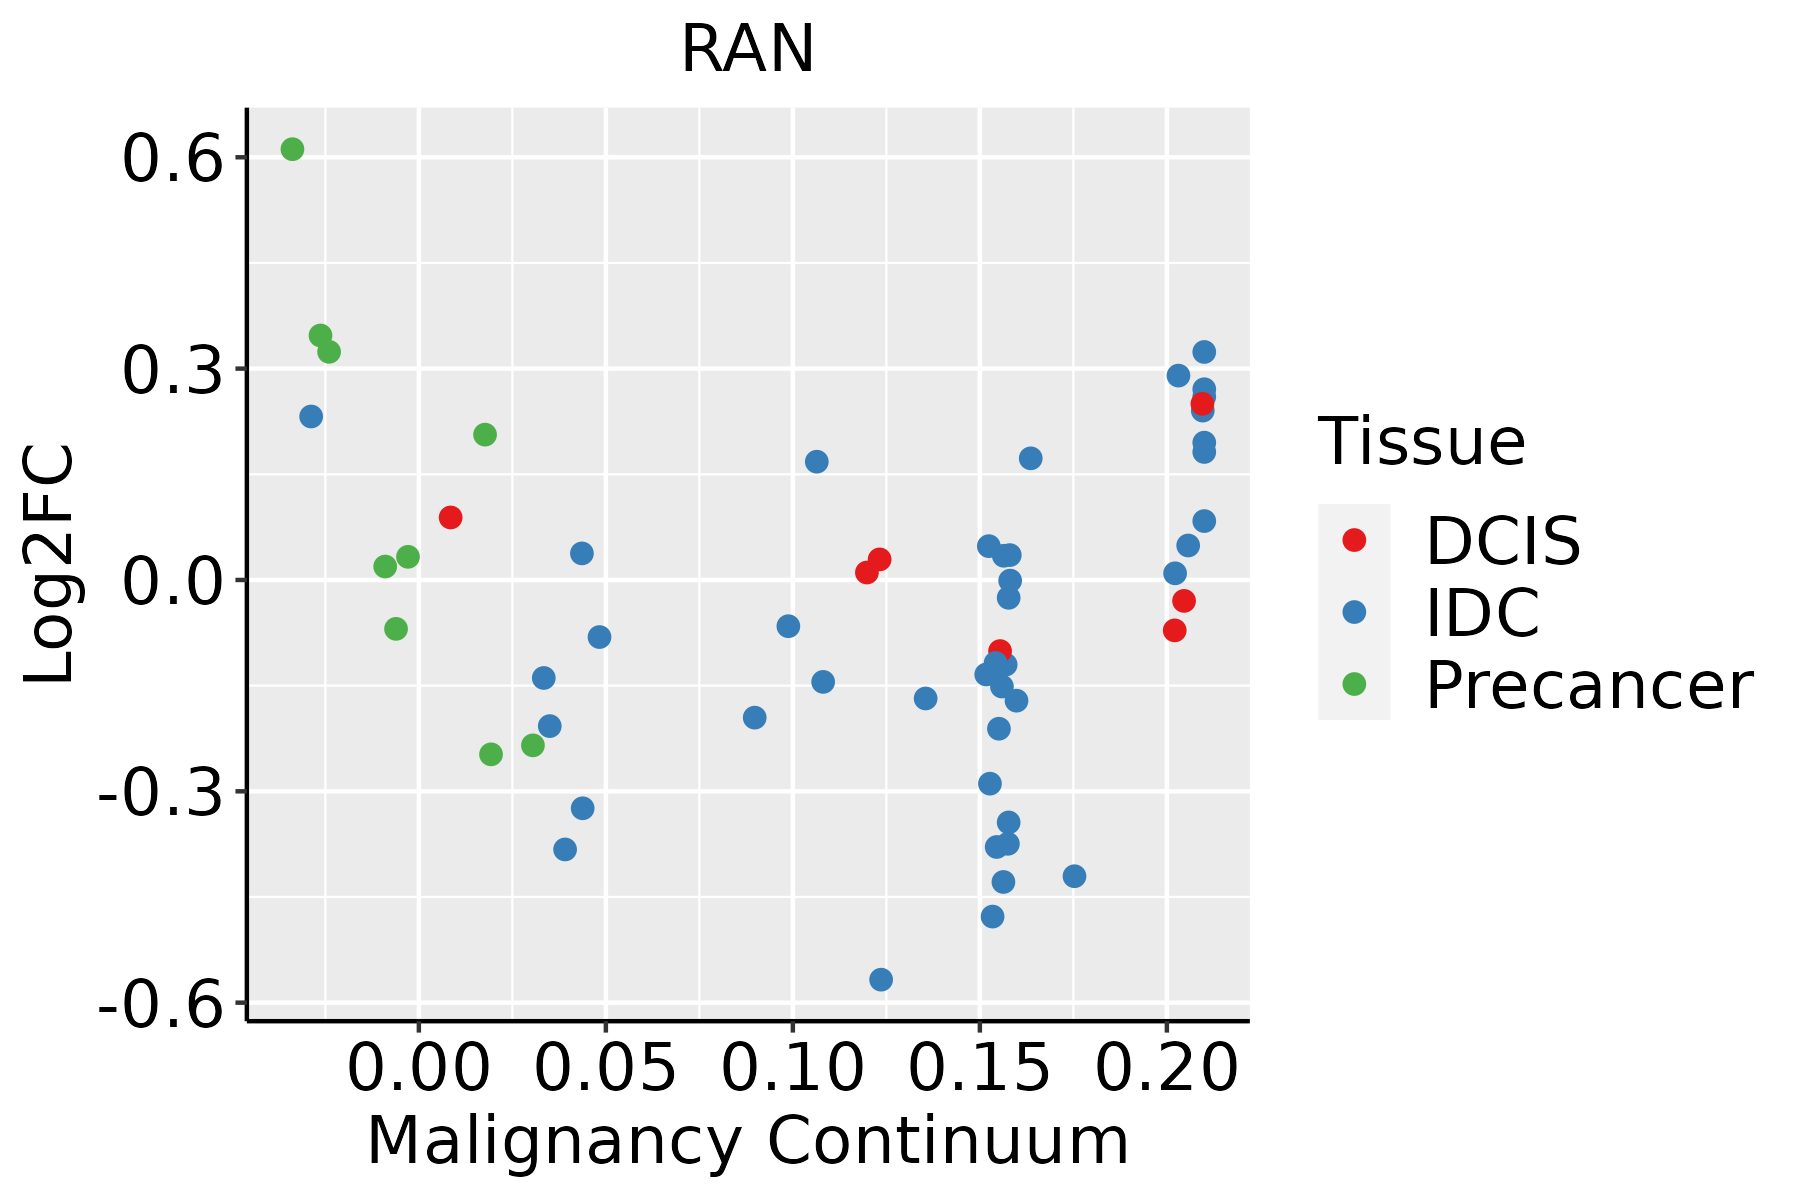 | IDC: Invasive ductal carcinoma |
| DCIS: Ductal carcinoma in situ | ||
| Precancer(BRCA1-mut): Precancerous lesion from BRCA1 mutation carriers | ||
| Cervix | 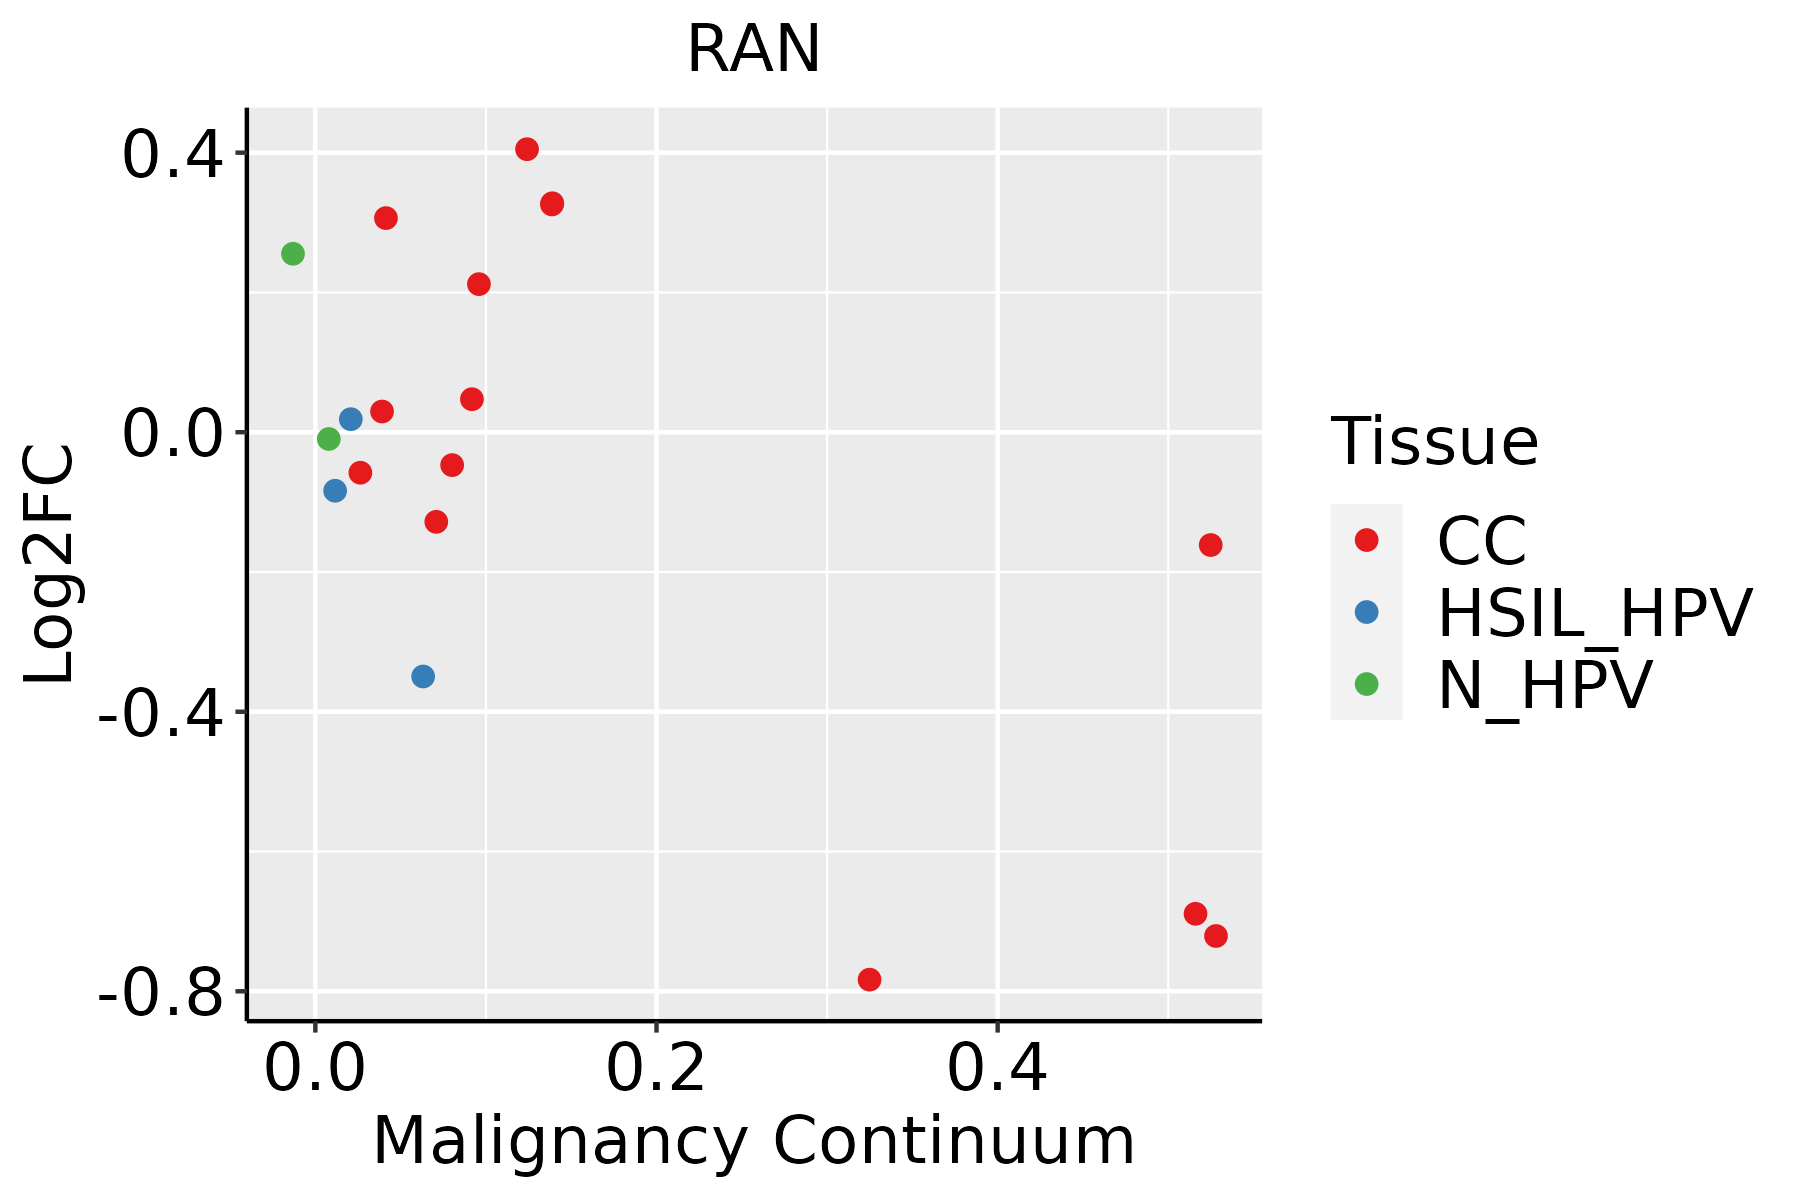 | CC: Cervix cancer |
| HSIL_HPV: HPV-infected high-grade squamous intraepithelial lesions | ||
| N_HPV: HPV-infected normal cervix | ||
| Colorectum (GSE201348) |  | FAP: Familial adenomatous polyposis |
| CRC: Colorectal cancer | ||
| Colorectum (HTA11) |  | AD: Adenomas |
| SER: Sessile serrated lesions | ||
| MSI-H: Microsatellite-high colorectal cancer | ||
| MSS: Microsatellite stable colorectal cancer | ||
| Endometrium |  | AEH: Atypical endometrial hyperplasia |
| EEC: Endometrioid Cancer | ||
| Esophagus |  | ESCC: Esophageal squamous cell carcinoma |
| HGIN: High-grade intraepithelial neoplasias | ||
| LGIN: Low-grade intraepithelial neoplasias | ||
| GC |  | CAG: Chronic atrophic gastritis |
| CAG with IM: Chronic atrophic gastritis with intestinal metaplasia | ||
| CSG: Chronic superficial gastritis | ||
| GC: Gastric cancer | ||
| SIM: Severe intestinal metaplasia | ||
| WIM: Wild intestinal metaplasia | ||
| Liver | 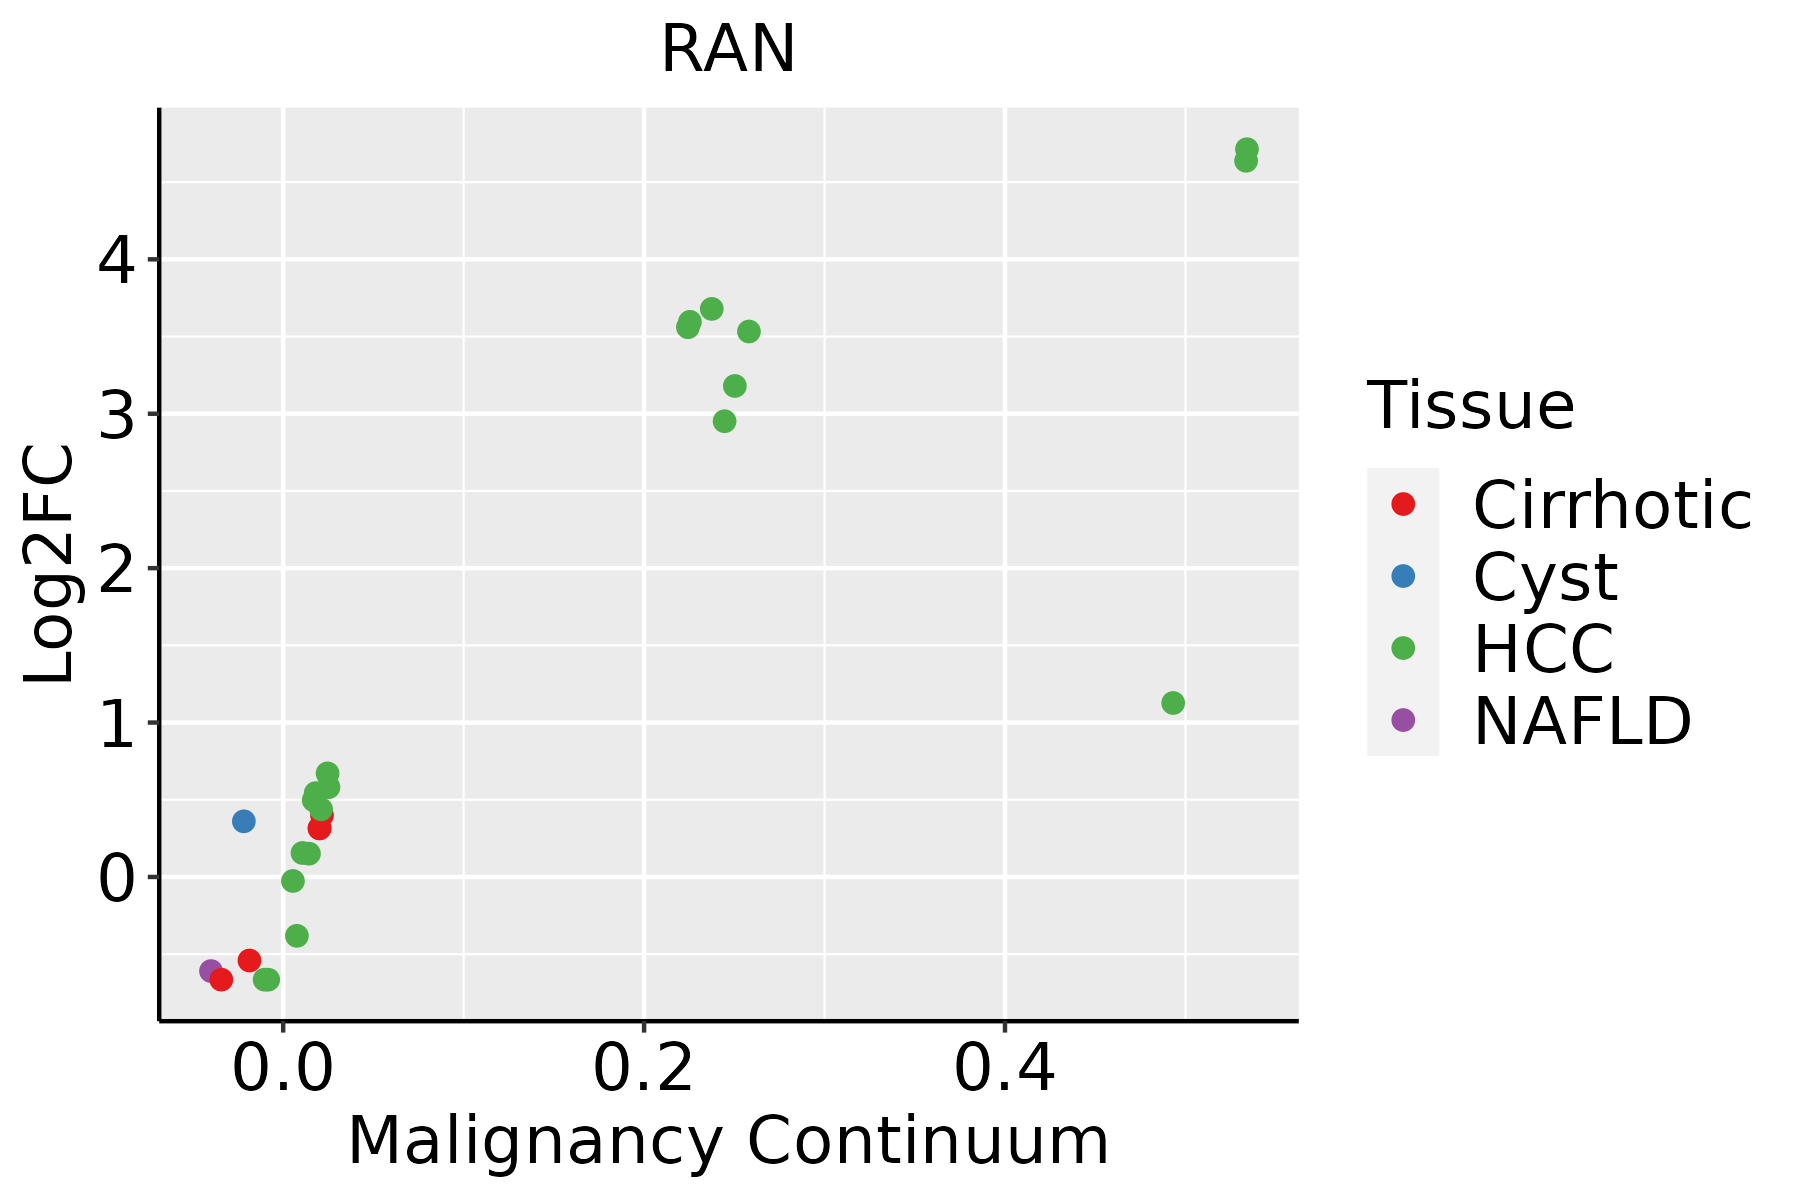 | HCC: Hepatocellular carcinoma |
| NAFLD: Non-alcoholic fatty liver disease | ||
| Oral Cavity |  | EOLP: Erosive Oral lichen planus |
| LP: leukoplakia | ||
| NEOLP: Non-erosive oral lichen planus | ||
| OSCC: Oral squamous cell carcinoma | ||
| Prostate | 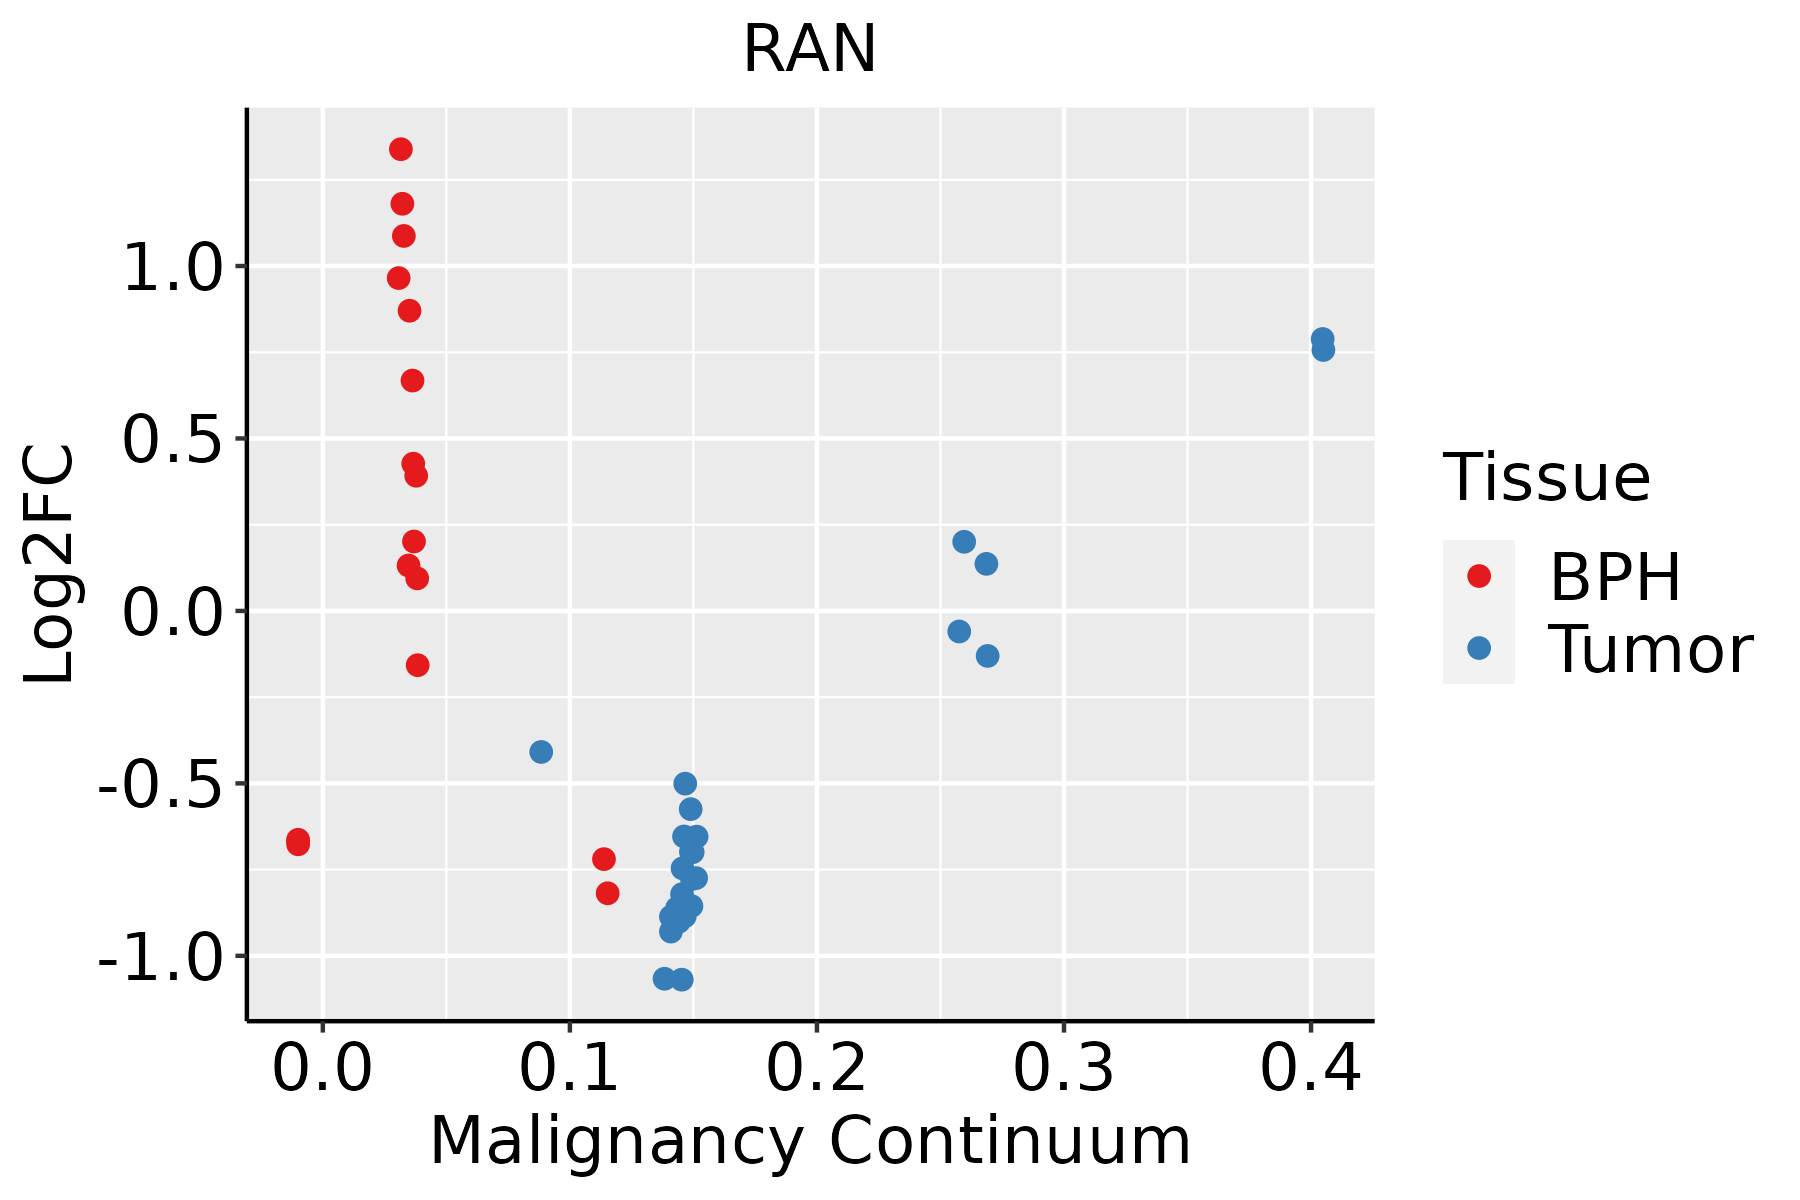 | BPH: Benign Prostatic Hyperplasia |
| Skin | 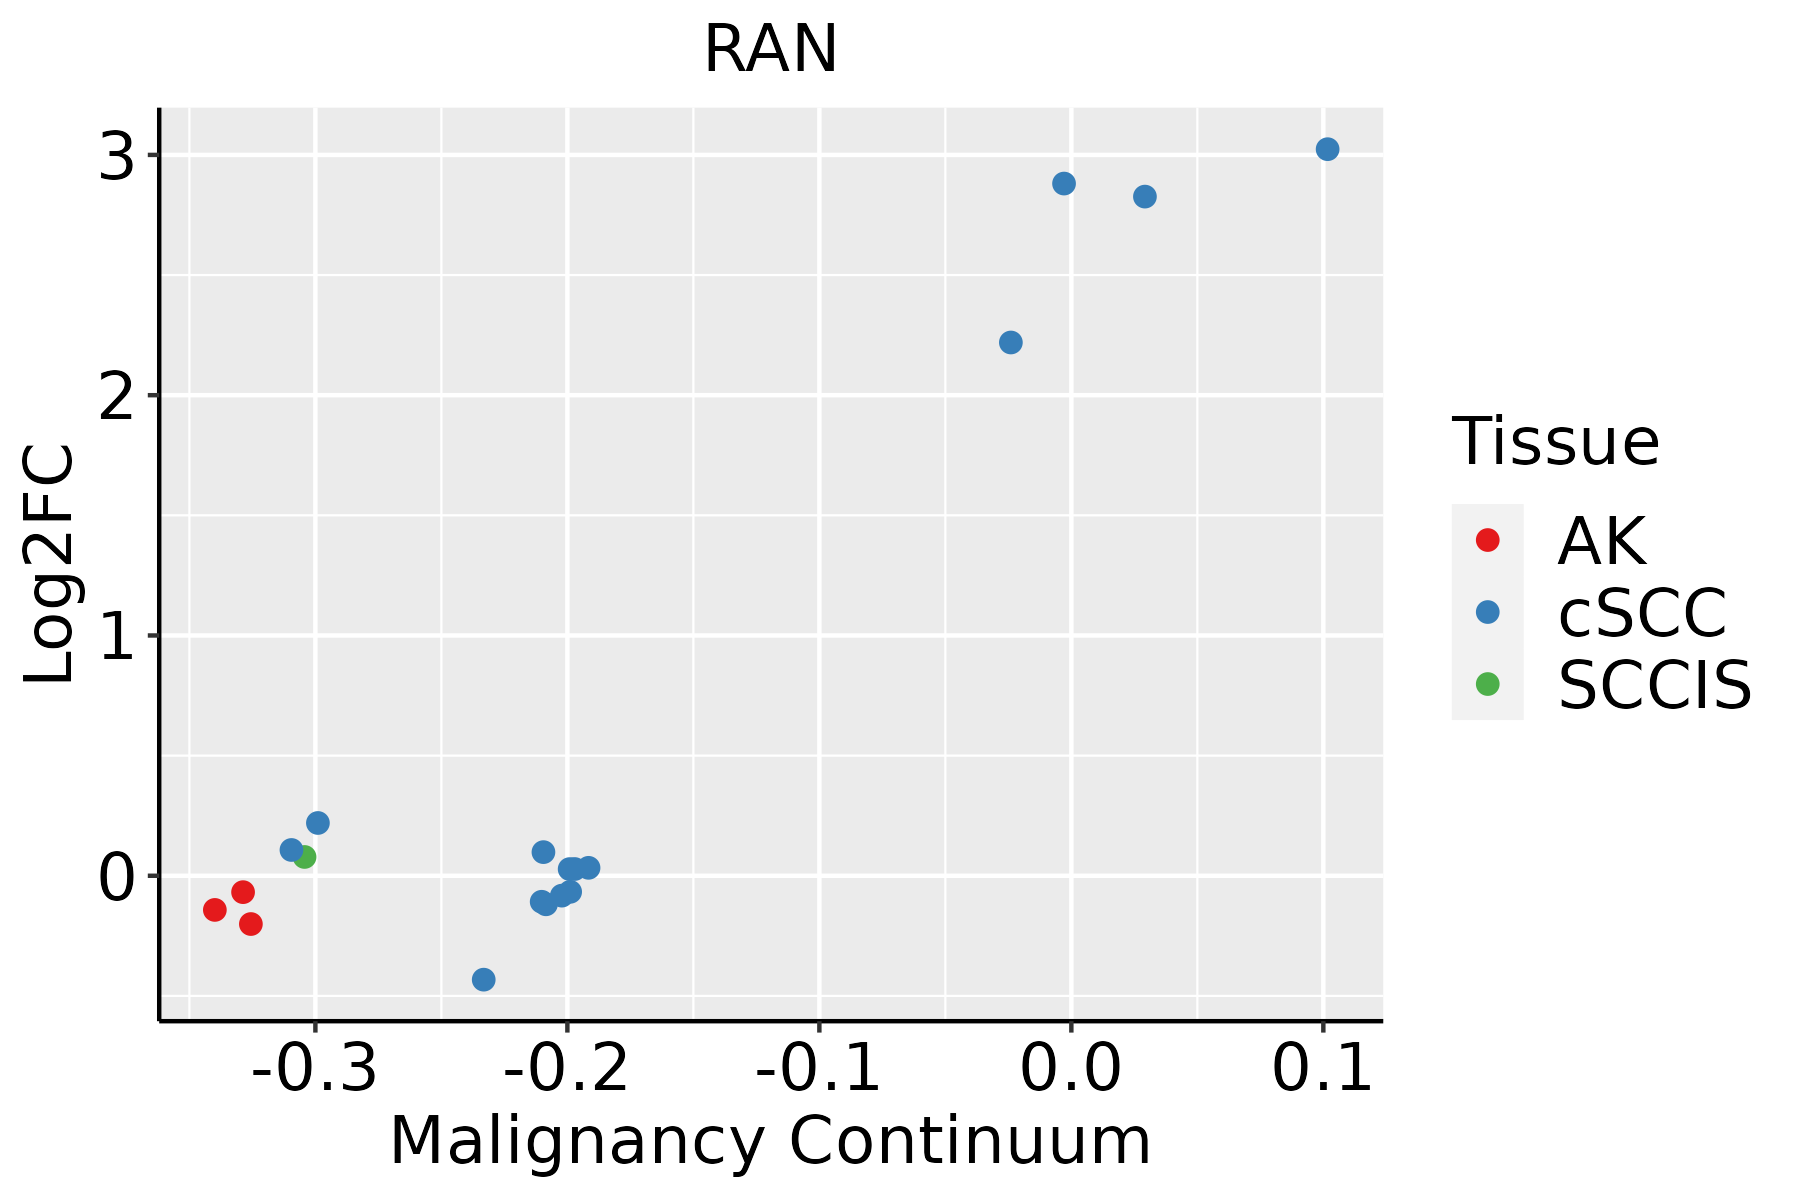 | AK: Actinic keratosis |
| cSCC: Cutaneous squamous cell carcinoma | ||
| SCCIS:squamous cell carcinoma in situ | ||
| Thyroid | 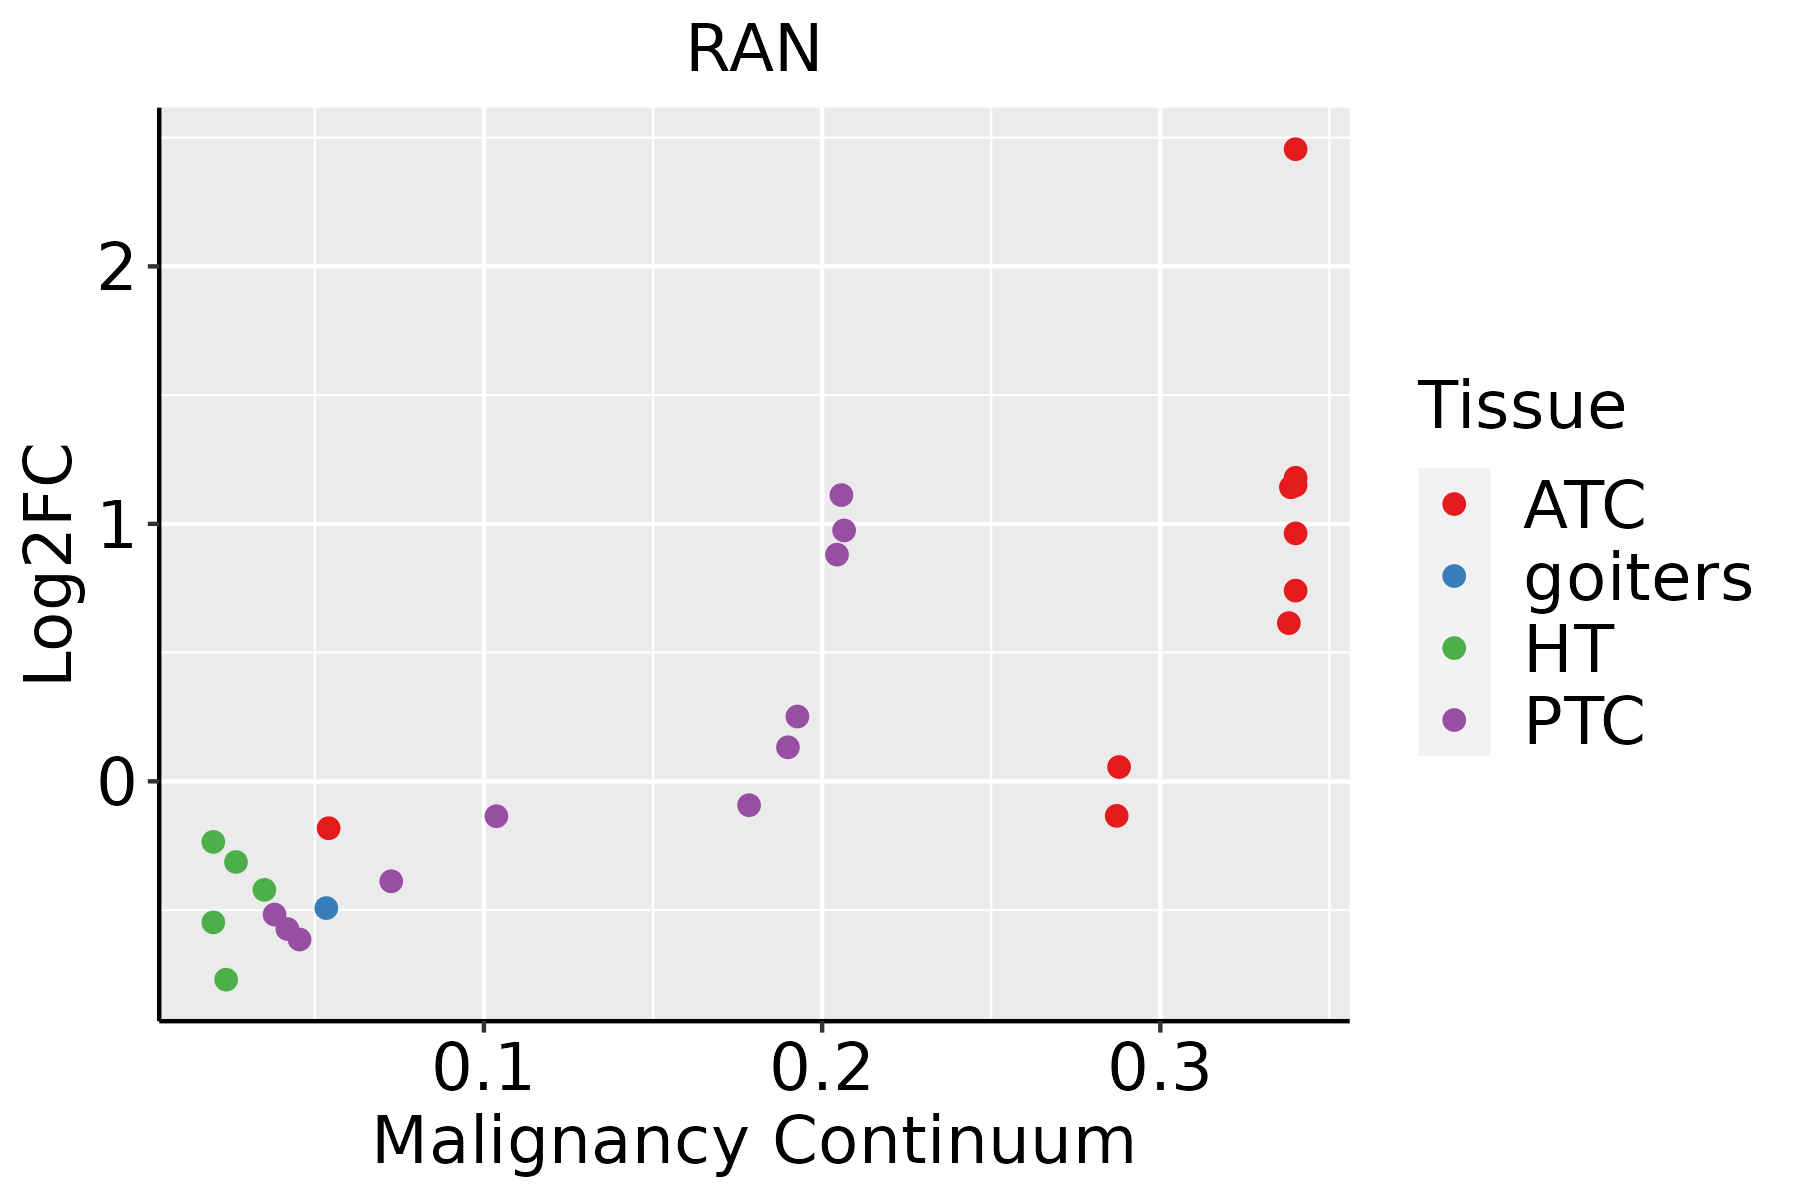 | ATC: Anaplastic thyroid cancer |
| HT: Hashimoto's thyroiditis | ||
| PTC: Papillary thyroid cancer |
| ∗log2FC in expression of this searched gene in stem-like cells from each diseased tissue sample relative to stem-like cells in normal samples in each tissue plotted against the malignancy continuum. Samples are colored based on if they are from different disease stage. |
Top |
Malignant transformation related pathway analysis |
| Find out the enriched GO biological processes and KEGG pathways involved in transition from healthy to precancer to cancer |
| Tissue | Disease Stage | Enriched GO biological Processes |
| Colorectum | AD |  |
| Colorectum | SER |  |
| Colorectum | MSS |  |
| Colorectum | MSI-H |  |
| Colorectum | FAP |  |
| ∗Top 15 enriched GO BP terms are showed in the bar plot of each disease state in each tissue. Each row represents a significant GO biological process which is colored according to the -log10(p.adjust). |
| Page: 1 2 3 4 5 6 7 8 9 |
| GO ID | Tissue | Disease Stage | Description | Gene Ratio | Bg Ratio | pvalue | p.adjust | Count |
| GO:004339315 | Endometrium | EEC | regulation of protein binding | 46/2168 | 196/18723 | 1.94e-06 | 5.80e-05 | 46 |
| GO:003315715 | Endometrium | EEC | regulation of intracellular protein transport | 51/2168 | 229/18723 | 2.89e-06 | 8.09e-05 | 51 |
| GO:000661114 | Endometrium | EEC | protein export from nucleus | 20/2168 | 57/18723 | 2.96e-06 | 8.25e-05 | 20 |
| GO:003238815 | Endometrium | EEC | positive regulation of intracellular transport | 46/2168 | 202/18723 | 4.64e-06 | 1.16e-04 | 46 |
| GO:003450413 | Endometrium | EEC | protein localization to nucleus | 60/2168 | 290/18723 | 5.09e-06 | 1.26e-04 | 60 |
| GO:003238613 | Endometrium | EEC | regulation of intracellular transport | 67/2168 | 337/18723 | 6.13e-06 | 1.48e-04 | 67 |
| GO:005165613 | Endometrium | EEC | establishment of organelle localization | 75/2168 | 390/18723 | 6.23e-06 | 1.49e-04 | 75 |
| GO:005065712 | Endometrium | EEC | nucleic acid transport | 39/2168 | 163/18723 | 7.00e-06 | 1.63e-04 | 39 |
| GO:005065812 | Endometrium | EEC | RNA transport | 39/2168 | 163/18723 | 7.00e-06 | 1.63e-04 | 39 |
| GO:009031613 | Endometrium | EEC | positive regulation of intracellular protein transport | 38/2168 | 160/18723 | 1.10e-05 | 2.32e-04 | 38 |
| GO:005123612 | Endometrium | EEC | establishment of RNA localization | 39/2168 | 166/18723 | 1.11e-05 | 2.33e-04 | 39 |
| GO:190018213 | Endometrium | EEC | positive regulation of protein localization to nucleus | 25/2168 | 87/18723 | 1.12e-05 | 2.34e-04 | 25 |
| GO:003209213 | Endometrium | EEC | positive regulation of protein binding | 24/2168 | 85/18723 | 2.29e-05 | 4.08e-04 | 24 |
| GO:000691314 | Endometrium | EEC | nucleocytoplasmic transport | 59/2168 | 301/18723 | 3.31e-05 | 5.65e-04 | 59 |
| GO:005116914 | Endometrium | EEC | nuclear transport | 59/2168 | 301/18723 | 3.31e-05 | 5.65e-04 | 59 |
| GO:000915017 | Endometrium | EEC | purine ribonucleotide metabolic process | 69/2168 | 368/18723 | 3.38e-05 | 5.77e-04 | 69 |
| GO:001593112 | Endometrium | EEC | nucleobase-containing compound transport | 46/2168 | 222/18723 | 5.91e-05 | 9.13e-04 | 46 |
| GO:005116814 | Endometrium | EEC | nuclear export | 35/2168 | 154/18723 | 6.36e-05 | 9.48e-04 | 35 |
| GO:190018013 | Endometrium | EEC | regulation of protein localization to nucleus | 32/2168 | 136/18723 | 6.37e-05 | 9.48e-04 | 32 |
| GO:004578713 | Endometrium | EEC | positive regulation of cell cycle | 59/2168 | 313/18723 | 1.04e-04 | 1.44e-03 | 59 |
| Page: 1 2 3 4 5 6 7 8 9 10 11 12 13 14 15 16 17 18 19 20 21 22 23 24 25 26 27 28 29 30 31 32 33 34 35 36 37 38 39 40 41 42 43 44 45 46 47 48 49 50 51 52 53 54 55 56 57 58 59 60 61 62 63 64 65 66 67 68 69 70 71 72 73 74 75 76 77 78 79 80 81 82 83 84 85 86 87 88 89 90 91 92 93 94 95 96 97 |
| Pathway ID | Tissue | Disease Stage | Description | Gene Ratio | Bg Ratio | pvalue | p.adjust | qvalue | Count |
| hsa0516618 | Breast | Precancer | Human T-cell leukemia virus 1 infection | 33/684 | 222/8465 | 4.29e-04 | 3.31e-03 | 2.53e-03 | 33 |
| hsa0516619 | Breast | Precancer | Human T-cell leukemia virus 1 infection | 33/684 | 222/8465 | 4.29e-04 | 3.31e-03 | 2.53e-03 | 33 |
| hsa0516624 | Breast | IDC | Human T-cell leukemia virus 1 infection | 40/867 | 222/8465 | 2.52e-04 | 2.21e-03 | 1.66e-03 | 40 |
| hsa0516634 | Breast | IDC | Human T-cell leukemia virus 1 infection | 40/867 | 222/8465 | 2.52e-04 | 2.21e-03 | 1.66e-03 | 40 |
| hsa0516642 | Breast | DCIS | Human T-cell leukemia virus 1 infection | 41/846 | 222/8465 | 7.03e-05 | 6.88e-04 | 5.07e-04 | 41 |
| hsa0516652 | Breast | DCIS | Human T-cell leukemia virus 1 infection | 41/846 | 222/8465 | 7.03e-05 | 6.88e-04 | 5.07e-04 | 41 |
| hsa0516620 | Cervix | CC | Human T-cell leukemia virus 1 infection | 61/1267 | 222/8465 | 8.13e-07 | 7.98e-06 | 4.72e-06 | 61 |
| hsa05166110 | Cervix | CC | Human T-cell leukemia virus 1 infection | 61/1267 | 222/8465 | 8.13e-07 | 7.98e-06 | 4.72e-06 | 61 |
| hsa0516643 | Cervix | N_HPV | Human T-cell leukemia virus 1 infection | 22/349 | 222/8465 | 1.17e-04 | 1.18e-03 | 9.23e-04 | 22 |
| hsa0516653 | Cervix | N_HPV | Human T-cell leukemia virus 1 infection | 22/349 | 222/8465 | 1.17e-04 | 1.18e-03 | 9.23e-04 | 22 |
| hsa05166 | Colorectum | AD | Human T-cell leukemia virus 1 infection | 72/2092 | 222/8465 | 5.24e-03 | 2.44e-02 | 1.55e-02 | 72 |
| hsa051661 | Colorectum | AD | Human T-cell leukemia virus 1 infection | 72/2092 | 222/8465 | 5.24e-03 | 2.44e-02 | 1.55e-02 | 72 |
| hsa051662 | Colorectum | MSS | Human T-cell leukemia virus 1 infection | 68/1875 | 222/8465 | 1.84e-03 | 9.61e-03 | 5.89e-03 | 68 |
| hsa03250 | Colorectum | MSS | Viral life cycle - HIV-1 | 23/1875 | 63/8465 | 6.55e-03 | 2.64e-02 | 1.62e-02 | 23 |
| hsa051663 | Colorectum | MSS | Human T-cell leukemia virus 1 infection | 68/1875 | 222/8465 | 1.84e-03 | 9.61e-03 | 5.89e-03 | 68 |
| hsa032501 | Colorectum | MSS | Viral life cycle - HIV-1 | 23/1875 | 63/8465 | 6.55e-03 | 2.64e-02 | 1.62e-02 | 23 |
| hsa0516626 | Endometrium | AEH | Human T-cell leukemia virus 1 infection | 50/1197 | 222/8465 | 4.30e-04 | 3.11e-03 | 2.27e-03 | 50 |
| hsa05166111 | Endometrium | AEH | Human T-cell leukemia virus 1 infection | 50/1197 | 222/8465 | 4.30e-04 | 3.11e-03 | 2.27e-03 | 50 |
| hsa0516627 | Endometrium | EEC | Human T-cell leukemia virus 1 infection | 52/1237 | 222/8465 | 2.73e-04 | 2.36e-03 | 1.76e-03 | 52 |
| hsa0516636 | Endometrium | EEC | Human T-cell leukemia virus 1 infection | 52/1237 | 222/8465 | 2.73e-04 | 2.36e-03 | 1.76e-03 | 52 |
| Page: 1 2 3 4 |
Top |
Cell-cell communication analysis |
| Identification of potential cell-cell interactions between two cell types and their ligand-receptor pairs for different disease states |
| Ligand | Receptor | LRpair | Pathway | Tissue | Disease Stage |
| Page: 1 |
Top |
Single-cell gene regulatory network inference analysis |
| Find out the significant the regulons (TFs) and the target genes of each regulon across cell types for different disease states |
| TF | Cell Type | Tissue | Disease Stage | Target Gene | RSS | Regulon Activity |
| ∗The dot plots of a searched regulon are shown for all cell subpopulations in each disease state of each tissue based on the regulon specific score inferred using pySCENIC and by calculating the average expression. |
| Page: 1 |
Top |
Somatic mutation of malignant transformation related genes |
| Annotation of somatic variants for genes involved in malignant transformation |
| Hugo Symbol | Variant Class | Variant Classification | dbSNP RS | HGVSc | HGVSp | HGVSp Short | SWISSPROT | BIOTYPE | SIFT | PolyPhen | Tumor Sample Barcode | Tissue | Histology | Sex | Age | Stage | Therapy Types | Drugs | Outcome |
| RAN | SNV | Missense_Mutation | novel | c.203N>A | p.Gly68Asp | p.G68D | P62826 | protein_coding | deleterious(0) | probably_damaging(0.957) | TCGA-AC-A8OS-01 | Breast | breast invasive carcinoma | Female | >=65 | I/II | Unknown | Unknown | SD |
| RAN | insertion | Frame_Shift_Ins | novel | c.620_621insCCATGAAATTAACCAGTGTCTATTATATA | p.Ala208HisfsTer52 | p.A208Hfs*52 | P62826 | protein_coding | TCGA-A2-A04Q-01 | Breast | breast invasive carcinoma | Female | <65 | I/II | Chemotherapy | adriamycin | SD | ||
| RAN | deletion | Frame_Shift_Del | c.329delN | p.Arg110GlnfsTer22 | p.R110Qfs*22 | P62826 | protein_coding | TCGA-D8-A140-01 | Breast | breast invasive carcinoma | Female | <65 | I/II | Chemotherapy | doxorubicin+cyclophosphamid | SD | |||
| RAN | SNV | Missense_Mutation | novel | c.640N>A | p.Asp214Asn | p.D214N | P62826 | protein_coding | deleterious(0.03) | benign(0.031) | TCGA-C5-A2LZ-01 | Cervix | cervical & endocervical cancer | Female | >=65 | III/IV | Unknown | Unknown | PD |
| RAN | SNV | Missense_Mutation | c.628N>A | p.Pro210Thr | p.P210T | P62826 | protein_coding | deleterious(0) | probably_damaging(0.945) | TCGA-A6-2686-01 | Colorectum | colon adenocarcinoma | Female | >=65 | I/II | Unknown | Unknown | SD | |
| RAN | SNV | Missense_Mutation | rs201928609 | c.562N>T | p.Val188Phe | p.V188F | P62826 | protein_coding | tolerated(0.06) | benign(0) | TCGA-A6-5662-01 | Colorectum | colon adenocarcinoma | Male | <65 | I/II | Chemotherapy | oxaliplatin | PD |
| RAN | SNV | Missense_Mutation | c.419N>A | p.Arg140Gln | p.R140Q | P62826 | protein_coding | tolerated(0.06) | benign(0.16) | TCGA-A6-6653-01 | Colorectum | colon adenocarcinoma | Male | >=65 | I/II | Unknown | Unknown | SD | |
| RAN | SNV | Missense_Mutation | c.547N>A | p.Ala183Thr | p.A183T | P62826 | protein_coding | tolerated(0.16) | benign(0.019) | TCGA-CK-5916-01 | Colorectum | colon adenocarcinoma | Female | >=65 | I/II | Unknown | Unknown | PD | |
| RAN | SNV | Missense_Mutation | c.542N>T | p.Ala181Val | p.A181V | P62826 | protein_coding | tolerated(0.06) | benign(0.019) | TCGA-CK-6746-01 | Colorectum | colon adenocarcinoma | Female | >=65 | I/II | Unknown | Unknown | SD | |
| RAN | SNV | Missense_Mutation | c.380N>C | p.Lys127Thr | p.K127T | P62826 | protein_coding | deleterious(0.03) | benign(0.271) | TCGA-AG-A002-01 | Colorectum | rectum adenocarcinoma | Male | <65 | I/II | Unknown | Unknown | SD |
| Page: 1 2 3 |
Top |
Related drugs of malignant transformation related genes |
| Identification of chemicals and drugs interact with genes involved in malignant transfromation |
| (DGIdb 4.0) |
| Entrez ID | Symbol | Category | Interaction Types | Drug Claim Name | Drug Name | PMIDs |
| Page: 1 |

Copyright 2023-Present -The University of Texas Health Science Center at Houston |