| Tissue | Expression Dynamics | Abbreviation |
| Breast | 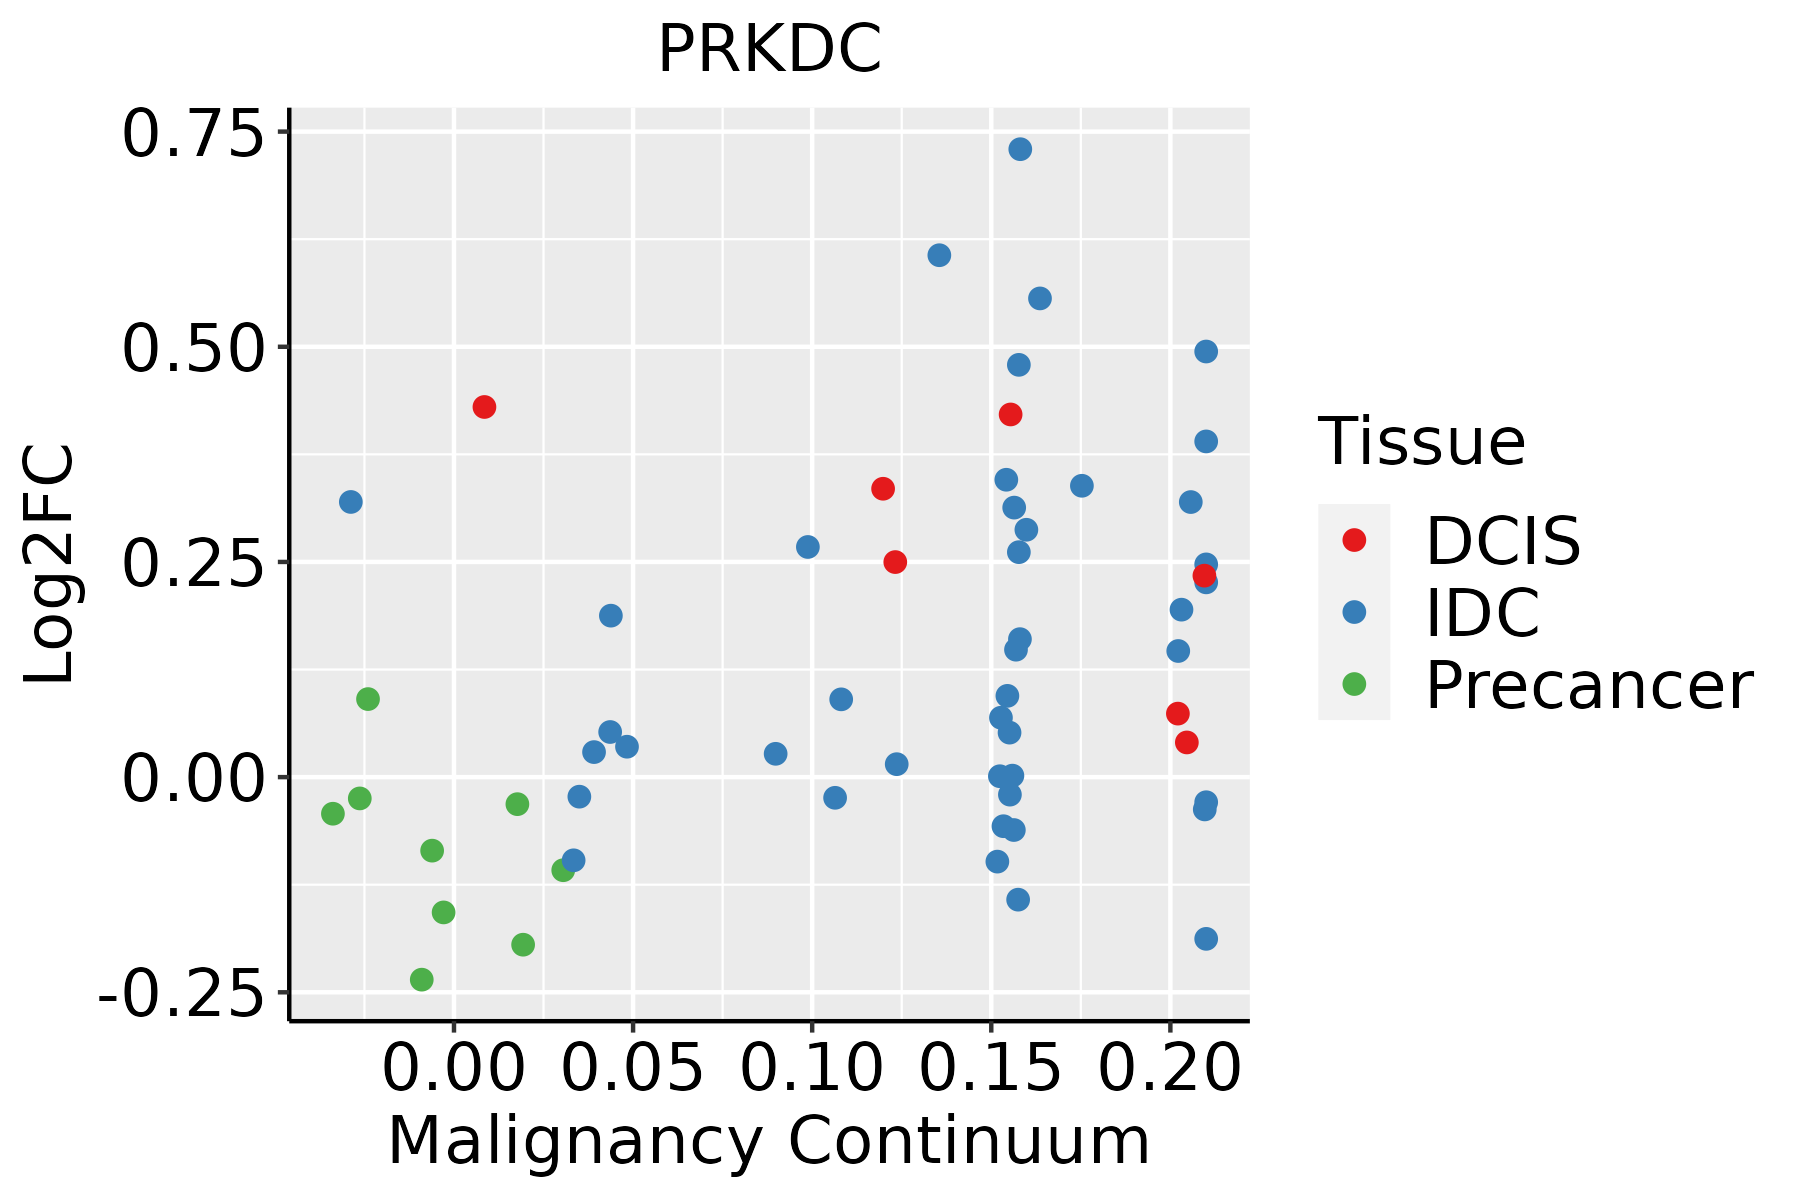 | IDC: Invasive ductal carcinoma |
| DCIS: Ductal carcinoma in situ |
| Precancer(BRCA1-mut): Precancerous lesion from BRCA1 mutation carriers |
| Cervix | 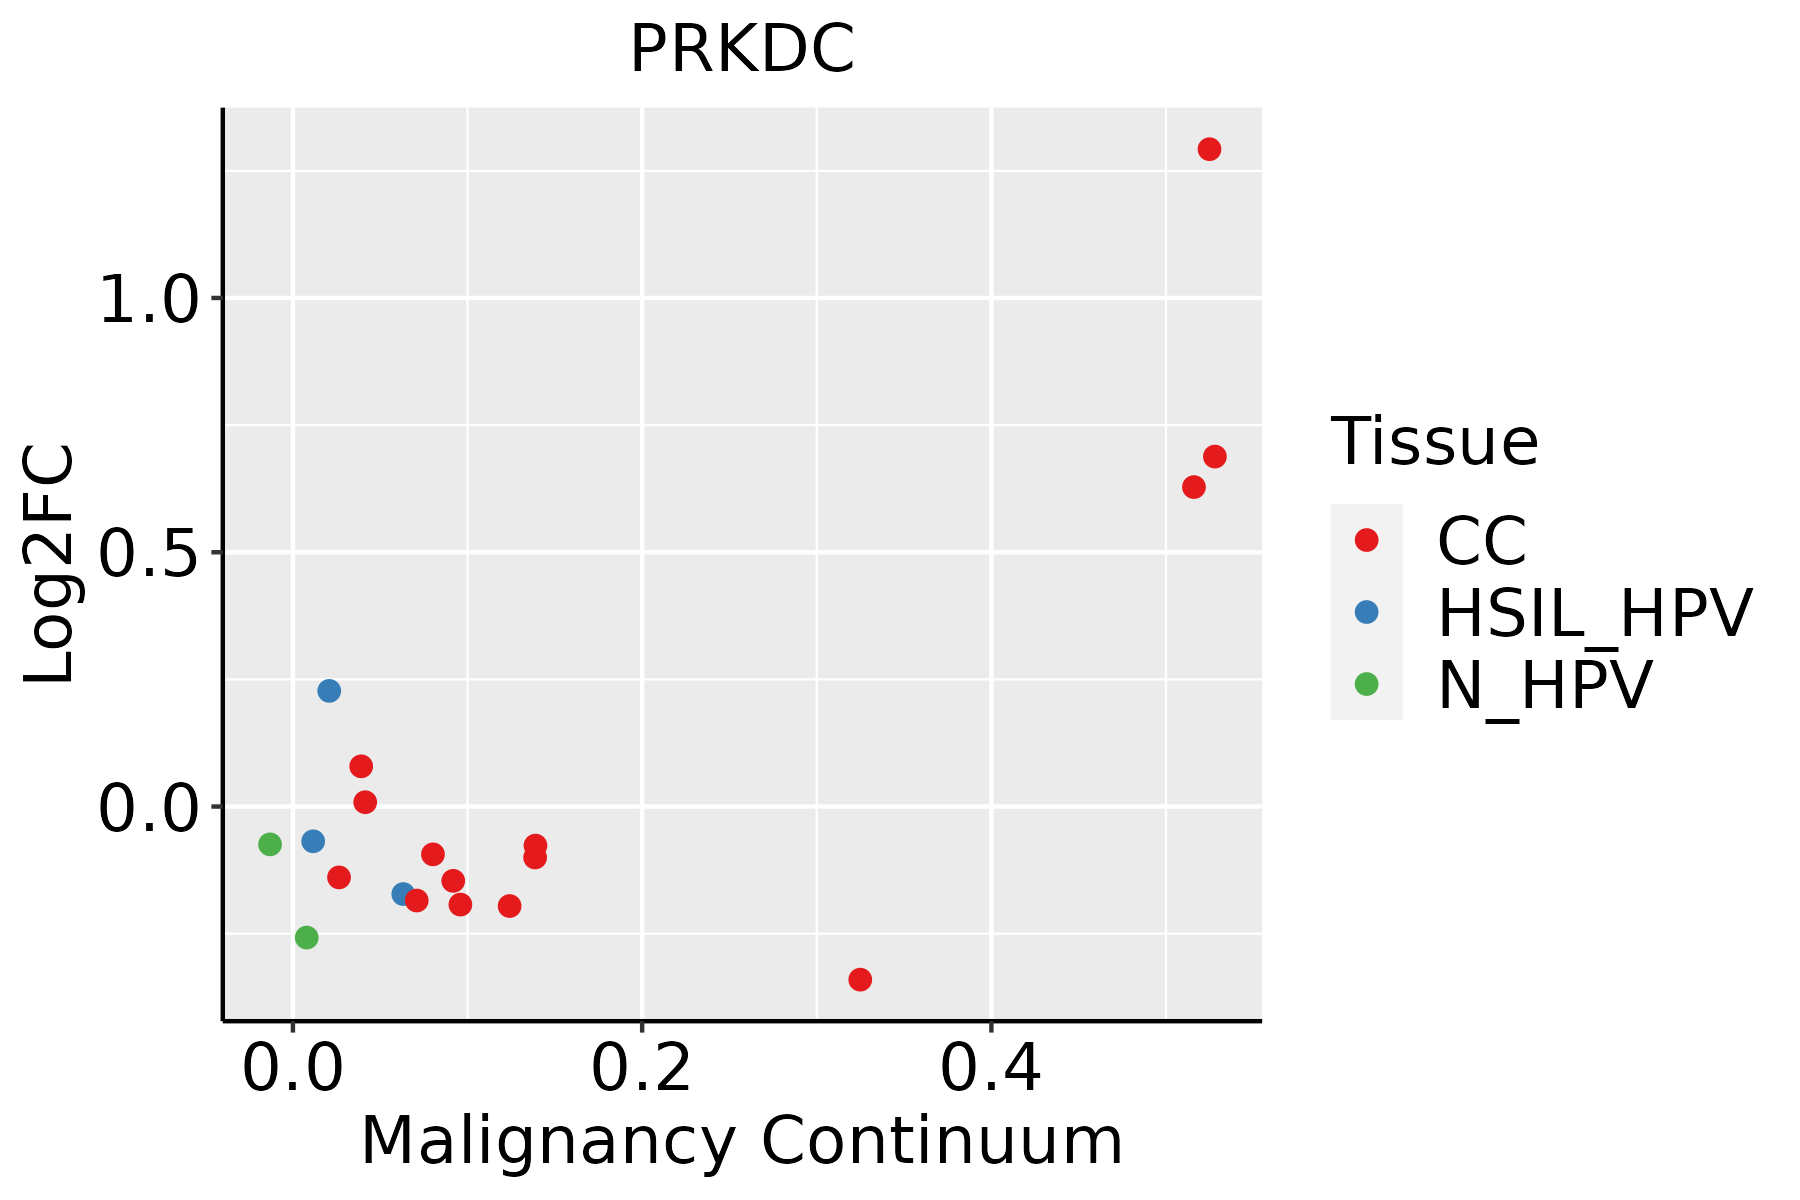 | CC: Cervix cancer |
| HSIL_HPV: HPV-infected high-grade squamous intraepithelial lesions |
| N_HPV: HPV-infected normal cervix |
| Esophagus | 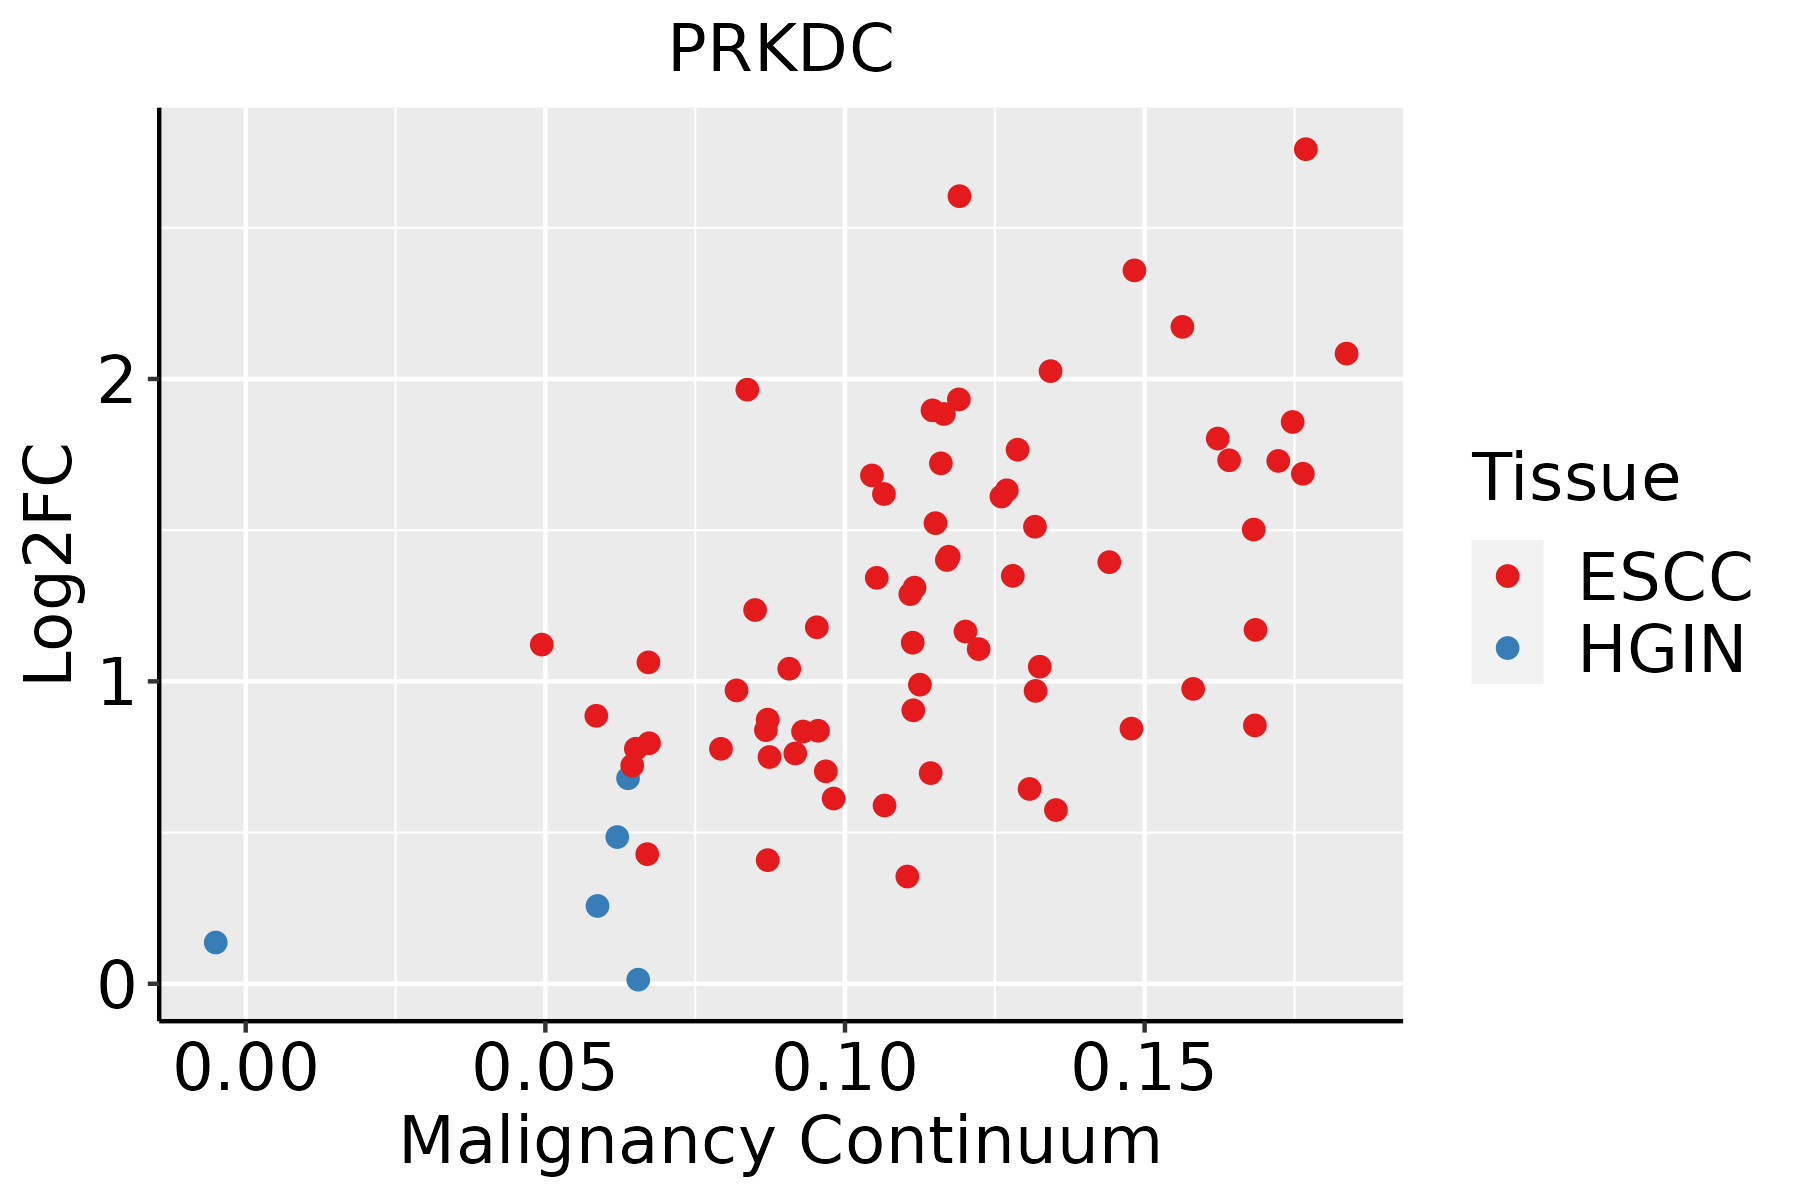 | ESCC: Esophageal squamous cell carcinoma |
| HGIN: High-grade intraepithelial neoplasias |
| LGIN: Low-grade intraepithelial neoplasias |
| Liver |  | HCC: Hepatocellular carcinoma |
| NAFLD: Non-alcoholic fatty liver disease |
| Lung | 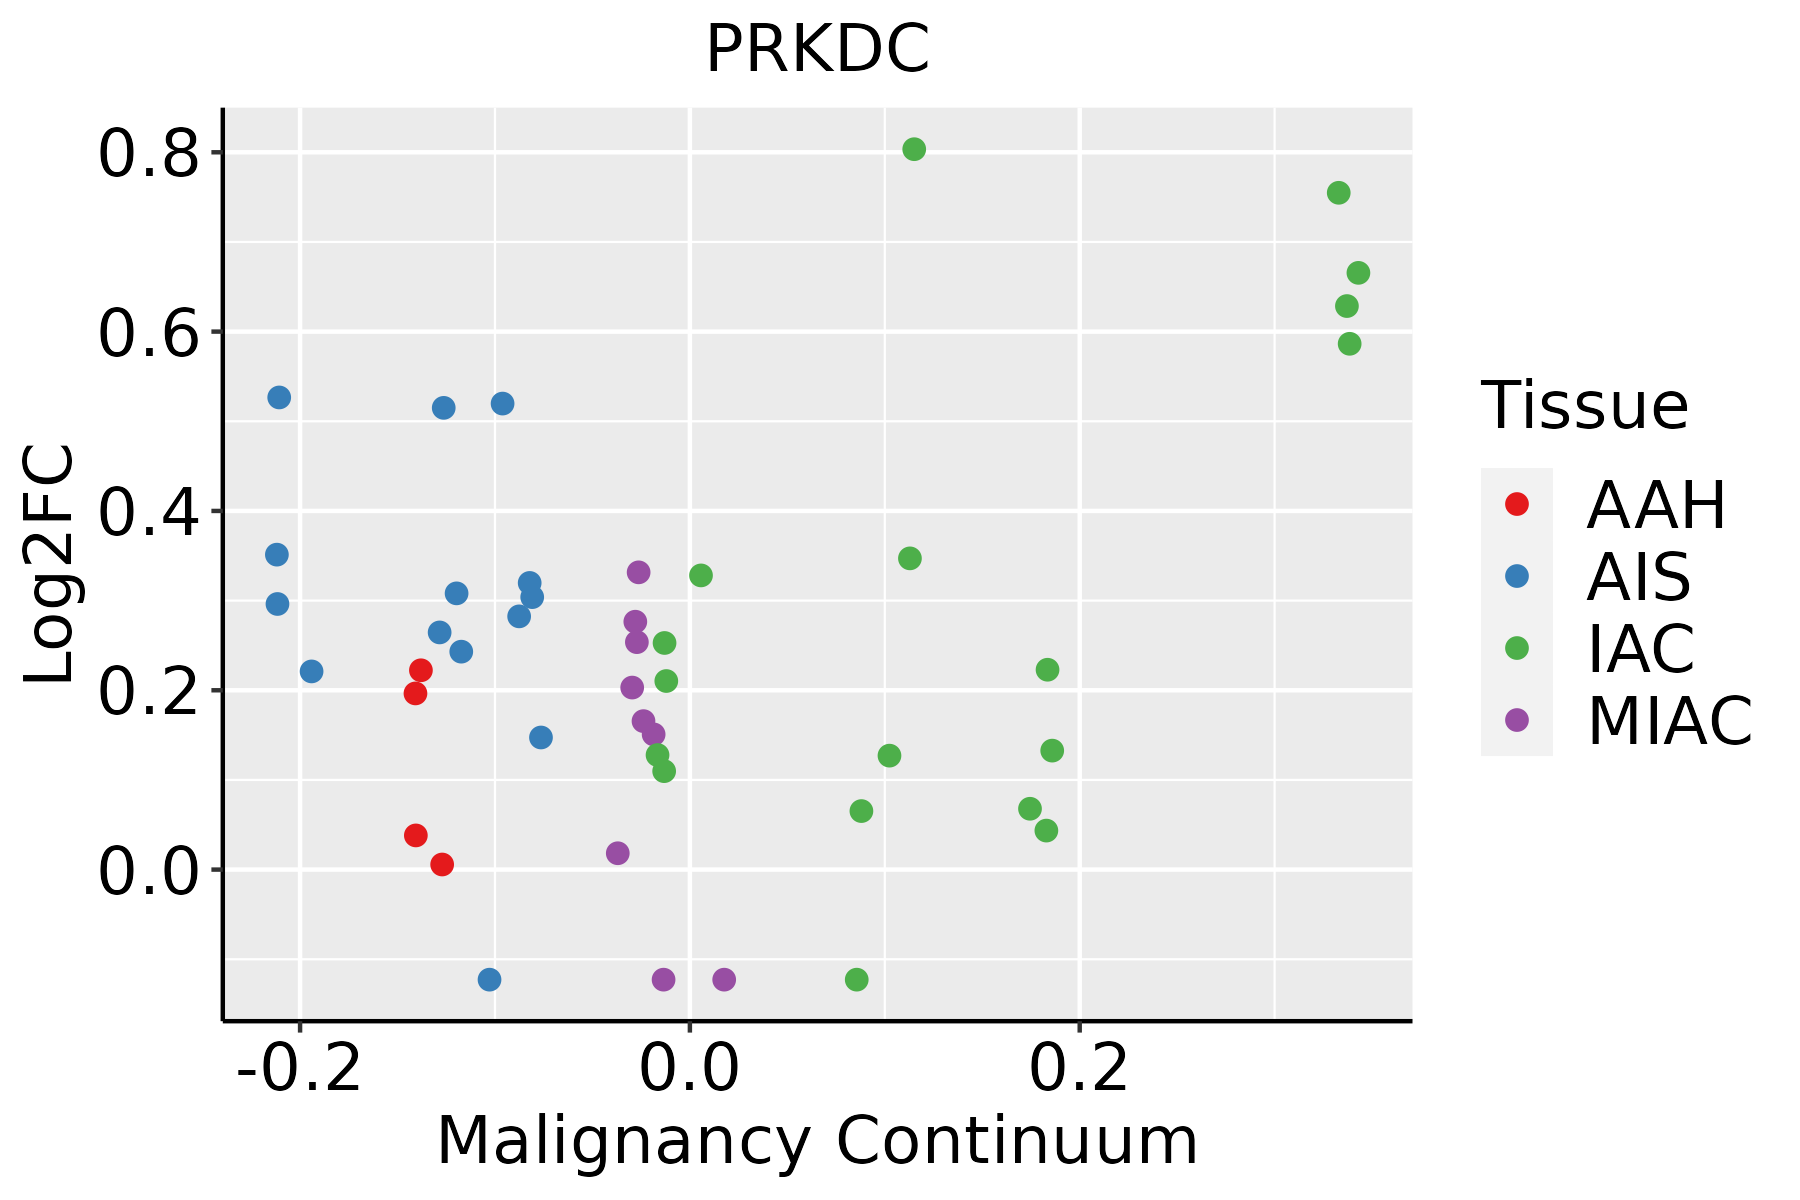 | AAH: Atypical adenomatous hyperplasia |
| AIS: Adenocarcinoma in situ |
| IAC: Invasive lung adenocarcinoma |
| MIA: Minimally invasive adenocarcinoma |
| Oral Cavity | 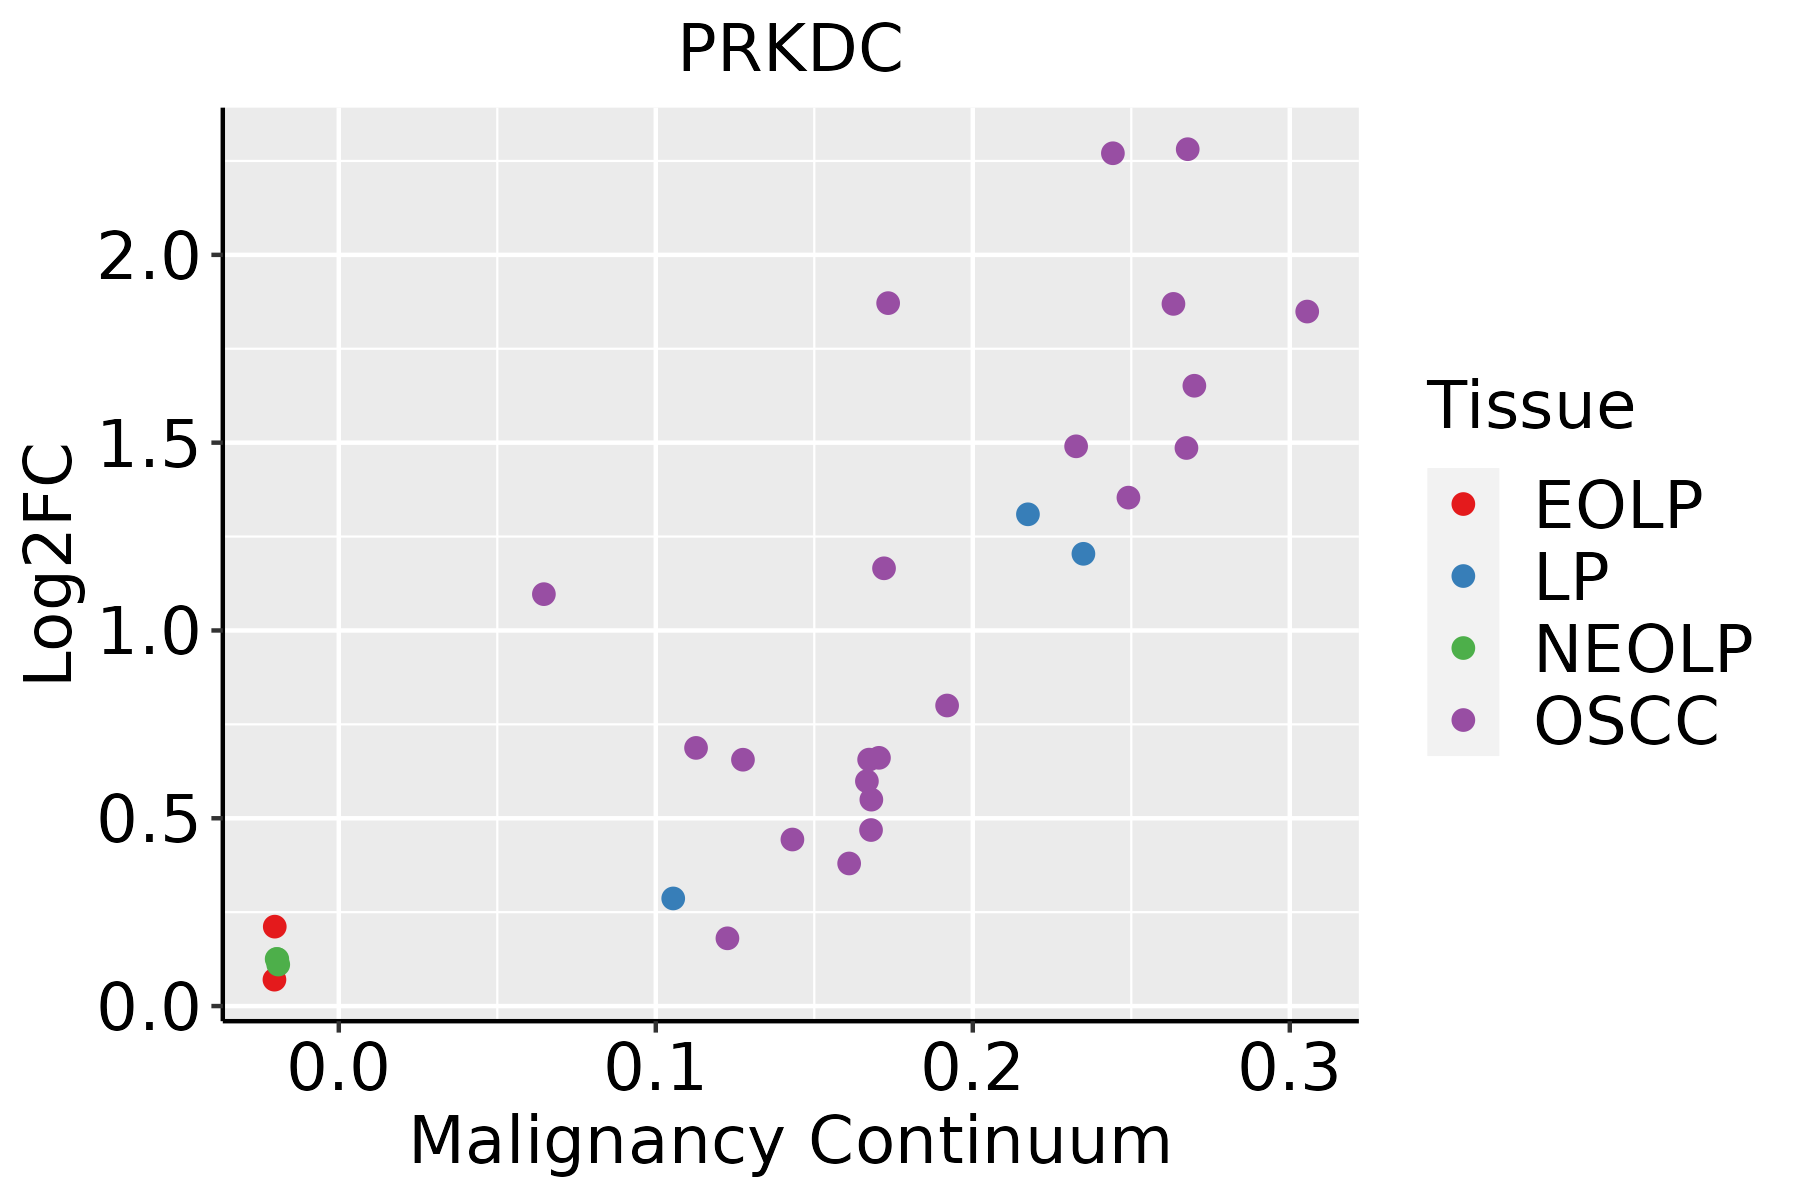 | EOLP: Erosive Oral lichen planus |
| LP: leukoplakia |
| NEOLP: Non-erosive oral lichen planus |
| OSCC: Oral squamous cell carcinoma |
| Prostate | 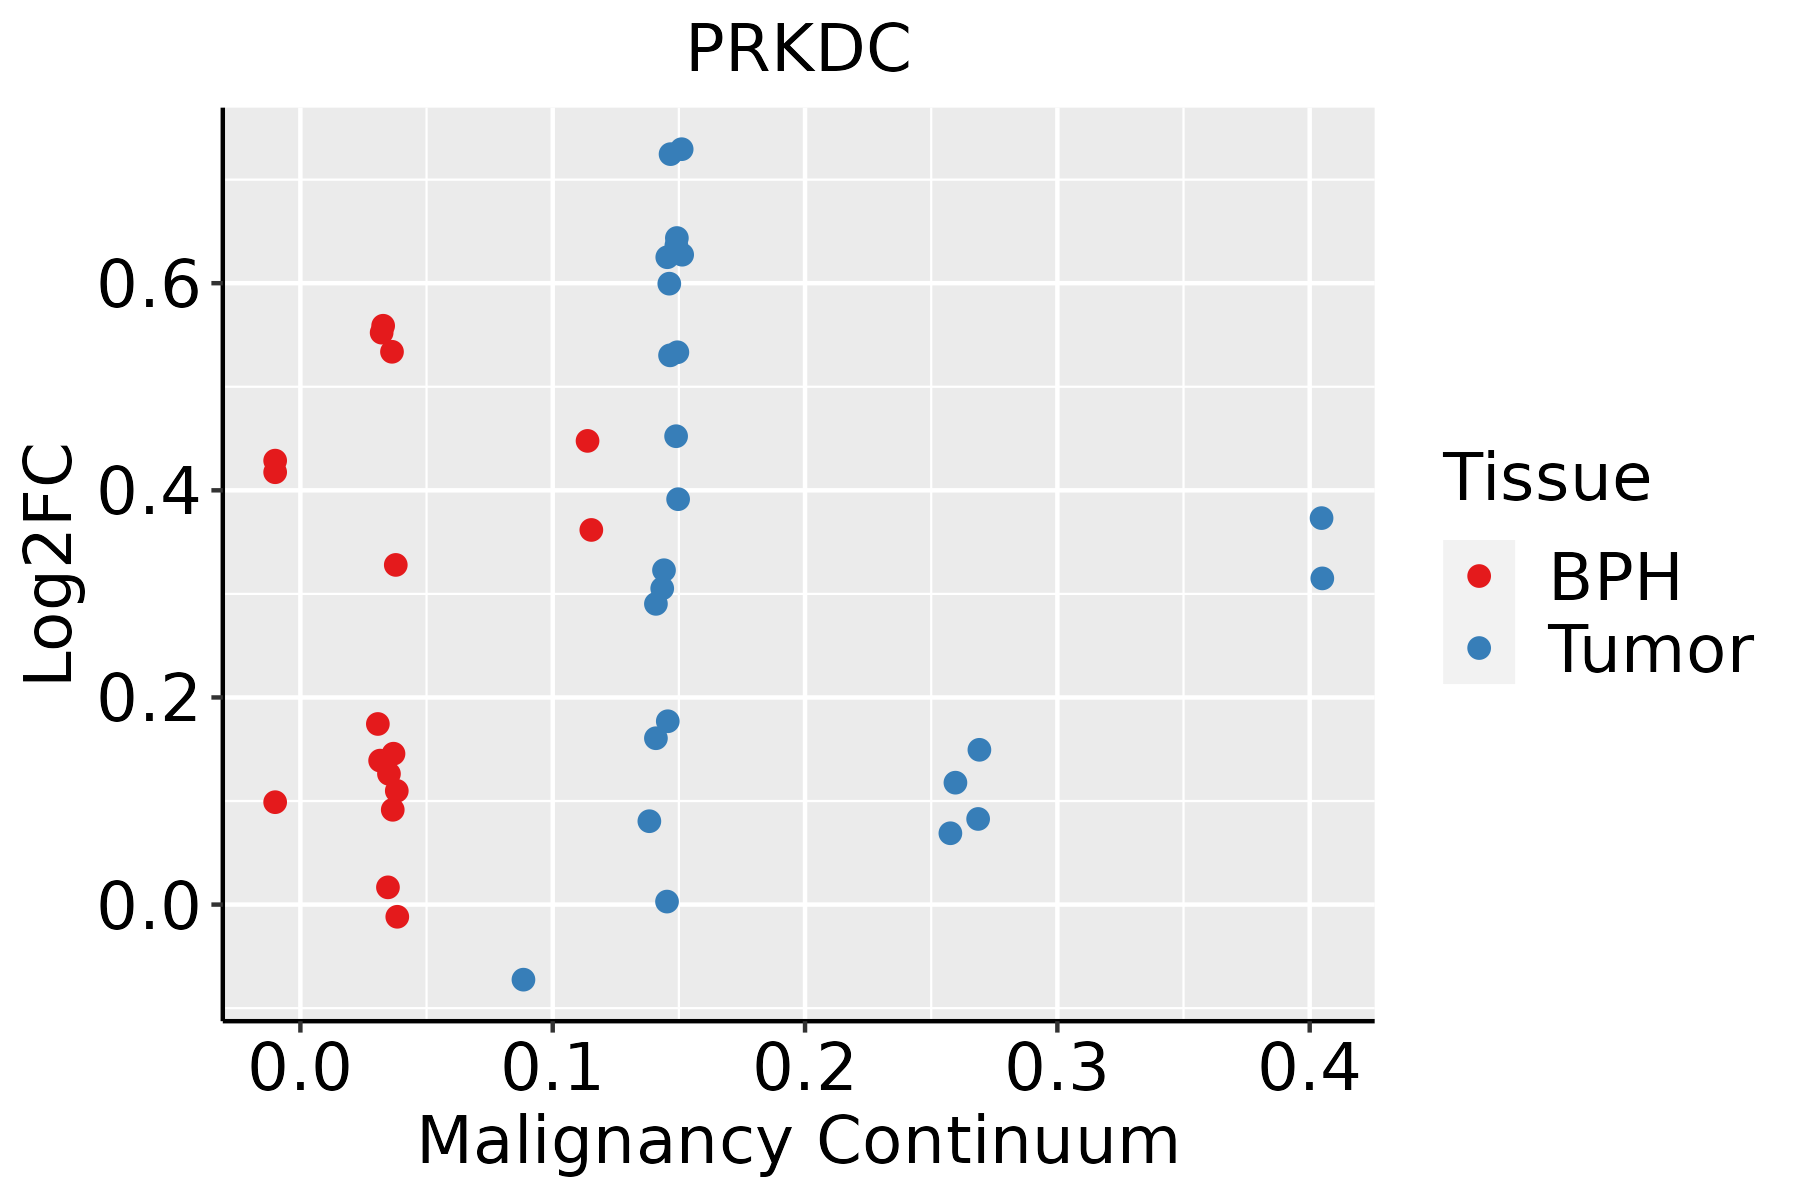 | BPH: Benign Prostatic Hyperplasia |
| Skin | 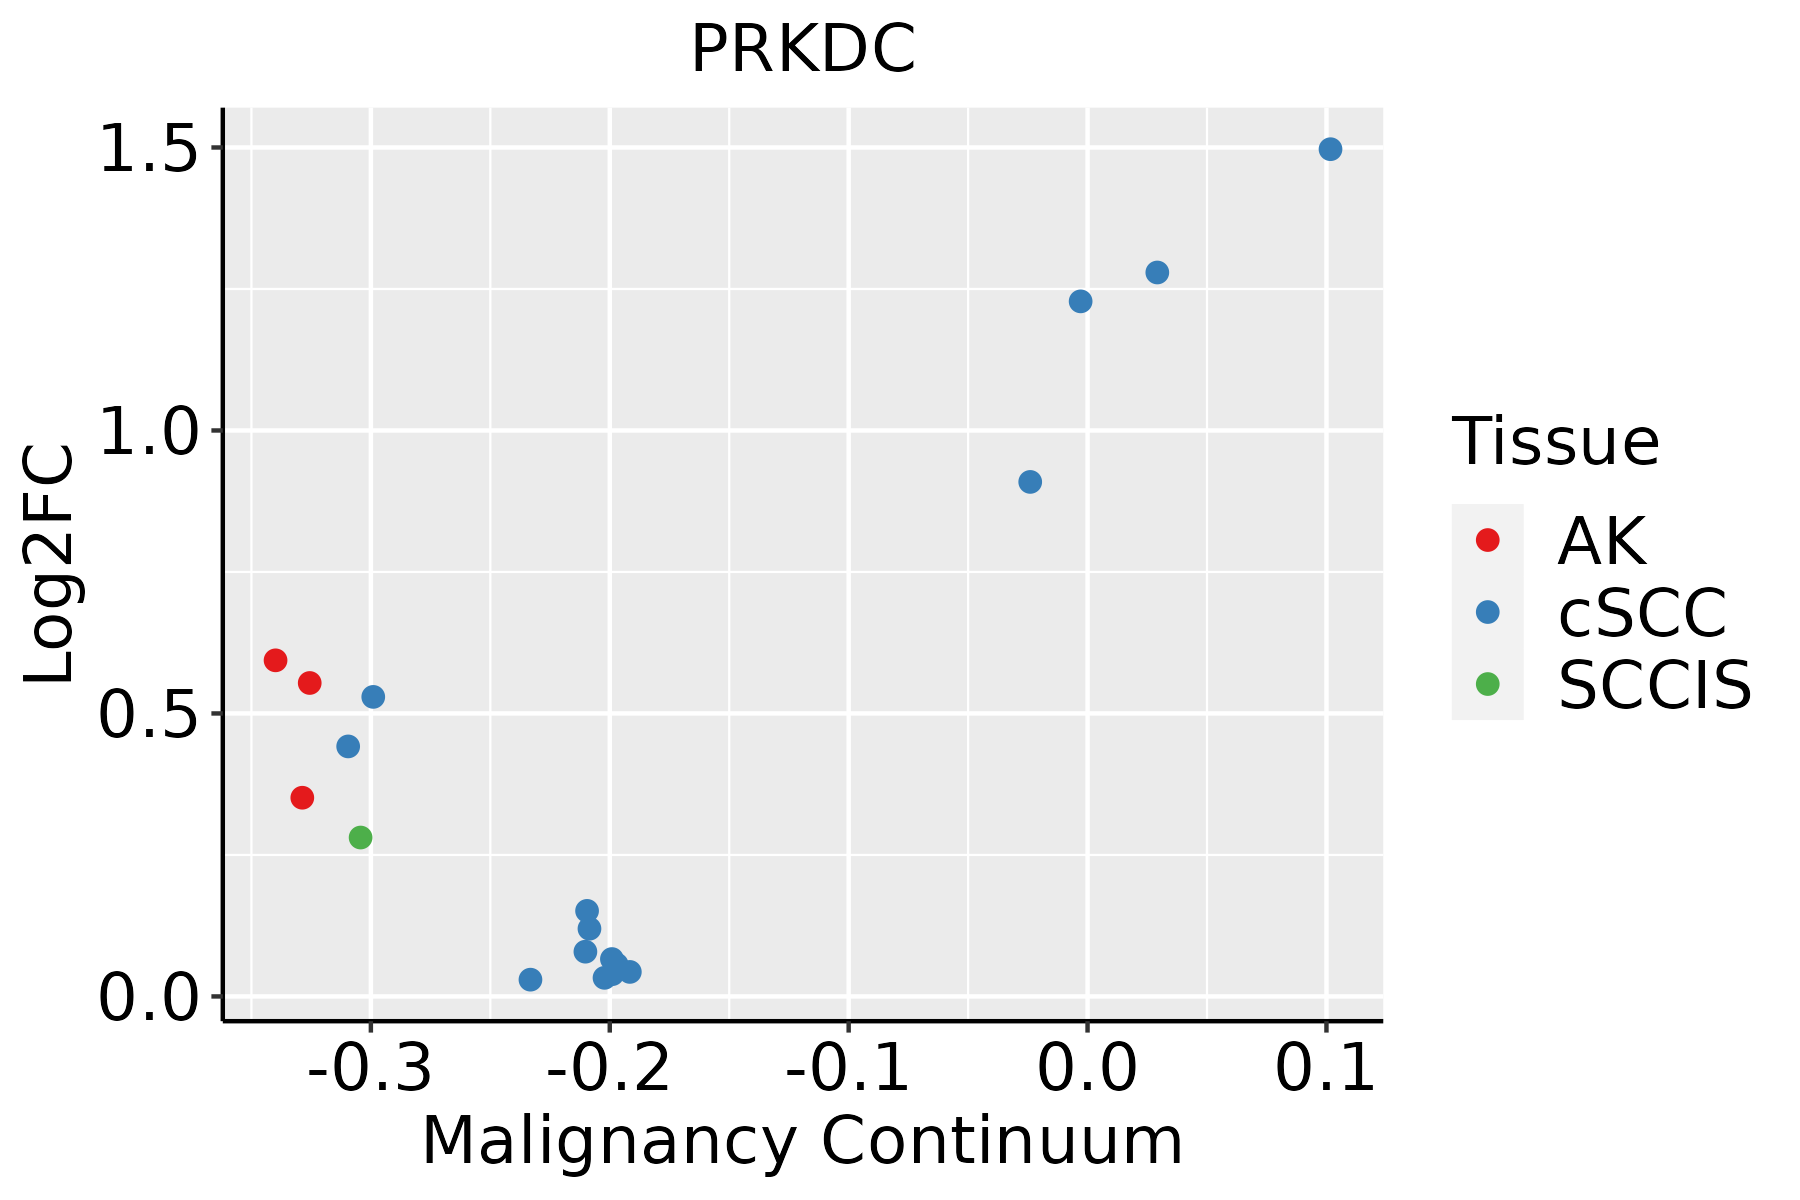 | AK: Actinic keratosis |
| cSCC: Cutaneous squamous cell carcinoma |
| SCCIS:squamous cell carcinoma in situ |
| Thyroid | 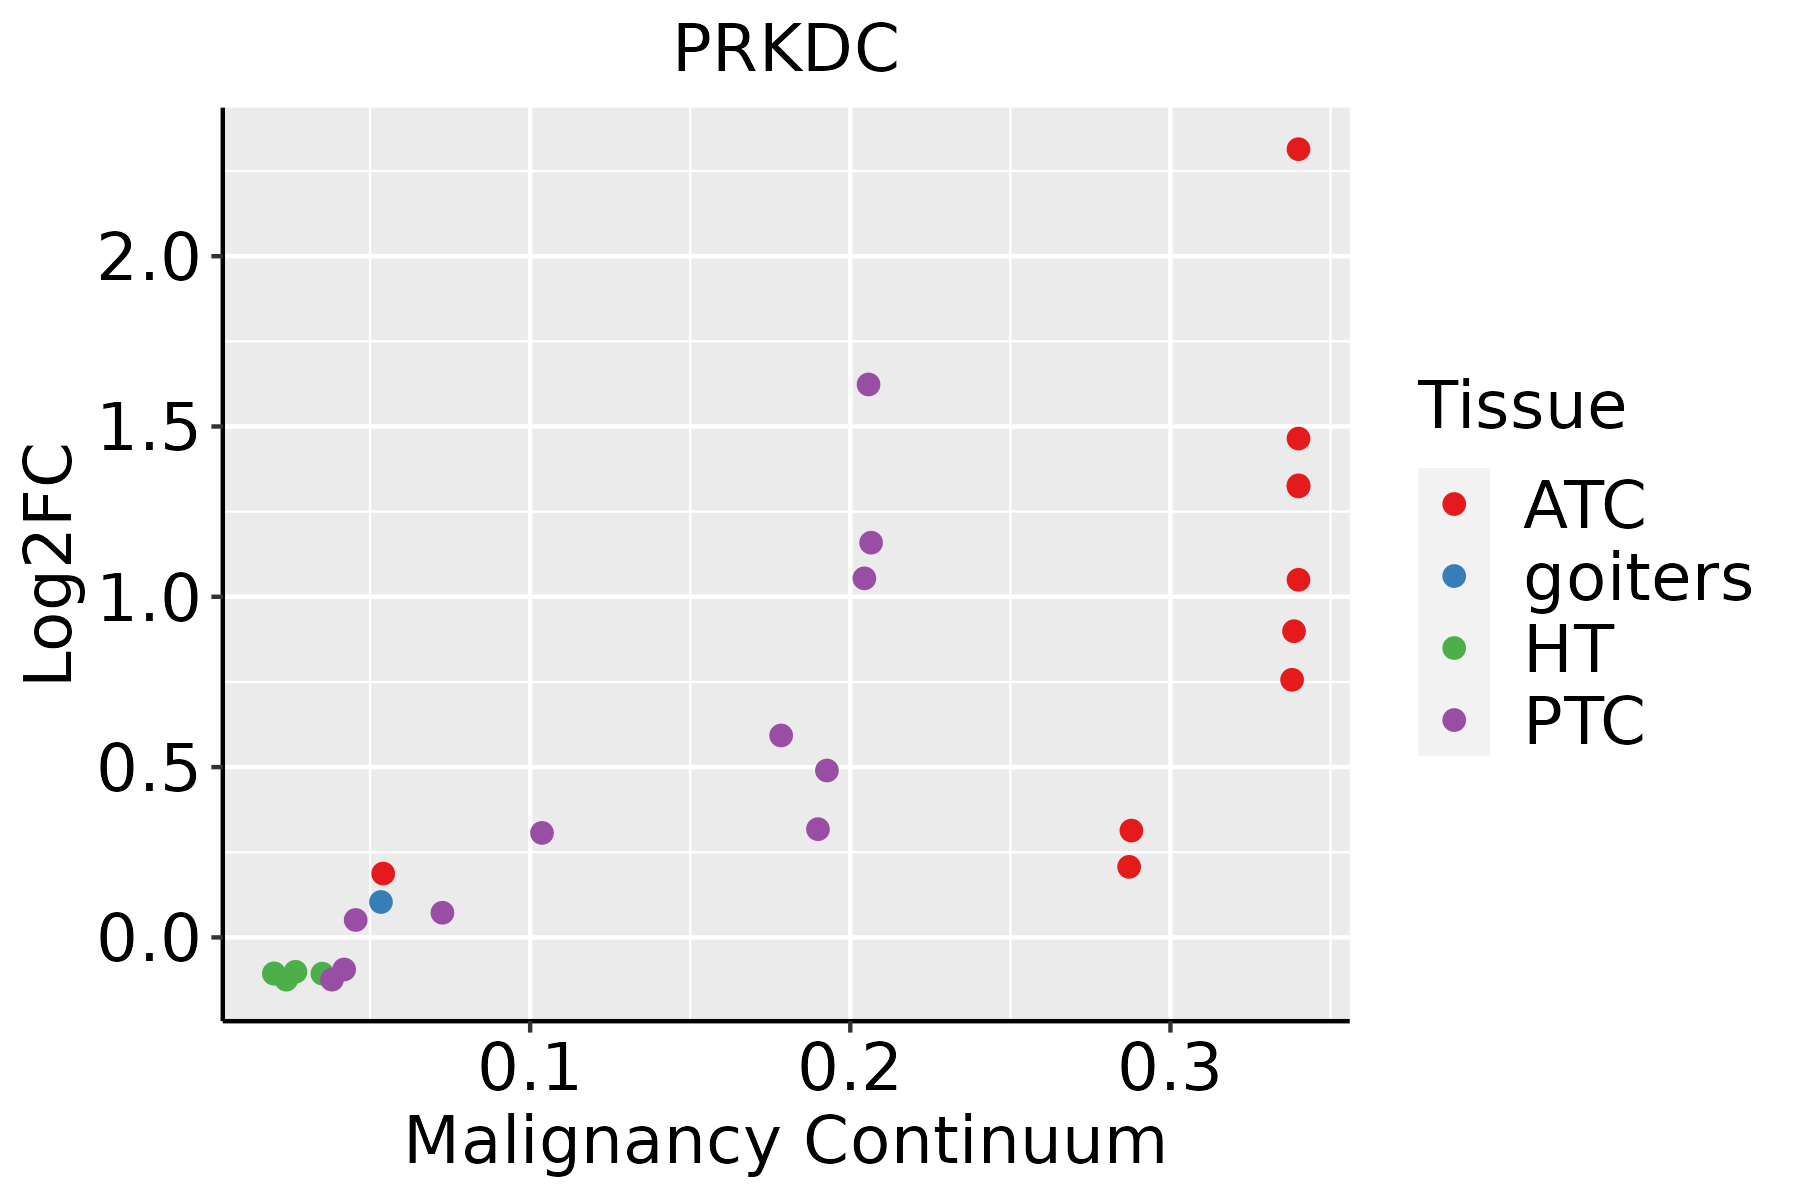 | ATC: Anaplastic thyroid cancer |
| HT: Hashimoto's thyroiditis |
| PTC: Papillary thyroid cancer |
| GO ID | Tissue | Disease Stage | Description | Gene Ratio | Bg Ratio | pvalue | p.adjust | Count |
| GO:001810515 | Esophagus | ESCC | peptidyl-serine phosphorylation | 184/8552 | 315/18723 | 3.22e-06 | 3.61e-05 | 184 |
| GO:190199113 | Esophagus | ESCC | negative regulation of mitotic cell cycle phase transition | 112/8552 | 179/18723 | 3.69e-06 | 4.03e-05 | 112 |
| GO:0043434111 | Esophagus | ESCC | response to peptide hormone | 234/8552 | 414/18723 | 4.93e-06 | 5.21e-05 | 234 |
| GO:002260420 | Esophagus | ESCC | regulation of cell morphogenesis | 180/8552 | 309/18723 | 5.19e-06 | 5.45e-05 | 180 |
| GO:004814414 | Esophagus | ESCC | fibroblast proliferation | 57/8552 | 81/18723 | 5.83e-06 | 6.03e-05 | 57 |
| GO:003286918 | Esophagus | ESCC | cellular response to insulin stimulus | 124/8552 | 203/18723 | 6.63e-06 | 6.75e-05 | 124 |
| GO:003286818 | Esophagus | ESCC | response to insulin | 156/8552 | 264/18723 | 7.21e-06 | 7.20e-05 | 156 |
| GO:004814514 | Esophagus | ESCC | regulation of fibroblast proliferation | 56/8552 | 80/18723 | 9.08e-06 | 8.71e-05 | 56 |
| GO:001072010 | Esophagus | ESCC | positive regulation of cell development | 172/8552 | 298/18723 | 1.74e-05 | 1.55e-04 | 172 |
| GO:003220014 | Esophagus | ESCC | telomere organization | 99/8552 | 159/18723 | 1.77e-05 | 1.57e-04 | 99 |
| GO:001033215 | Esophagus | ESCC | response to gamma radiation | 41/8552 | 56/18723 | 2.64e-05 | 2.21e-04 | 41 |
| GO:20010228 | Esophagus | ESCC | positive regulation of response to DNA damage stimulus | 69/8552 | 105/18723 | 2.66e-05 | 2.22e-04 | 69 |
| GO:007137516 | Esophagus | ESCC | cellular response to peptide hormone stimulus | 166/8552 | 290/18723 | 4.48e-05 | 3.55e-04 | 166 |
| GO:00062826 | Esophagus | ESCC | regulation of DNA repair | 82/8552 | 130/18723 | 4.65e-05 | 3.66e-04 | 82 |
| GO:00488638 | Esophagus | ESCC | stem cell differentiation | 122/8552 | 206/18723 | 5.95e-05 | 4.59e-04 | 122 |
| GO:004477312 | Esophagus | ESCC | mitotic DNA damage checkpoint | 54/8552 | 81/18723 | 1.09e-04 | 7.64e-04 | 54 |
| GO:005067318 | Esophagus | ESCC | epithelial cell proliferation | 238/8552 | 437/18723 | 1.19e-04 | 8.20e-04 | 238 |
| GO:003157116 | Esophagus | ESCC | mitotic G1 DNA damage checkpoint | 24/8552 | 30/18723 | 1.27e-04 | 8.67e-04 | 24 |
| GO:00447745 | Esophagus | ESCC | mitotic DNA integrity checkpoint | 56/8552 | 85/18723 | 1.34e-04 | 9.09e-04 | 56 |
| GO:00485386 | Esophagus | ESCC | thymus development | 33/8552 | 45/18723 | 1.54e-04 | 1.02e-03 | 33 |
| Hugo Symbol | Variant Class | Variant Classification | dbSNP RS | HGVSc | HGVSp | HGVSp Short | SWISSPROT | BIOTYPE | SIFT | PolyPhen | Tumor Sample Barcode | Tissue | Histology | Sex | Age | Stage | Therapy Types | Drugs | Outcome |
| PRKDC | SNV | Missense_Mutation | | c.1855G>C | p.Asp619His | p.D619H | P78527 | protein_coding | deleterious(0) | probably_damaging(0.998) | TCGA-3C-AALI-01 | Breast | breast invasive carcinoma | Female | <65 | I/II | Unspecific | Poly E | Complete Response |
| PRKDC | SNV | Missense_Mutation | novel | c.3658N>G | p.Leu1220Val | p.L1220V | P78527 | protein_coding | deleterious(0.01) | possibly_damaging(0.622) | TCGA-5L-AAT1-01 | Breast | breast invasive carcinoma | Female | <65 | III/IV | Hormone Therapy | letrozol | SD |
| PRKDC | SNV | Missense_Mutation | novel | c.1504N>A | p.Glu502Lys | p.E502K | P78527 | protein_coding | tolerated(0.18) | benign(0.076) | TCGA-5L-AAT1-01 | Breast | breast invasive carcinoma | Female | <65 | III/IV | Hormone Therapy | letrozol | SD |
| PRKDC | SNV | Missense_Mutation | novel | c.5396N>G | p.Glu1799Gly | p.E1799G | P78527 | protein_coding | tolerated(0.13) | benign(0.118) | TCGA-A2-A0EQ-01 | Breast | breast invasive carcinoma | Female | <65 | I/II | Chemotherapy | adriamycin | SD |
| PRKDC | SNV | Missense_Mutation | | c.9458C>G | p.Ser3153Cys | p.S3153C | P78527 | protein_coding | deleterious(0) | possibly_damaging(0.907) | TCGA-A7-A13D-01 | Breast | breast invasive carcinoma | Female | <65 | I/II | Chemotherapy | cytoxan | SD |
| PRKDC | SNV | Missense_Mutation | novel | c.5745N>C | p.Leu1915Phe | p.L1915F | P78527 | protein_coding | deleterious(0) | probably_damaging(0.914) | TCGA-A7-A6VV-01 | Breast | breast invasive carcinoma | Female | <65 | I/II | Chemotherapy | cyclophosphamide | CR |
| PRKDC | SNV | Missense_Mutation | | c.2706A>T | p.Lys902Asn | p.K902N | P78527 | protein_coding | deleterious(0) | probably_damaging(0.998) | TCGA-A7-A6VX-01 | Breast | breast invasive carcinoma | Female | >=65 | I/II | Chemotherapy | docetaxel | CR |
| PRKDC | SNV | Missense_Mutation | | c.2210N>T | p.Pro737Leu | p.P737L | P78527 | protein_coding | deleterious(0.01) | benign(0.354) | TCGA-A8-A099-01 | Breast | breast invasive carcinoma | Female | >=65 | III/IV | Hormone Therapy | exemestane | SD |
| PRKDC | SNV | Missense_Mutation | | c.6367N>T | p.Pro2123Ser | p.P2123S | P78527 | protein_coding | deleterious(0) | probably_damaging(0.999) | TCGA-AC-A23H-01 | Breast | breast invasive carcinoma | Female | >=65 | I/II | Unknown | Unknown | PD |
| PRKDC | SNV | Missense_Mutation | | c.3394N>A | p.Asp1132Asn | p.D1132N | P78527 | protein_coding | tolerated(0.21) | benign(0.055) | TCGA-AC-A23H-01 | Breast | breast invasive carcinoma | Female | >=65 | I/II | Unknown | Unknown | PD |
| Entrez ID | Symbol | Category | Interaction Types | Drug Claim Name | Drug Name | PMIDs |
| 5591 | PRKDC | TRANSCRIPTION FACTOR COMPLEX, SERINE THREONINE KINASE, KINASE, DRUGGABLE GENOME, ENZYME, PHOSPHATIDYLINOSITOL 3 KINASE, CLINICALLY ACTIONABLE | inhibitor | 252827496 | | |
| 5591 | PRKDC | TRANSCRIPTION FACTOR COMPLEX, SERINE THREONINE KINASE, KINASE, DRUGGABLE GENOME, ENZYME, PHOSPHATIDYLINOSITOL 3 KINASE, CLINICALLY ACTIONABLE | | M9831 | | |
| 5591 | PRKDC | TRANSCRIPTION FACTOR COMPLEX, SERINE THREONINE KINASE, KINASE, DRUGGABLE GENOME, ENZYME, PHOSPHATIDYLINOSITOL 3 KINASE, CLINICALLY ACTIONABLE | | KU-0060648 | CHEMBL1086377 | 23855836 |
| 5591 | PRKDC | TRANSCRIPTION FACTOR COMPLEX, SERINE THREONINE KINASE, KINASE, DRUGGABLE GENOME, ENZYME, PHOSPHATIDYLINOSITOL 3 KINASE, CLINICALLY ACTIONABLE | inhibitor | 178102582 | | |
| 5591 | PRKDC | TRANSCRIPTION FACTOR COMPLEX, SERINE THREONINE KINASE, KINASE, DRUGGABLE GENOME, ENZYME, PHOSPHATIDYLINOSITOL 3 KINASE, CLINICALLY ACTIONABLE | inhibitor | 249565693 | | |
| 5591 | PRKDC | TRANSCRIPTION FACTOR COMPLEX, SERINE THREONINE KINASE, KINASE, DRUGGABLE GENOME, ENZYME, PHOSPHATIDYLINOSITOL 3 KINASE, CLINICALLY ACTIONABLE | inhibitor | 354702239 | | |
| 5591 | PRKDC | TRANSCRIPTION FACTOR COMPLEX, SERINE THREONINE KINASE, KINASE, DRUGGABLE GENOME, ENZYME, PHOSPHATIDYLINOSITOL 3 KINASE, CLINICALLY ACTIONABLE | inhibitor | 178102681 | WORTMANNIN | |
| 5591 | PRKDC | TRANSCRIPTION FACTOR COMPLEX, SERINE THREONINE KINASE, KINASE, DRUGGABLE GENOME, ENZYME, PHOSPHATIDYLINOSITOL 3 KINASE, CLINICALLY ACTIONABLE | | SF1126 | | |
| 5591 | PRKDC | TRANSCRIPTION FACTOR COMPLEX, SERINE THREONINE KINASE, KINASE, DRUGGABLE GENOME, ENZYME, PHOSPHATIDYLINOSITOL 3 KINASE, CLINICALLY ACTIONABLE | inhibitor | 249565692 | | |
| 5591 | PRKDC | TRANSCRIPTION FACTOR COMPLEX, SERINE THREONINE KINASE, KINASE, DRUGGABLE GENOME, ENZYME, PHOSPHATIDYLINOSITOL 3 KINASE, CLINICALLY ACTIONABLE | inhibitor | 404859048 | | |


