| Tissue | Expression Dynamics | Abbreviation |
| Cervix | 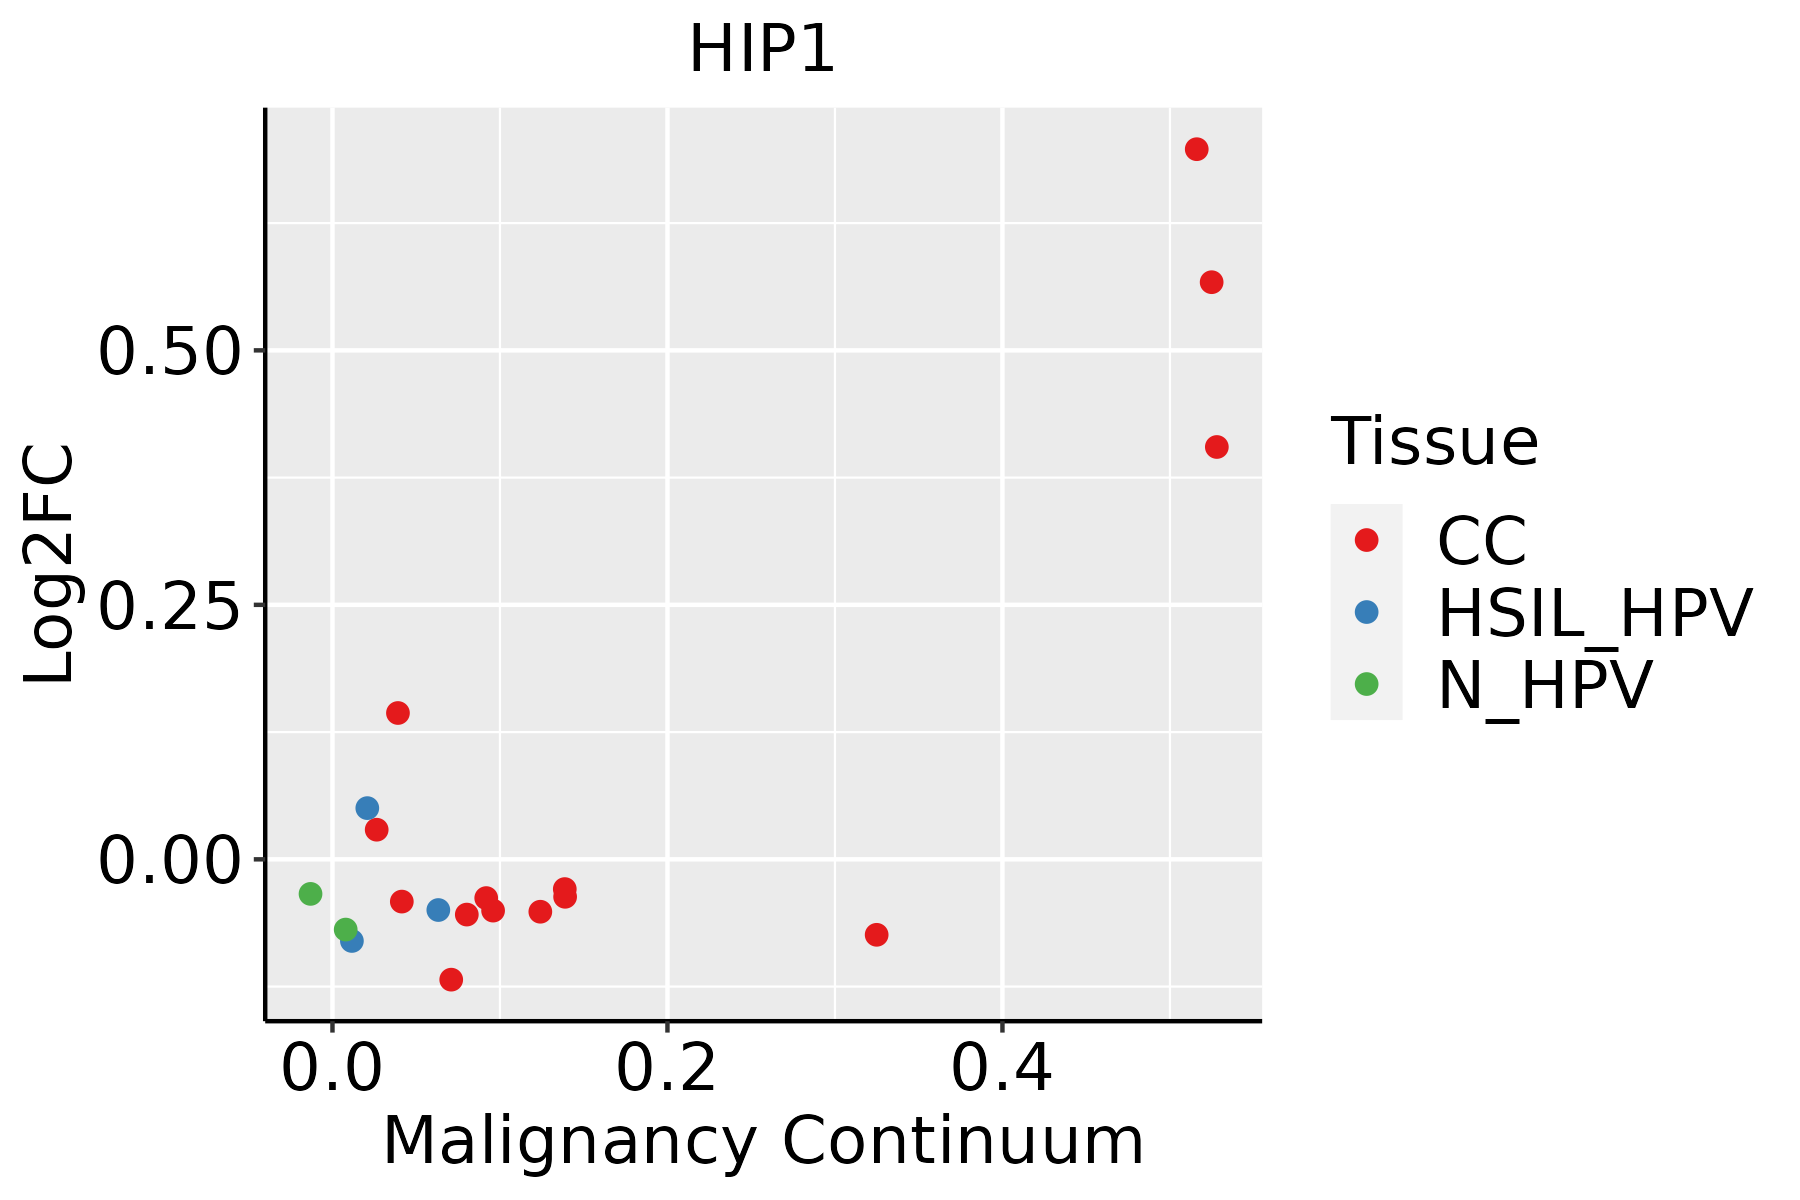 | CC: Cervix cancer |
| HSIL_HPV: HPV-infected high-grade squamous intraepithelial lesions |
| N_HPV: HPV-infected normal cervix |
| Colorectum (GSE201348) | 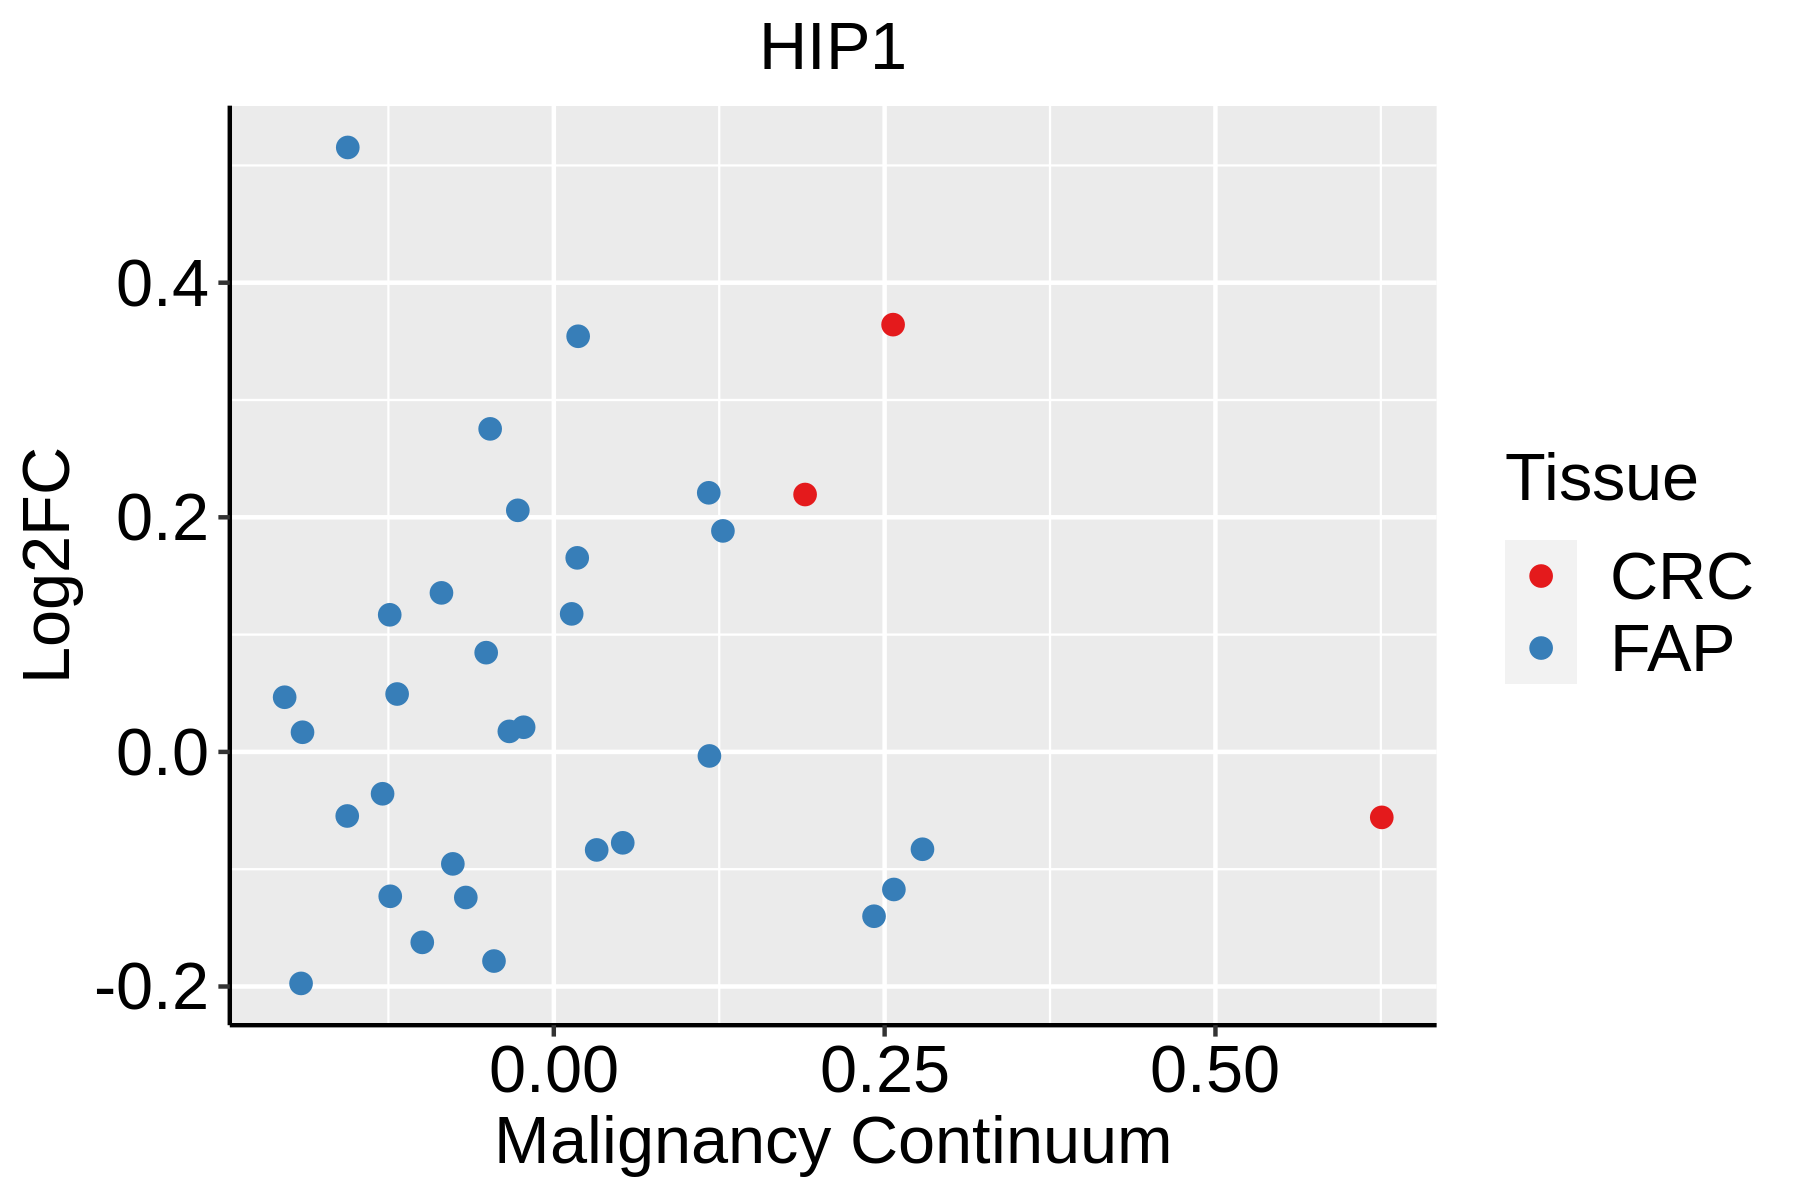 | FAP: Familial adenomatous polyposis |
| CRC: Colorectal cancer |
| Colorectum (HTA11) |  | AD: Adenomas |
| SER: Sessile serrated lesions |
| MSI-H: Microsatellite-high colorectal cancer |
| MSS: Microsatellite stable colorectal cancer |
| Endometrium | 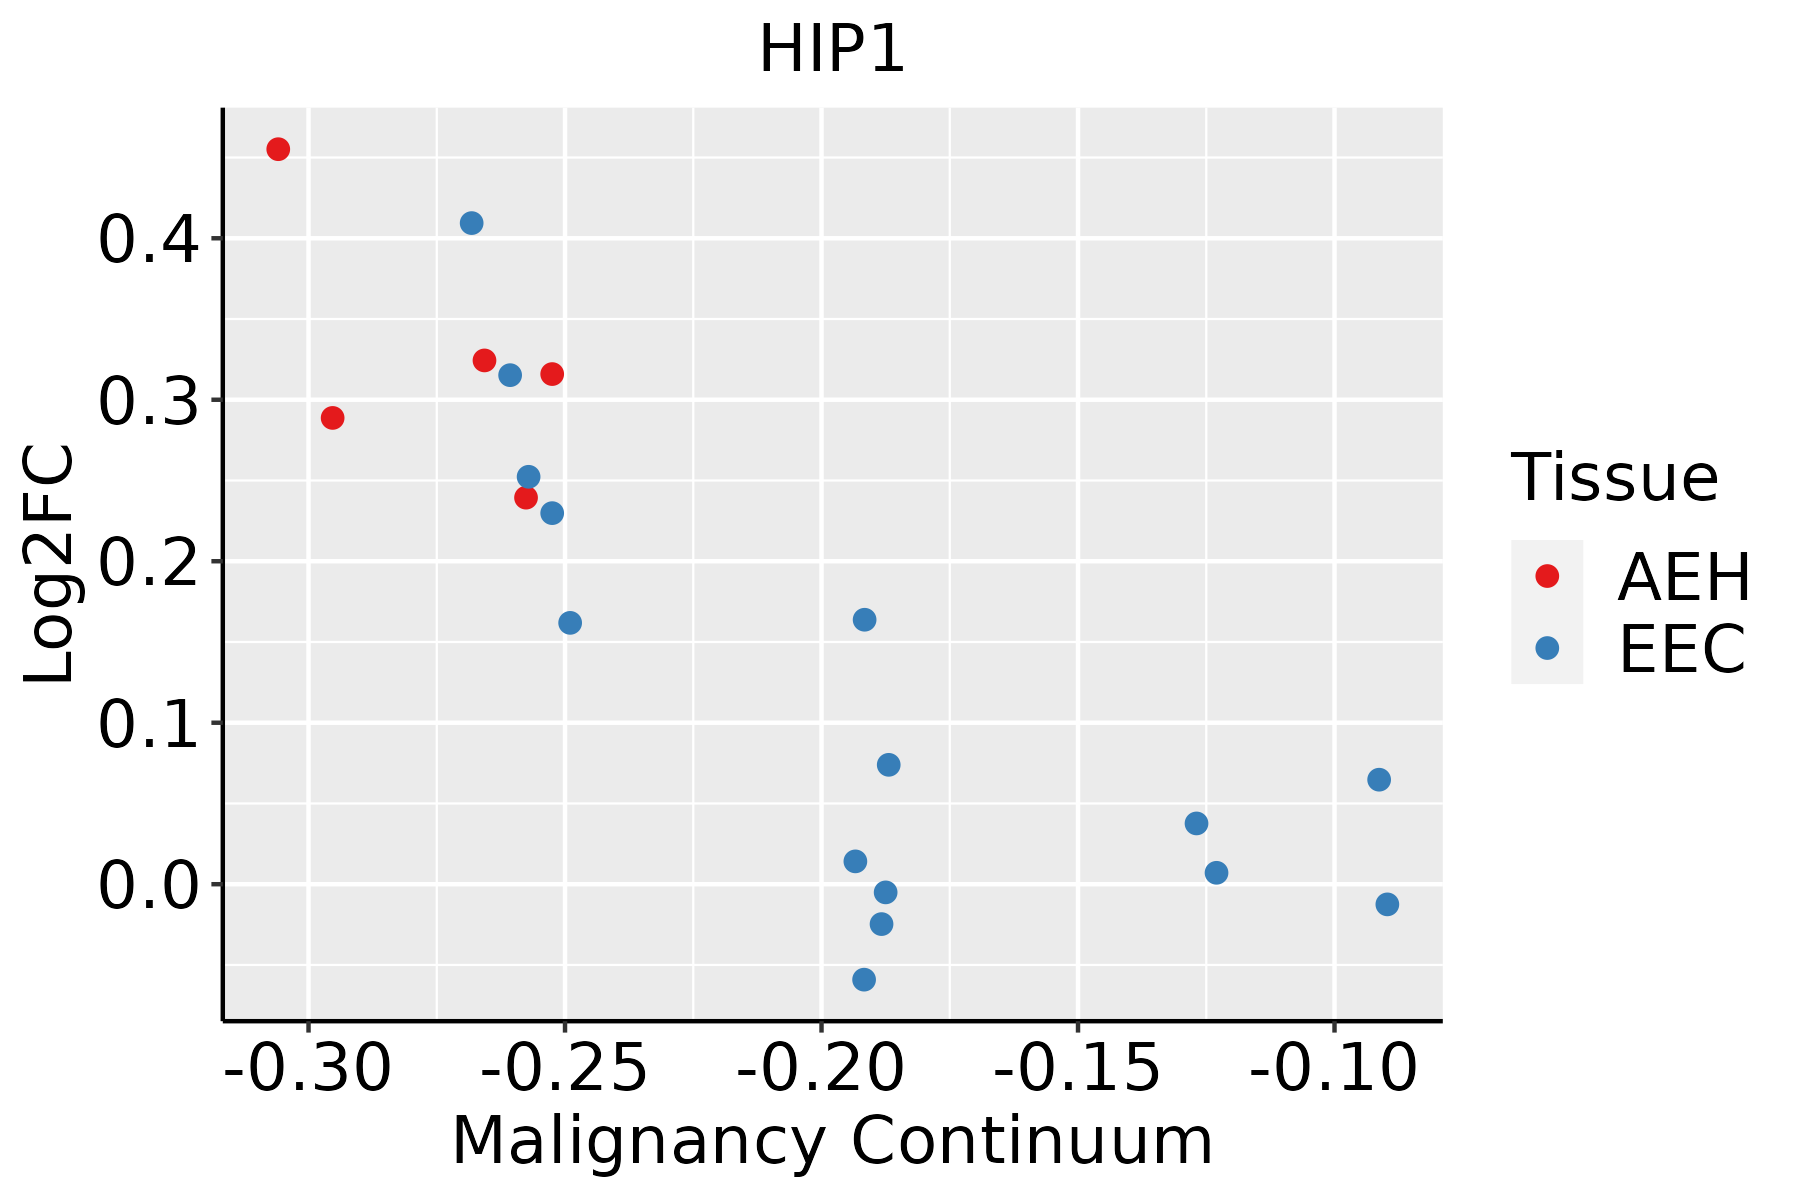 | AEH: Atypical endometrial hyperplasia |
| EEC: Endometrioid Cancer |
| Esophagus | 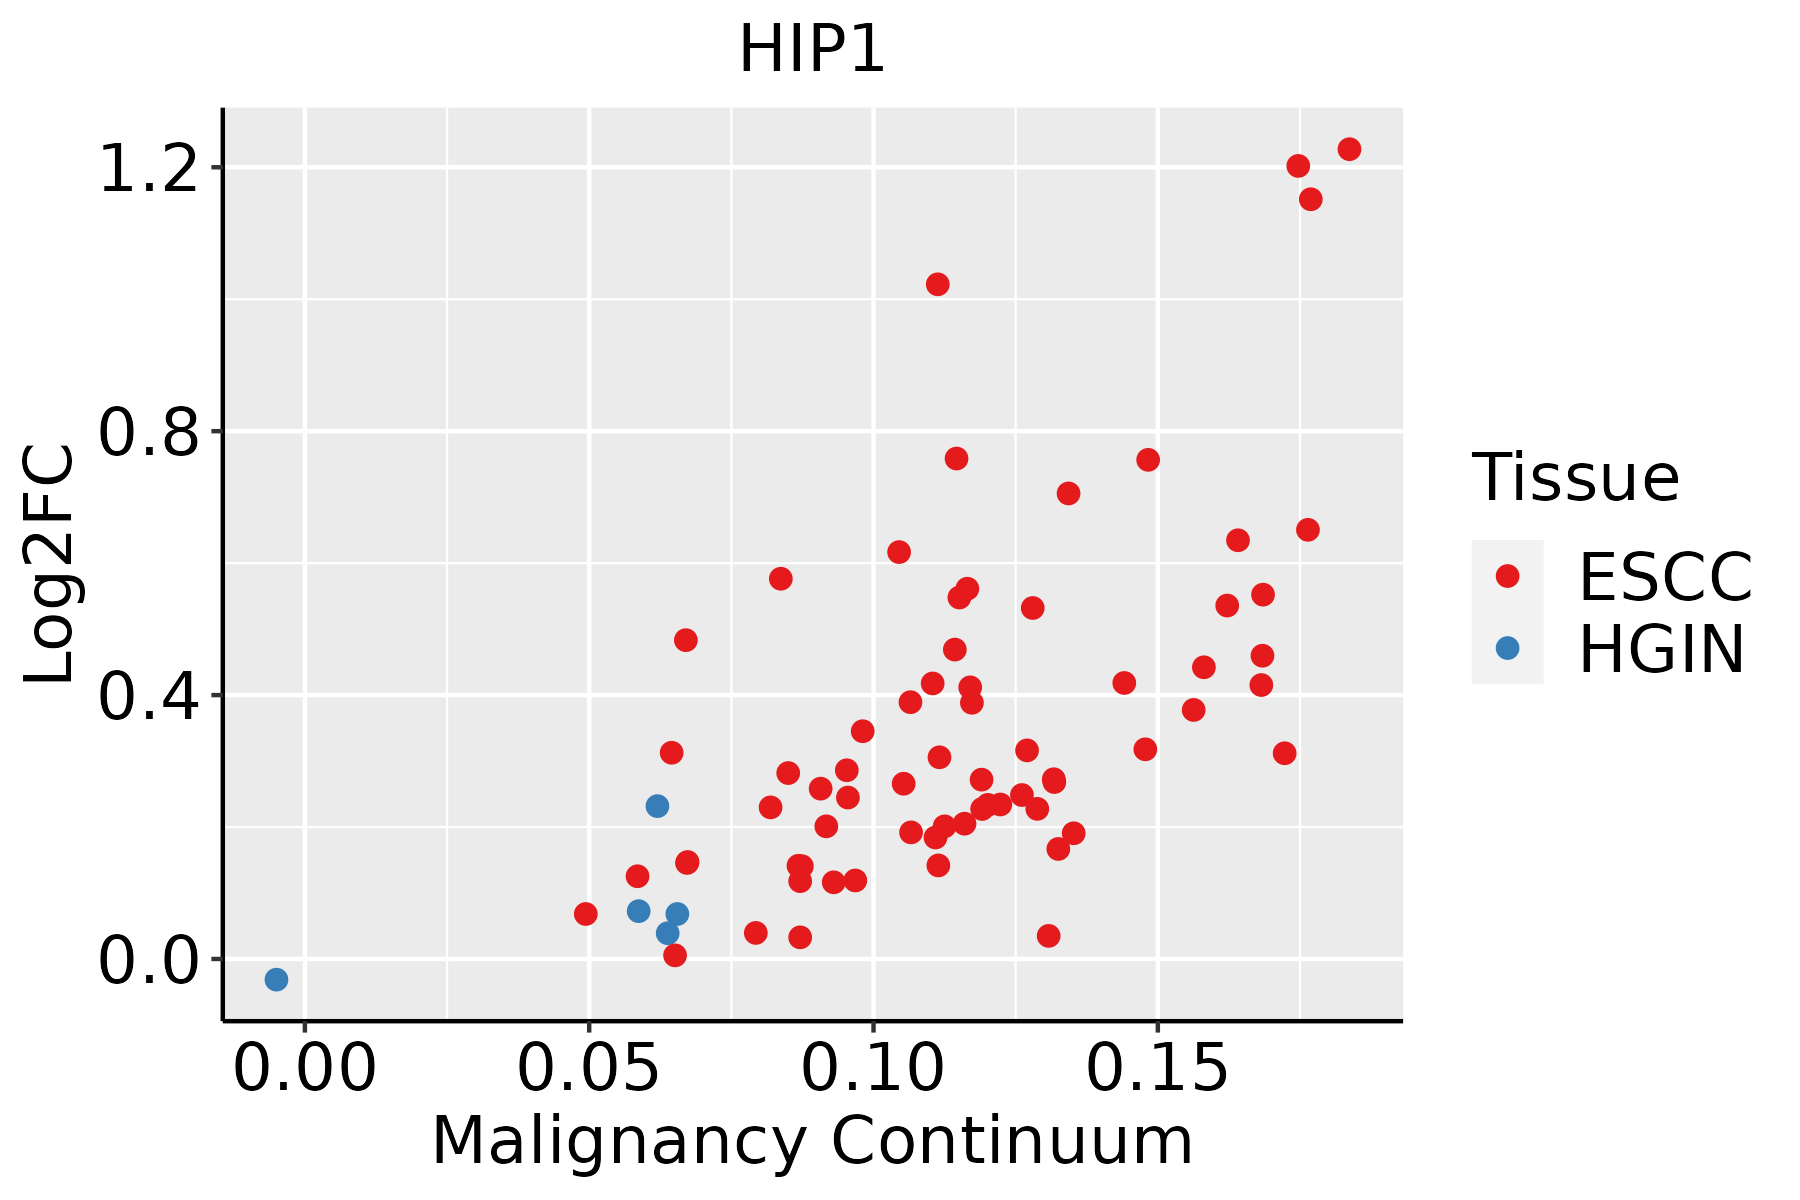 | ESCC: Esophageal squamous cell carcinoma |
| HGIN: High-grade intraepithelial neoplasias |
| LGIN: Low-grade intraepithelial neoplasias |
| Liver | 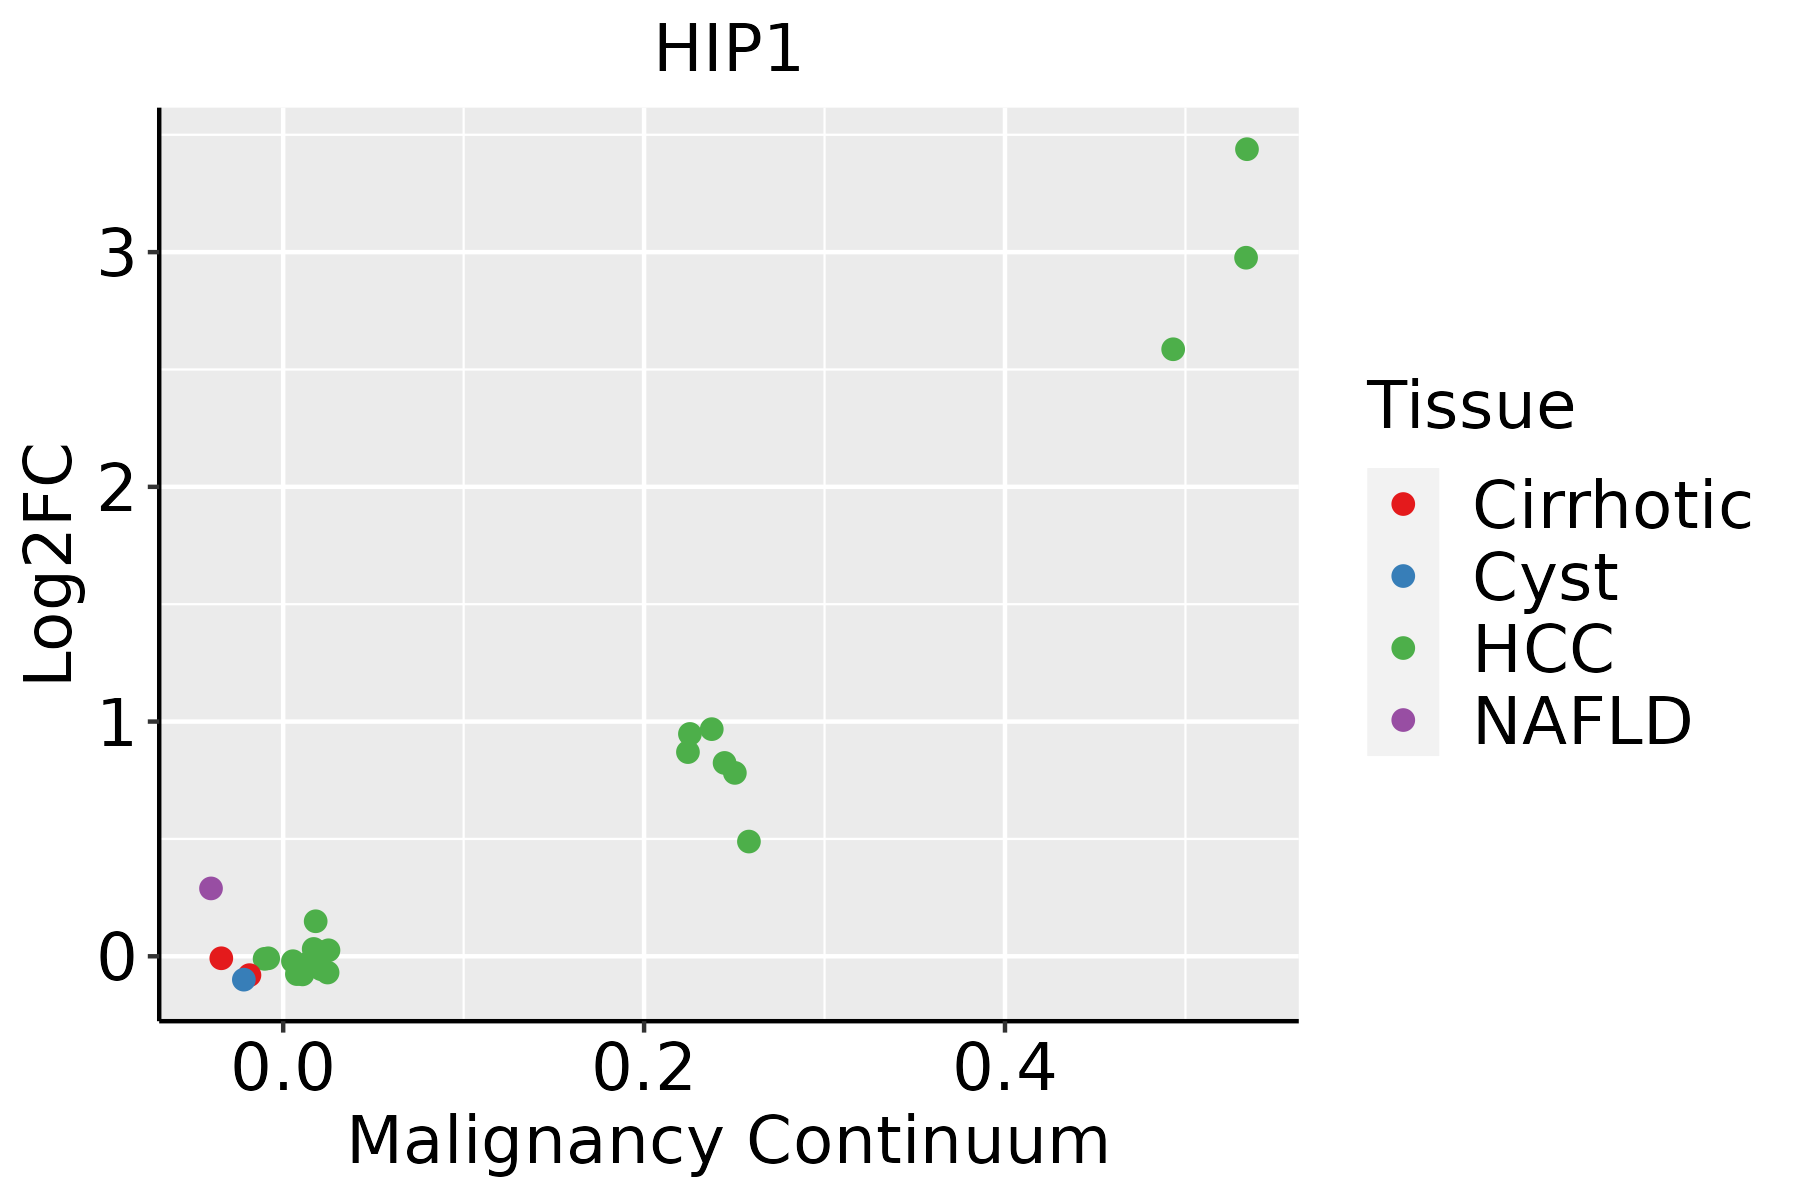 | HCC: Hepatocellular carcinoma |
| NAFLD: Non-alcoholic fatty liver disease |
| Lung | 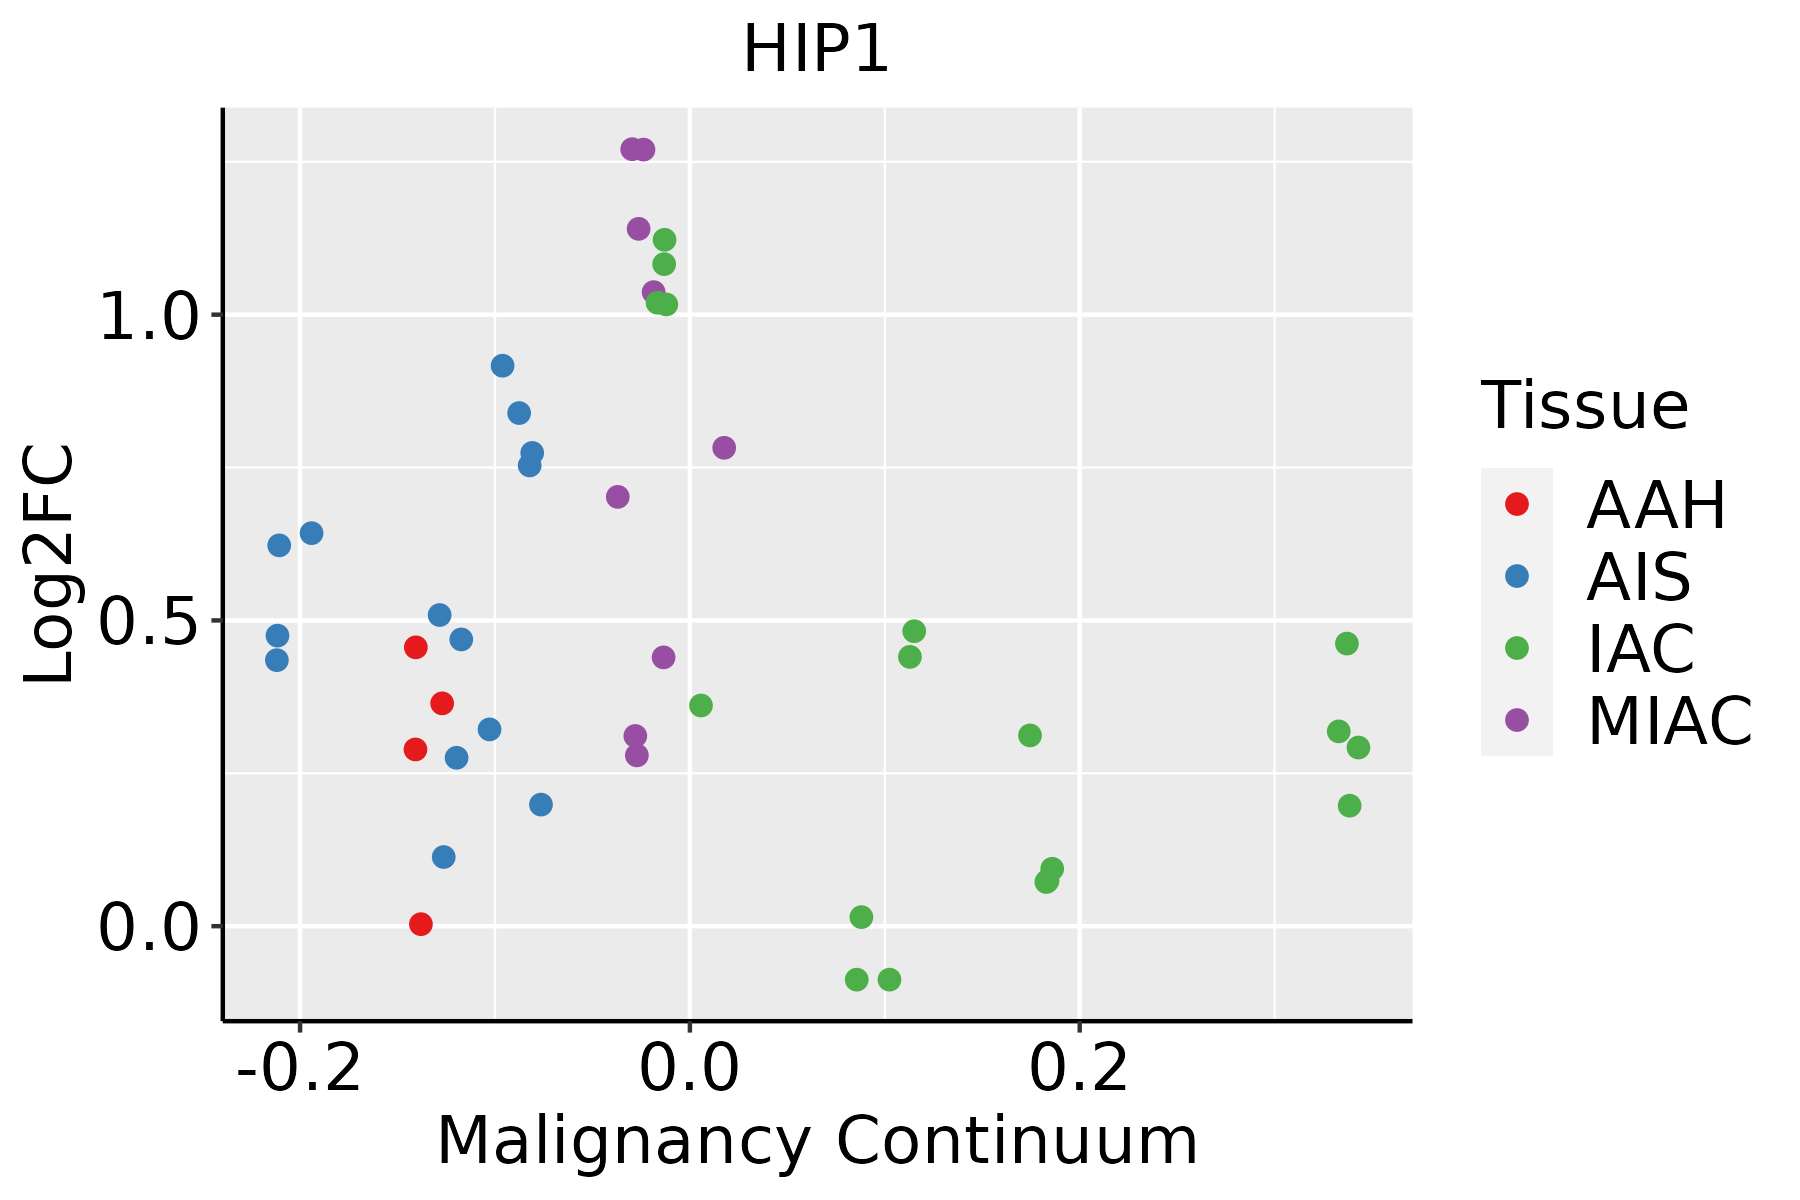 | AAH: Atypical adenomatous hyperplasia |
| AIS: Adenocarcinoma in situ |
| IAC: Invasive lung adenocarcinoma |
| MIA: Minimally invasive adenocarcinoma |
| Oral Cavity | 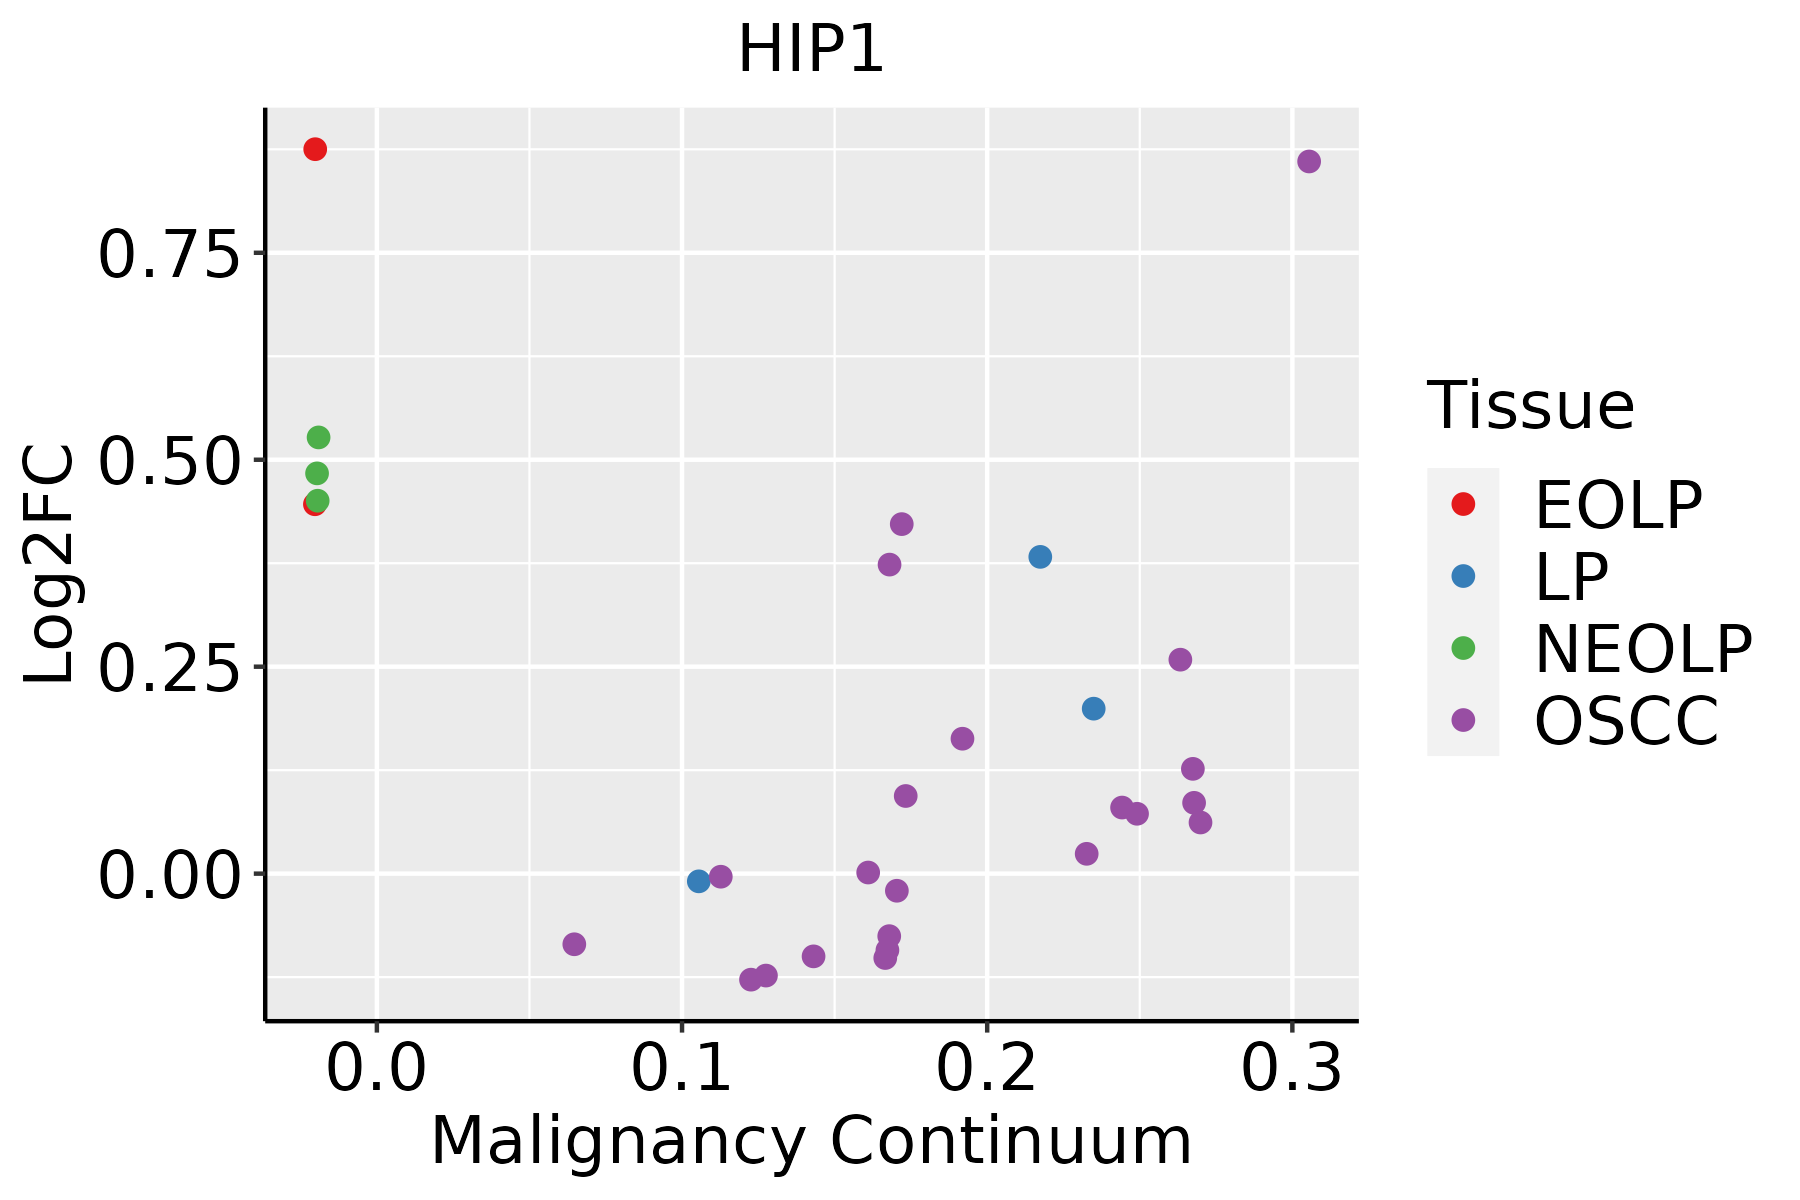 | EOLP: Erosive Oral lichen planus |
| LP: leukoplakia |
| NEOLP: Non-erosive oral lichen planus |
| OSCC: Oral squamous cell carcinoma |
| Prostate |  | BPH: Benign Prostatic Hyperplasia |
| Skin | 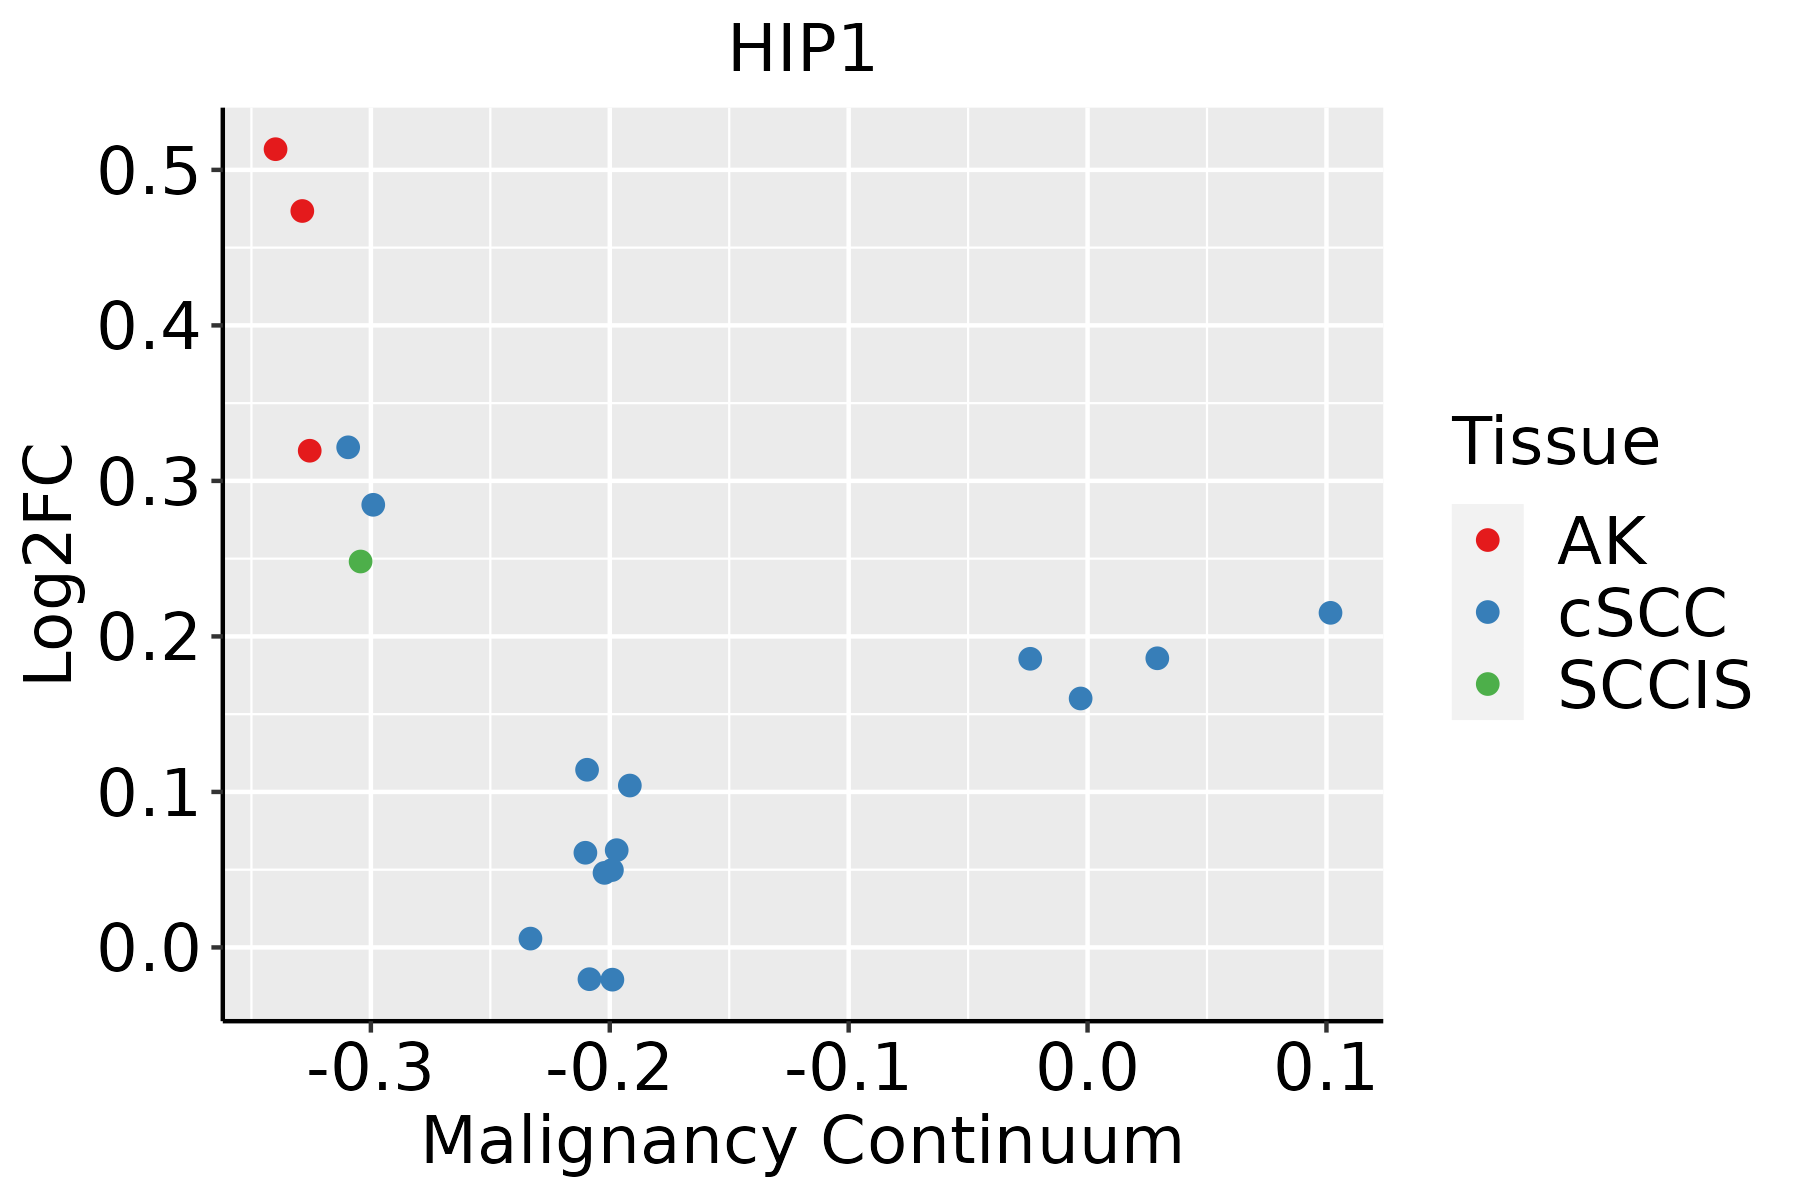 | AK: Actinic keratosis |
| cSCC: Cutaneous squamous cell carcinoma |
| SCCIS:squamous cell carcinoma in situ |
| Thyroid |  | ATC: Anaplastic thyroid cancer |
| HT: Hashimoto's thyroiditis |
| PTC: Papillary thyroid cancer |
| GO ID | Tissue | Disease Stage | Description | Gene Ratio | Bg Ratio | pvalue | p.adjust | Count |
| GO:00108227 | Oral cavity | OSCC | positive regulation of mitochondrion organization | 53/7305 | 74/18723 | 1.26e-08 | 2.55e-07 | 53 |
| GO:000701520 | Oral cavity | OSCC | actin filament organization | 230/7305 | 442/18723 | 1.37e-08 | 2.77e-07 | 230 |
| GO:001095019 | Oral cavity | OSCC | positive regulation of endopeptidase activity | 107/7305 | 179/18723 | 1.38e-08 | 2.78e-07 | 107 |
| GO:003297020 | Oral cavity | OSCC | regulation of actin filament-based process | 209/7305 | 397/18723 | 1.89e-08 | 3.72e-07 | 209 |
| GO:003010016 | Oral cavity | OSCC | regulation of endocytosis | 121/7305 | 211/18723 | 4.74e-08 | 8.80e-07 | 121 |
| GO:003253519 | Oral cavity | OSCC | regulation of cellular component size | 201/7305 | 383/18723 | 4.80e-08 | 8.88e-07 | 201 |
| GO:00905598 | Oral cavity | OSCC | regulation of membrane permeability | 54/7305 | 78/18723 | 6.05e-08 | 1.09e-06 | 54 |
| GO:003295620 | Oral cavity | OSCC | regulation of actin cytoskeleton organization | 189/7305 | 358/18723 | 6.81e-08 | 1.21e-06 | 189 |
| GO:003812715 | Oral cavity | OSCC | ERBB signaling pathway | 76/7305 | 121/18723 | 9.59e-08 | 1.66e-06 | 76 |
| GO:00469028 | Oral cavity | OSCC | regulation of mitochondrial membrane permeability | 45/7305 | 63/18723 | 1.80e-07 | 2.92e-06 | 45 |
| GO:00315034 | Oral cavity | OSCC | protein-containing complex localization | 123/7305 | 220/18723 | 2.54e-07 | 4.00e-06 | 123 |
| GO:011005320 | Oral cavity | OSCC | regulation of actin filament organization | 150/7305 | 278/18723 | 2.68e-07 | 4.15e-06 | 150 |
| GO:200105618 | Oral cavity | OSCC | positive regulation of cysteine-type endopeptidase activity | 88/7305 | 148/18723 | 3.59e-07 | 5.40e-06 | 88 |
| GO:004328018 | Oral cavity | OSCC | positive regulation of cysteine-type endopeptidase activity involved in apoptotic process | 78/7305 | 129/18723 | 6.35e-07 | 9.03e-06 | 78 |
| GO:000717315 | Oral cavity | OSCC | epidermal growth factor receptor signaling pathway | 67/7305 | 108/18723 | 1.04e-06 | 1.40e-05 | 67 |
| GO:003083817 | Oral cavity | OSCC | positive regulation of actin filament polymerization | 62/7305 | 99/18723 | 1.64e-06 | 2.14e-05 | 62 |
| GO:000806417 | Oral cavity | OSCC | regulation of actin polymerization or depolymerization | 104/7305 | 188/18723 | 3.99e-06 | 4.66e-05 | 104 |
| GO:003209210 | Oral cavity | OSCC | positive regulation of protein binding | 54/7305 | 85/18723 | 4.05e-06 | 4.71e-05 | 54 |
| GO:003083216 | Oral cavity | OSCC | regulation of actin filament length | 104/7305 | 189/18723 | 5.48e-06 | 6.14e-05 | 104 |
| GO:003083318 | Oral cavity | OSCC | regulation of actin filament polymerization | 96/7305 | 172/18723 | 5.56e-06 | 6.20e-05 | 96 |
| Pathway ID | Tissue | Disease Stage | Description | Gene Ratio | Bg Ratio | pvalue | p.adjust | qvalue | Count |
| hsa0501618 | Cervix | CC | Huntington disease | 94/1267 | 306/8465 | 8.49e-13 | 3.06e-11 | 1.81e-11 | 94 |
| hsa0502218 | Cervix | CC | Pathways of neurodegeneration - multiple diseases | 128/1267 | 476/8465 | 2.87e-12 | 9.29e-11 | 5.50e-11 | 128 |
| hsa0501619 | Cervix | CC | Huntington disease | 94/1267 | 306/8465 | 8.49e-13 | 3.06e-11 | 1.81e-11 | 94 |
| hsa0502219 | Cervix | CC | Pathways of neurodegeneration - multiple diseases | 128/1267 | 476/8465 | 2.87e-12 | 9.29e-11 | 5.50e-11 | 128 |
| hsa05016 | Colorectum | AD | Huntington disease | 147/2092 | 306/8465 | 1.93e-19 | 9.26e-18 | 5.91e-18 | 147 |
| hsa05022 | Colorectum | AD | Pathways of neurodegeneration - multiple diseases | 201/2092 | 476/8465 | 4.54e-18 | 1.27e-16 | 8.09e-17 | 201 |
| hsa050161 | Colorectum | AD | Huntington disease | 147/2092 | 306/8465 | 1.93e-19 | 9.26e-18 | 5.91e-18 | 147 |
| hsa050221 | Colorectum | AD | Pathways of neurodegeneration - multiple diseases | 201/2092 | 476/8465 | 4.54e-18 | 1.27e-16 | 8.09e-17 | 201 |
| hsa050164 | Colorectum | MSS | Huntington disease | 141/1875 | 306/8465 | 2.90e-21 | 1.62e-19 | 9.92e-20 | 141 |
| hsa050224 | Colorectum | MSS | Pathways of neurodegeneration - multiple diseases | 192/1875 | 476/8465 | 2.79e-20 | 1.04e-18 | 6.36e-19 | 192 |
| hsa050165 | Colorectum | MSS | Huntington disease | 141/1875 | 306/8465 | 2.90e-21 | 1.62e-19 | 9.92e-20 | 141 |
| hsa050225 | Colorectum | MSS | Pathways of neurodegeneration - multiple diseases | 192/1875 | 476/8465 | 2.79e-20 | 1.04e-18 | 6.36e-19 | 192 |
| hsa050228 | Colorectum | FAP | Pathways of neurodegeneration - multiple diseases | 117/1404 | 476/8465 | 2.81e-06 | 4.47e-05 | 2.72e-05 | 117 |
| hsa050168 | Colorectum | FAP | Huntington disease | 73/1404 | 306/8465 | 5.54e-04 | 3.93e-03 | 2.39e-03 | 73 |
| hsa050229 | Colorectum | FAP | Pathways of neurodegeneration - multiple diseases | 117/1404 | 476/8465 | 2.81e-06 | 4.47e-05 | 2.72e-05 | 117 |
| hsa050169 | Colorectum | FAP | Huntington disease | 73/1404 | 306/8465 | 5.54e-04 | 3.93e-03 | 2.39e-03 | 73 |
| hsa0501620 | Endometrium | AEH | Huntington disease | 118/1197 | 306/8465 | 3.00e-27 | 2.44e-25 | 1.78e-25 | 118 |
| hsa0502220 | Endometrium | AEH | Pathways of neurodegeneration - multiple diseases | 137/1197 | 476/8465 | 9.27e-18 | 2.32e-16 | 1.70e-16 | 137 |
| hsa05016110 | Endometrium | AEH | Huntington disease | 118/1197 | 306/8465 | 3.00e-27 | 2.44e-25 | 1.78e-25 | 118 |
| hsa05022110 | Endometrium | AEH | Pathways of neurodegeneration - multiple diseases | 137/1197 | 476/8465 | 9.27e-18 | 2.32e-16 | 1.70e-16 | 137 |
| Hugo Symbol | Variant Class | Variant Classification | dbSNP RS | HGVSc | HGVSp | HGVSp Short | SWISSPROT | BIOTYPE | SIFT | PolyPhen | Tumor Sample Barcode | Tissue | Histology | Sex | Age | Stage | Therapy Types | Drugs | Outcome |
| HIP1 | SNV | Missense_Mutation | novel | c.341N>A | p.Ser114Tyr | p.S114Y | O00291 | protein_coding | tolerated(0.28) | possibly_damaging(0.883) | TCGA-A2-A0EV-01 | Breast | breast invasive carcinoma | Female | >=65 | I/II | Unknown | Unknown | SD |
| HIP1 | SNV | Missense_Mutation | rs782471782 | c.1729C>T | p.Arg577Trp | p.R577W | O00291 | protein_coding | deleterious(0) | benign(0.309) | TCGA-A8-A09Z-01 | Breast | breast invasive carcinoma | Female | >=65 | I/II | Unknown | Unknown | SD |
| HIP1 | SNV | Missense_Mutation | | c.3067N>C | p.Glu1023Gln | p.E1023Q | O00291 | protein_coding | tolerated(0.09) | benign(0.006) | TCGA-AC-A23H-01 | Breast | breast invasive carcinoma | Female | >=65 | I/II | Unknown | Unknown | PD |
| HIP1 | SNV | Missense_Mutation | | c.2572C>G | p.Pro858Ala | p.P858A | O00291 | protein_coding | tolerated(0.68) | benign(0.012) | TCGA-B6-A0I8-01 | Breast | breast invasive carcinoma | Female | <65 | I/II | Unknown | Unknown | PD |
| HIP1 | SNV | Missense_Mutation | | c.757N>A | p.Asp253Asn | p.D253N | O00291 | protein_coding | deleterious(0) | probably_damaging(1) | TCGA-B6-A1KF-01 | Breast | breast invasive carcinoma | Female | >=65 | I/II | Unknown | Unknown | SD |
| HIP1 | SNV | Missense_Mutation | rs587756668 | c.2482N>C | p.Thr828Pro | p.T828P | O00291 | protein_coding | deleterious(0) | probably_damaging(0.994) | TCGA-D8-A1X7-01 | Breast | breast invasive carcinoma | Female | <65 | I/II | ChemotherapyHormone Therapy | doxorubicine+cyclophosphamide+tamoxifen | SD |
| HIP1 | SNV | Missense_Mutation | novel | c.2213N>A | p.Ser738Tyr | p.S738Y | O00291 | protein_coding | deleterious(0.04) | benign(0.003) | TCGA-E9-A1RB-01 | Breast | breast invasive carcinoma | Female | <65 | I/II | Chemotherapy | methotrexate | SD |
| HIP1 | insertion | Frame_Shift_Ins | novel | c.338_339insTCTGTCTGCACCTATAAAATGTTGGCAACTATGTAGTC | p.Ser114LeufsTer15 | p.S114Lfs*15 | O00291 | protein_coding | | | TCGA-A2-A0EV-01 | Breast | breast invasive carcinoma | Female | >=65 | I/II | Unknown | Unknown | SD |
| HIP1 | SNV | Missense_Mutation | rs782794159 | c.228C>G | p.Phe76Leu | p.F76L | O00291 | protein_coding | deleterious(0.01) | probably_damaging(1) | TCGA-IR-A3LL-01 | Cervix | cervical & endocervical cancer | Female | <65 | I/II | Chemotherapy | cisplatin | CR |
| HIP1 | SNV | Missense_Mutation | | c.2855N>T | p.Ser952Leu | p.S952L | O00291 | protein_coding | deleterious(0) | probably_damaging(0.962) | TCGA-Q1-A73P-01 | Cervix | cervical & endocervical cancer | Female | <65 | I/II | Unknown | Unknown | SD |


