Schematic overview of the cellular and molecular mechanisms involved in the cancer progression, including the proposed cellular and molecular mechanisms in cancer cells trajectory. AT1: alveolar type 1 cells; AT2: alveolar type 2 cells; AAH: atypical adenomatous hyperplasia; AIS: adenocarcinoma in situ; MIA: minimally invasive adenocarcinoma; IA: invasive adenocarcinoma; EMT: epithelial-mesenchymal transition

Home

Download

Statistics

Help

Contact

Center for Computational Systems Medicine
leaf

Gene summary

leaf

Malignant transformation analysis

leaf

Malignant transformation related pathway analysis

leaf

Cell-cell communication analysis

leaf

Single-cell gene regulatory network inference analysis

leaf

Somatic mutation of malignant transformation related genes

leaf

Related drugs of malignant transformation related genes

Gene: DLC1

Gene summary for DLC1

check button Gene summary.

Gene informationSpeciesHuman
Gene symbol

DLC1

Gene ID

10395

Gene nameDLC1 Rho GTPase activating protein
Gene AliasARHGAP7
Cytomap8p22
Gene Typeprotein-coding
GO ID

GO:0000902

UniProtAcc

A8K119


Top

Malignant transformation analysis

check button Identification of the aberrant gene expression in precancerous and cancerous lesions by comparing the gene expression of stem-like cells in diseased tissues with normal stem cells
check button Malignant transformation involving gene list.
Entrez IDSymbolReplicatesSpeciesOrganTissueAdj P-valueLog2FCMalignancy
10395DLC1P5T-EHumanEsophagusESCC1.53e-031.66e-010.1327
10395DLC1P8T-EHumanEsophagusESCC4.92e-027.89e-020.0889
10395DLC1P9T-EHumanEsophagusESCC1.30e-052.74e-010.1131
10395DLC1P10T-EHumanEsophagusESCC1.15e-102.17e-010.116
10395DLC1P11T-EHumanEsophagusESCC2.98e-156.93e-010.1426
10395DLC1P16T-EHumanEsophagusESCC2.26e-036.17e-020.1153
10395DLC1P19T-EHumanEsophagusESCC2.29e-078.23e-010.1662
10395DLC1P22T-EHumanEsophagusESCC7.33e-046.40e-020.1236
10395DLC1P24T-EHumanEsophagusESCC7.37e-052.48e-010.1287
10395DLC1P28T-EHumanEsophagusESCC1.44e-025.81e-020.1149
10395DLC1P42T-EHumanEsophagusESCC3.16e-032.56e-010.1175
10395DLC1P44T-EHumanEsophagusESCC2.68e-052.06e-010.1096
10395DLC1P47T-EHumanEsophagusESCC2.47e-051.08e-010.1067
10395DLC1P52T-EHumanEsophagusESCC3.67e-021.43e-010.1555
10395DLC1P57T-EHumanEsophagusESCC4.18e-021.26e-010.0926
10395DLC1P75T-EHumanEsophagusESCC2.08e-081.28e-010.1125
10395DLC1P76T-EHumanEsophagusESCC7.10e-067.86e-020.1207
10395DLC1P79T-EHumanEsophagusESCC1.85e-026.70e-020.1154
10395DLC1P89T-EHumanEsophagusESCC6.03e-057.21e-010.1752
10395DLC1P130T-EHumanEsophagusESCC5.53e-034.14e-020.1676
Page: 1 2 3 4 5 

check button Transcriptomic changes along malignancy continuum.
TissueExpression DynamicsAbbreviation
EsophagusThe image shows the transcriptomic changes along malignancy continuum.log2FC in expression of this searched gene in stem-like cells from each diseased tissue sample relative to stem-like cells in normal samples in each tissue plotted against the malignancy continuum. Samples are colored based on if they are from different disease stage.
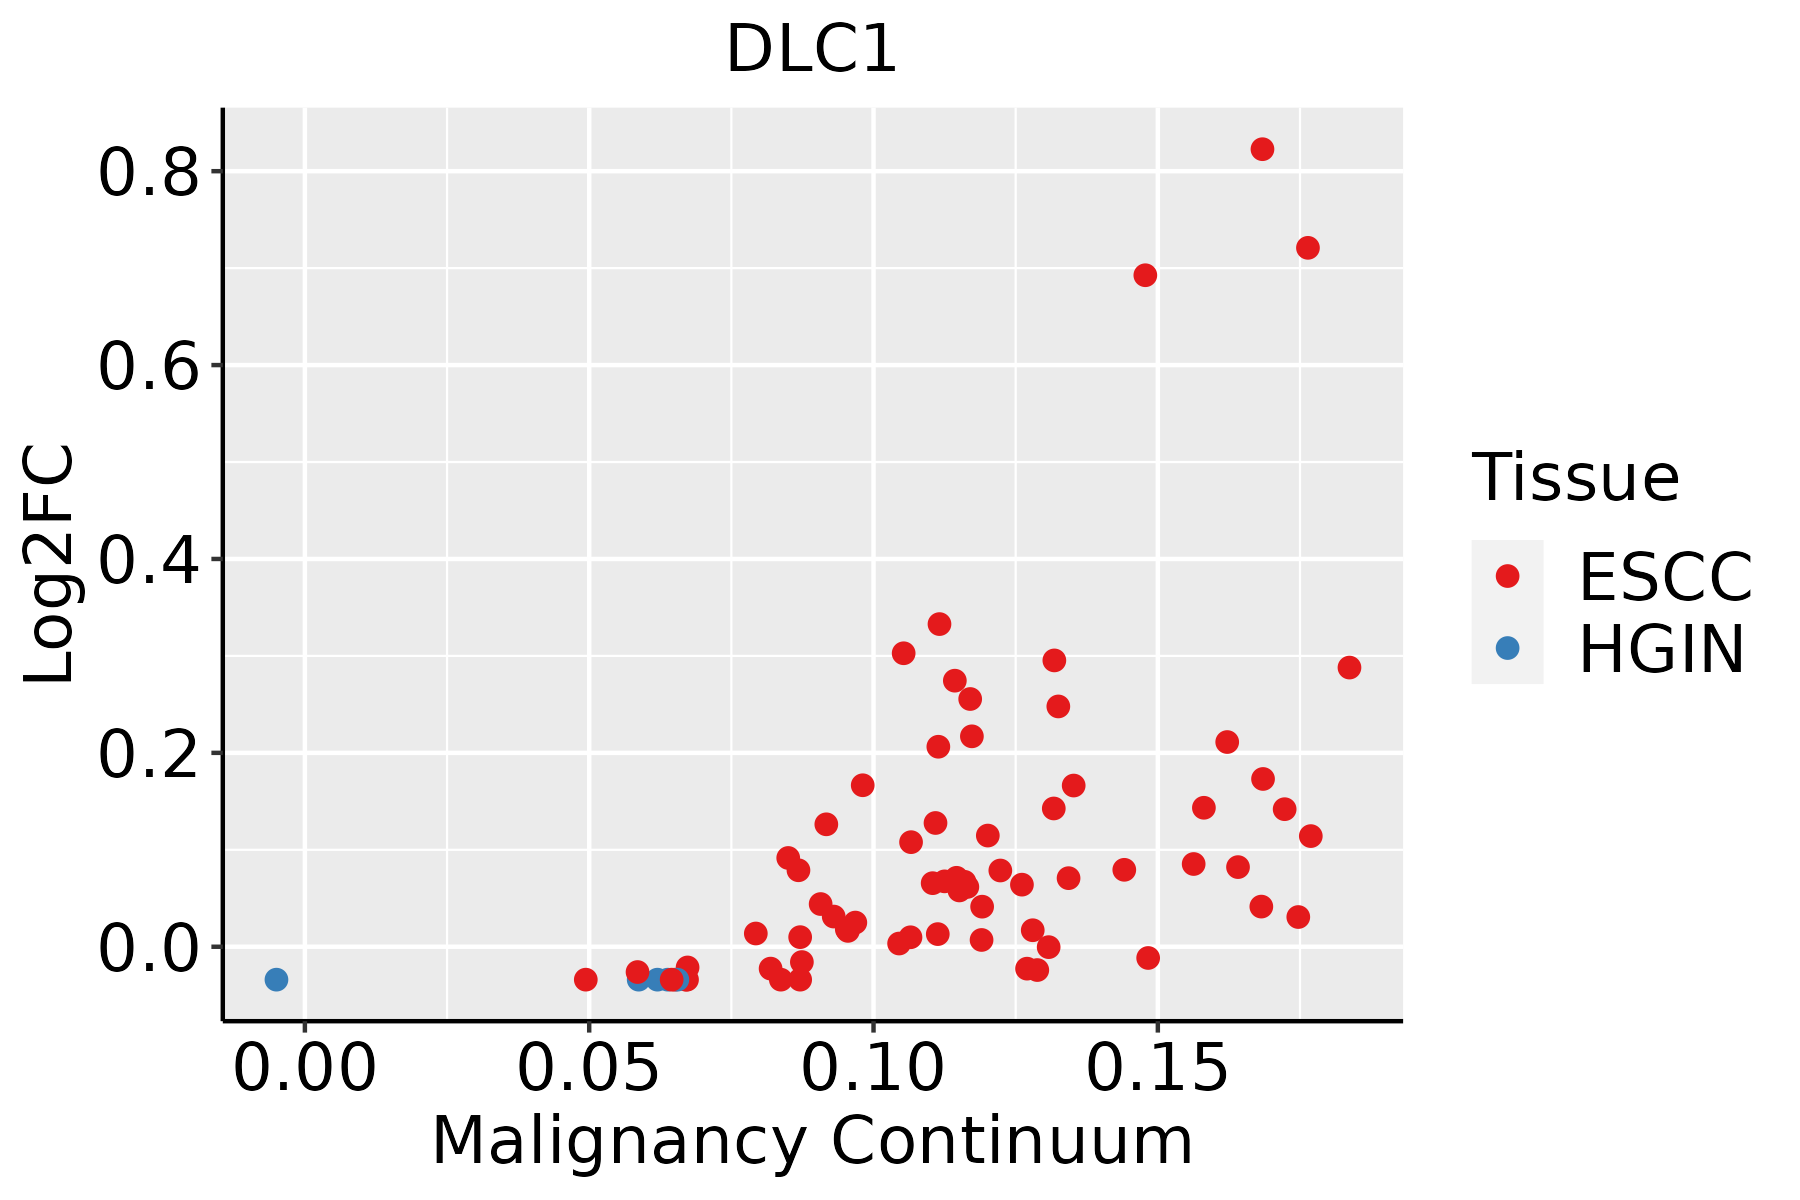
ESCC: Esophageal squamous cell carcinoma
HGIN: High-grade intraepithelial neoplasias
LGIN: Low-grade intraepithelial neoplasias
LiverThe image shows the transcriptomic changes along malignancy continuum.log2FC in expression of this searched gene in stem-like cells from each diseased tissue sample relative to stem-like cells in normal samples in each tissue plotted against the malignancy continuum. Samples are colored based on if they are from different disease stage.
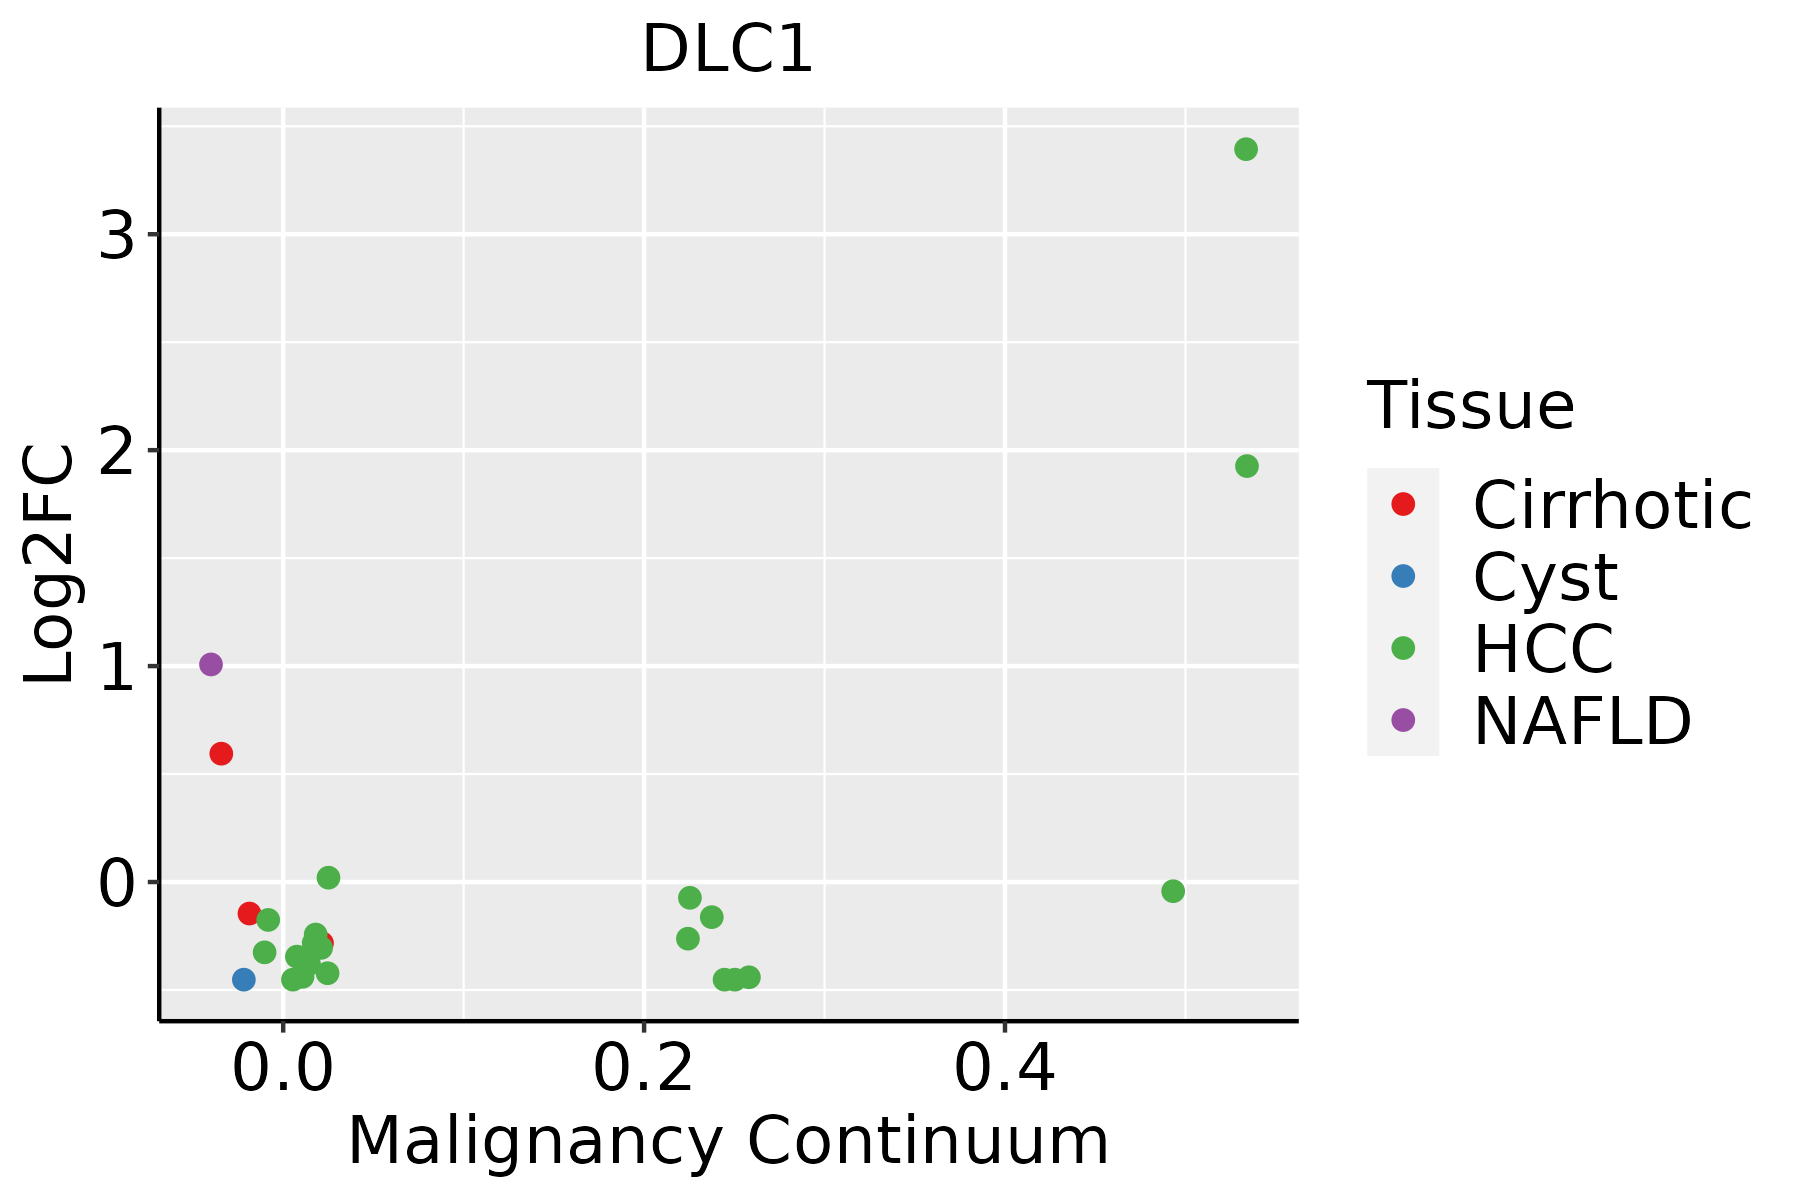
HCC: Hepatocellular carcinoma
NAFLD: Non-alcoholic fatty liver disease
LungThe image shows the transcriptomic changes along malignancy continuum.log2FC in expression of this searched gene in stem-like cells from each diseased tissue sample relative to stem-like cells in normal samples in each tissue plotted against the malignancy continuum. Samples are colored based on if they are from different disease stage.
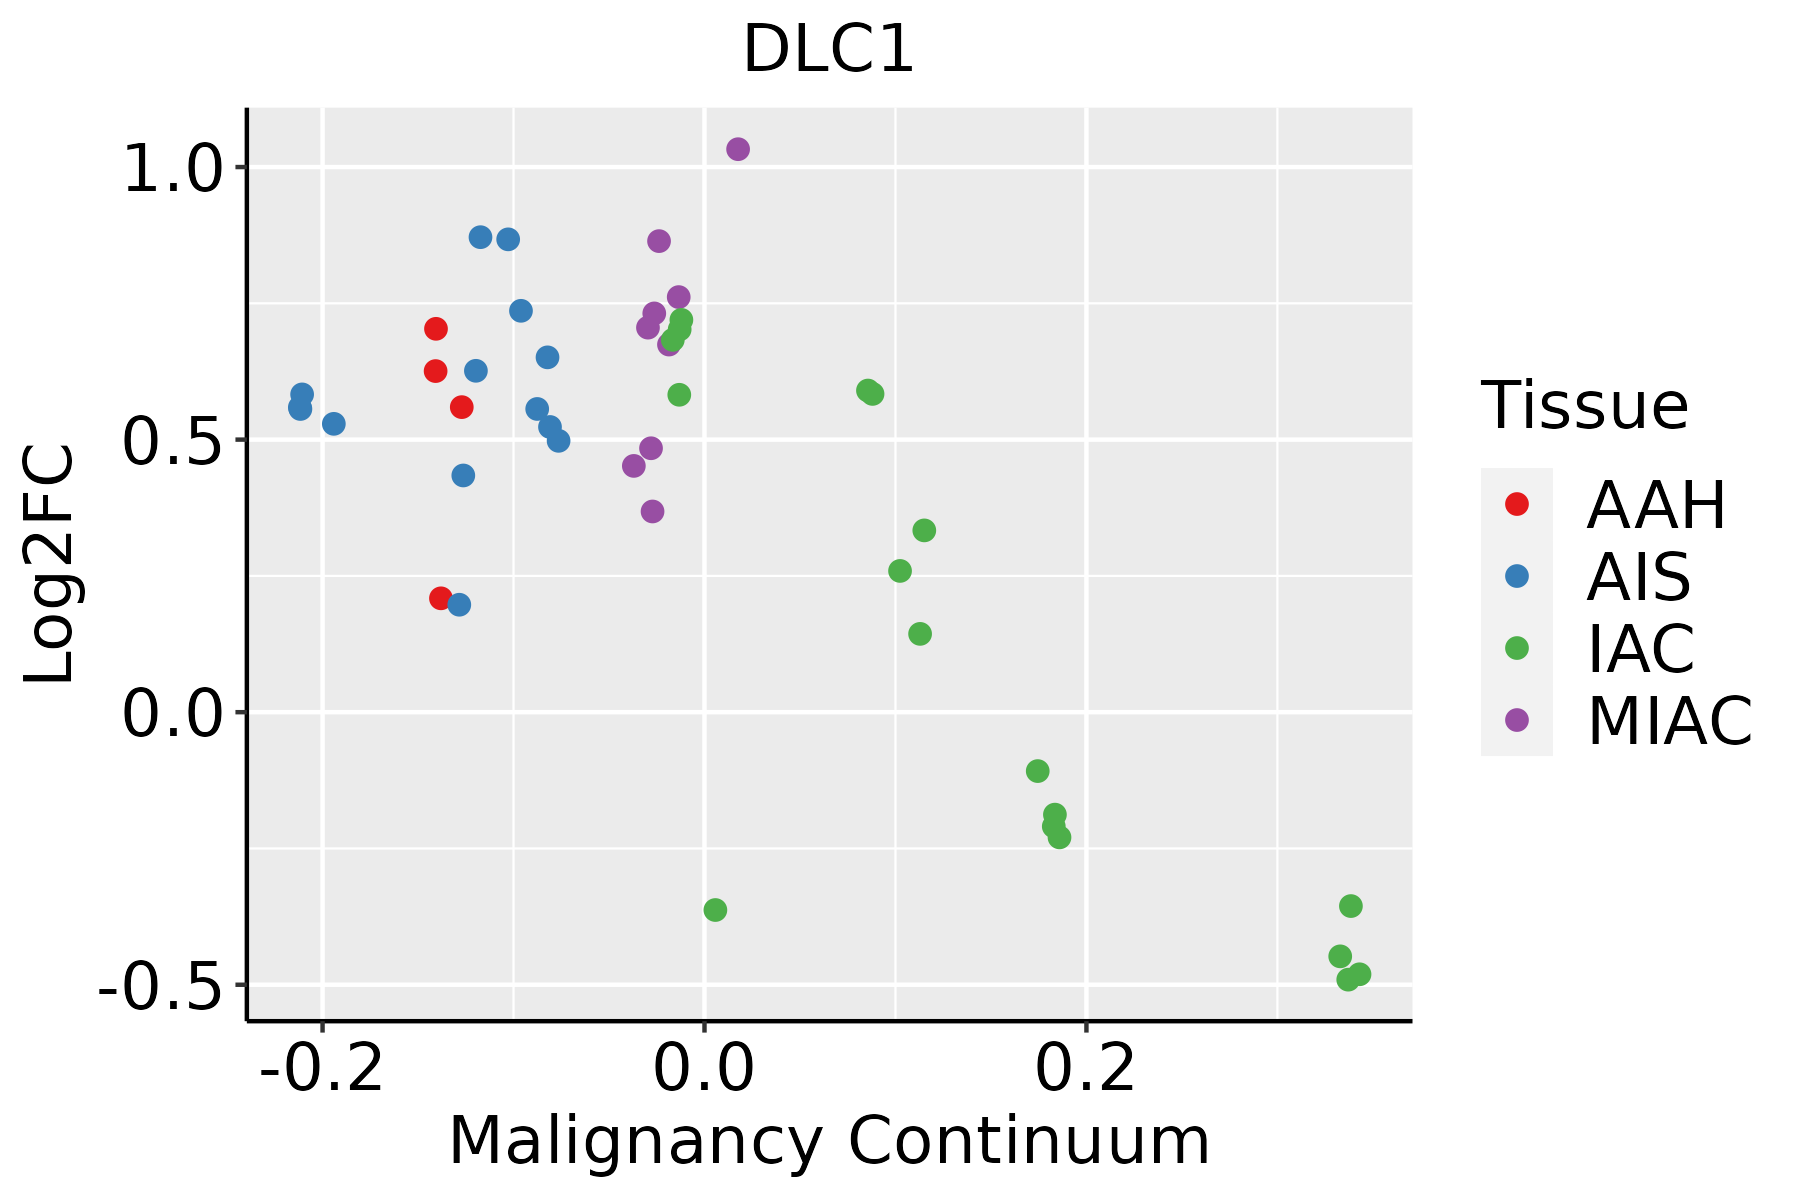
AAH: Atypical adenomatous hyperplasia
AIS: Adenocarcinoma in situ
IAC: Invasive lung adenocarcinoma
MIA: Minimally invasive adenocarcinoma
Oral CavityThe image shows the transcriptomic changes along malignancy continuum.log2FC in expression of this searched gene in stem-like cells from each diseased tissue sample relative to stem-like cells in normal samples in each tissue plotted against the malignancy continuum. Samples are colored based on if they are from different disease stage.EOLP: Erosive Oral lichen planus
LP: leukoplakia
NEOLP: Non-erosive oral lichen planus
OSCC: Oral squamous cell carcinoma
ThyroidThe image shows the transcriptomic changes along malignancy continuum.log2FC in expression of this searched gene in stem-like cells from each diseased tissue sample relative to stem-like cells in normal samples in each tissue plotted against the malignancy continuum. Samples are colored based on if they are from different disease stage.
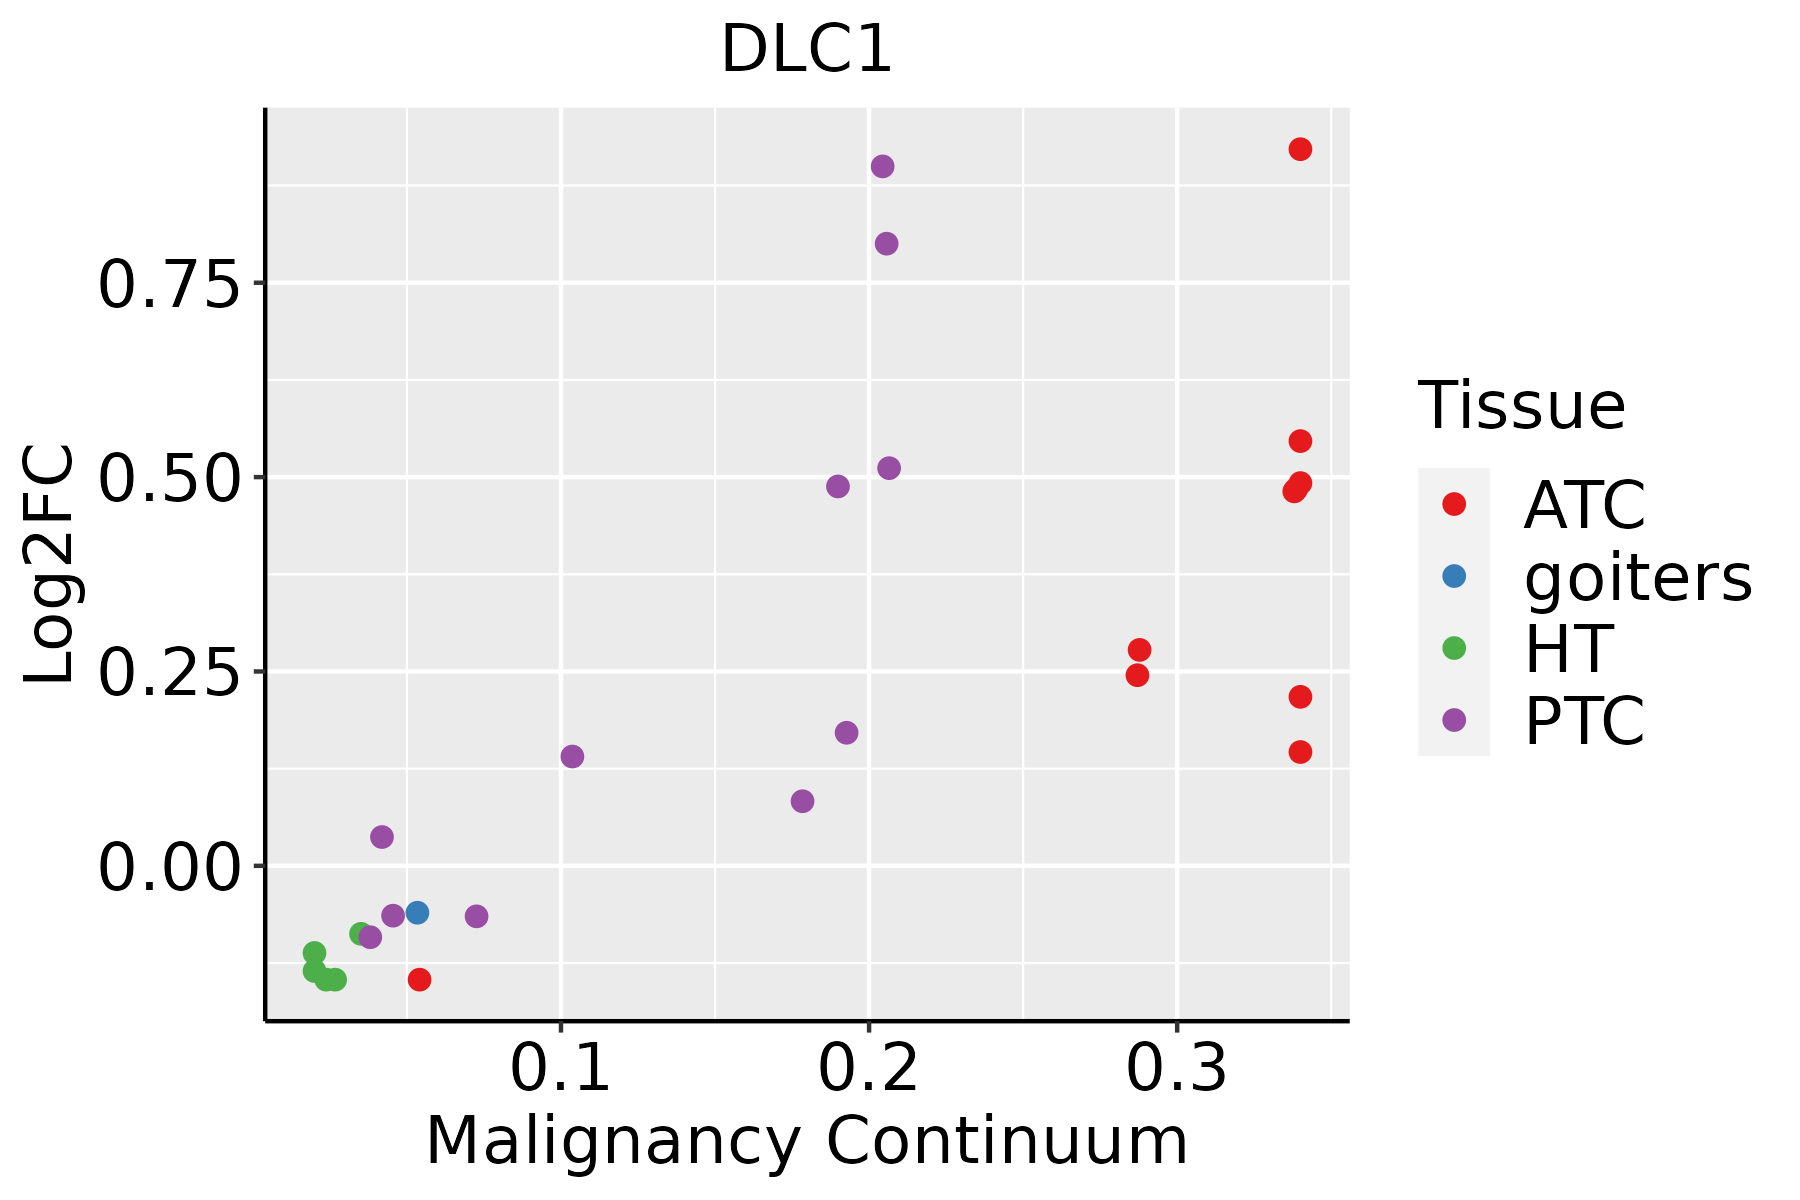
ATC: Anaplastic thyroid cancer
HT: Hashimoto's thyroiditis
PTC: Papillary thyroid cancer
∗log2FC in expression of this searched gene in stem-like cells from each diseased tissue sample relative to stem-like cells in normal samples in each tissue plotted against the malignancy continuum. Samples are colored based on if they are from different disease stage.

Top

Malignant transformation related pathway analysis

check buttonFind out the enriched GO biological processes and KEGG pathways involved in transition from healthy to precancer to cancer
check button Figure of enriched GO biological processes.
TissueDisease StageEnriched GO biological Processes
ColorectumADGO analysis - Figure of enriched GO biological processes: Top 15 enriched GO BP terms are showed in the bar plot of each disease state in each tissue. Each row represents a significant GO biological process which is colored according to the -log10(p.adjust).
ColorectumSERGO analysis - Figure of enriched GO biological processes: Top 15 enriched GO BP terms are showed in the bar plot of each disease state in each tissue. Each row represents a significant GO biological process which is colored according to the -log10(p.adjust).
ColorectumMSSGO analysis - Figure of enriched GO biological processes: Top 15 enriched GO BP terms are showed in the bar plot of each disease state in each tissue. Each row represents a significant GO biological process which is colored according to the -log10(p.adjust).
ColorectumMSI-HGO analysis - Figure of enriched GO biological processes: Top 15 enriched GO BP terms are showed in the bar plot of each disease state in each tissue. Each row represents a significant GO biological process which is colored according to the -log10(p.adjust).
ColorectumFAPGO analysis - Figure of enriched GO biological processes: Top 15 enriched GO BP terms are showed in the bar plot of each disease state in each tissue. Each row represents a significant GO biological process which is colored according to the -log10(p.adjust).
∗Top 15 enriched GO BP terms are showed in the bar plot of each disease state in each tissue. Each row represents a significant GO biological process which is colored according to the -log10(p.adjust).
Page: 1 2 3 4 5 6 7 8 9 

check button Enriched GO biological processes.
GO IDTissueDisease StageDescriptionGene RatioBg Ratiopvaluep.adjustCount
GO:003103217Oral cavityOSCCactomyosin structure organization93/7305196/187239.63e-033.41e-0293
GO:011002020Oral cavityOSCCregulation of actomyosin structure organization51/7305100/187239.74e-033.45e-0251
GO:200011625Oral cavityEOLPregulation of cysteine-type endopeptidase activity67/2218235/187233.12e-126.45e-1067
GO:190290326Oral cavityEOLPregulation of supramolecular fiber organization93/2218383/187236.50e-121.08e-0993
GO:004586226Oral cavityEOLPpositive regulation of proteolysis91/2218372/187237.08e-121.15e-0991
GO:000701526Oral cavityEOLPactin filament organization102/2218442/187231.61e-112.48e-09102
GO:005254725Oral cavityEOLPregulation of peptidase activity105/2218461/187231.86e-112.79e-09105
GO:004328125Oral cavityEOLPregulation of cysteine-type endopeptidase activity involved in apoptotic process60/2218209/187233.09e-114.30e-0960
GO:003297026Oral cavityEOLPregulation of actin filament-based process93/2218397/187235.39e-117.03e-0993
GO:005254825Oral cavityEOLPregulation of endopeptidase activity98/2218432/187231.12e-101.29e-0898
GO:000647023Oral cavityEOLPprotein dephosphorylation72/2218281/187231.19e-101.35e-0872
GO:000704417Oral cavityEOLPcell-substrate junction assembly35/221895/187232.61e-102.45e-0835
GO:003295626Oral cavityEOLPregulation of actin cytoskeleton organization84/2218358/187234.24e-103.65e-0884
GO:015011524Oral cavityEOLPcell-substrate junction organization36/2218101/187234.26e-103.65e-0836
GO:003158925Oral cavityEOLPcell-substrate adhesion84/2218363/187238.71e-106.29e-0884
GO:000195216Oral cavityEOLPregulation of cell-matrix adhesion40/2218128/187234.06e-092.39e-0740
GO:003530424Oral cavityEOLPregulation of protein dephosphorylation32/221890/187234.22e-092.41e-0732
GO:001095224Oral cavityEOLPpositive regulation of peptidase activity53/2218197/187235.39e-092.91e-0753
GO:001081025Oral cavityEOLPregulation of cell-substrate adhesion57/2218221/187237.77e-093.94e-0757
GO:003530322Oral cavityEOLPregulation of dephosphorylation39/2218128/187231.39e-086.43e-0739
Page: 1 2 3 4 5 6 7 8 9 10 11 12 13 14 15 16 17 18 19 20 21 22 23 24 25 26 27 28 29 30 31 32 33 34 35 36 

check button Enriched KEGG pathways.
Pathway IDTissueDisease StageDescriptionGene RatioBg Ratiopvaluep.adjustqvalueCount
Page: 1 

Top

Cell-cell communication analysis

check buttonIdentification of potential cell-cell interactions between two cell types and their ligand-receptor pairs for different disease states
LigandReceptorLRpairPathwayTissueDisease Stage
Page: 1 

Top

Single-cell gene regulatory network inference analysis

check buttonFind out the significant the regulons (TFs) and the target genes of each regulon across cell types for different disease states
TFCell TypeTissueDisease StageTarget GeneRSSRegulon Activity
∗The dot plots of a searched regulon are shown for all cell subpopulations in each disease state of each tissue based on the regulon specific score inferred using pySCENIC and by calculating the average expression.
Page: 1 

Top

Somatic mutation of malignant transformation related genes

check buttonAnnotation of somatic variants for genes involved in malignant transformation
Hugo SymbolVariant ClassVariant ClassificationdbSNP RSHGVScHGVSpHGVSp ShortSWISSPROTBIOTYPESIFTPolyPhenTumor Sample BarcodeTissueHistologySexAgeStageTherapy TypesDrugsOutcome
DLC1SNVMissense_Mutationc.2960N>Cp.Gly987Alap.G987AQ96QB1protein_codingdeleterious(0)possibly_damaging(0.449)TCGA-A2-A0D0-01Breastbreast invasive carcinomaFemale<65I/IIChemotherapycytoxanSD
DLC1SNVMissense_Mutationrs773001160c.1724G>Ap.Gly575Aspp.G575DQ96QB1protein_codingdeleterious(0.04)benign(0.018)TCGA-A8-A092-01Breastbreast invasive carcinomaFemale<65III/IVChemotherapypaclitaxelCR
DLC1SNVMissense_Mutationrs762750959c.1723G>Ap.Gly575Serp.G575SQ96QB1protein_codingtolerated(0.28)benign(0)TCGA-A8-A092-01Breastbreast invasive carcinomaFemale<65III/IVChemotherapypaclitaxelCR
DLC1SNVMissense_Mutationc.2533N>Ap.Gly845Serp.G845SQ96QB1protein_codingtolerated(0.11)probably_damaging(1)TCGA-A8-A09Z-01Breastbreast invasive carcinomaFemale>=65I/IIUnknownUnknownSD
DLC1SNVMissense_Mutationnovelc.4058N>Gp.Glu1353Glyp.E1353GQ96QB1protein_codingdeleterious(0)benign(0.41)TCGA-AN-A046-01Breastbreast invasive carcinomaFemale>=65I/IIUnknownUnknownSD
DLC1SNVMissense_Mutationc.3983N>Tp.Cys1328Phep.C1328FQ96QB1protein_codingtolerated(0.15)possibly_damaging(0.803)TCGA-AO-A03V-01Breastbreast invasive carcinomaFemale<65I/IIChemotherapyfluorouracilSD
DLC1SNVMissense_Mutationc.305C>Ap.Ala102Aspp.A102DQ96QB1protein_codingdeleterious_low_confidence(0)possibly_damaging(0.905)TCGA-AO-A124-01Breastbreast invasive carcinomaFemale<65I/IIChemotherapydoxorubicinSD
DLC1SNVMissense_Mutationc.3205N>Cp.Asp1069Hisp.D1069HQ96QB1protein_codingdeleterious(0)benign(0.354)TCGA-C8-A26Y-01Breastbreast invasive carcinomaFemale>=65I/IIUnknownUnknownSD
DLC1SNVMissense_Mutationc.2882N>Ap.Pro961Hisp.P961HQ96QB1protein_codingdeleterious(0.02)possibly_damaging(0.525)TCGA-D8-A1JF-01Breastbreast invasive carcinomaFemale>=65III/IVUnknownUnknownSD
DLC1SNVMissense_Mutationrs745492706c.878N>Ap.Gly293Aspp.G293DQ96QB1protein_codingtolerated_low_confidence(0.35)benign(0.001)TCGA-D8-A1XF-01Breastbreast invasive carcinomaFemale<65I/IIChemotherapyadriamycin+cyclophosphamideSD
Page: 1 2 3 4 5 6 7 8 9 10 11 12 13 14 15 16 17 18 19 20 21 22 23 24 25 26 

Top

Related drugs of malignant transformation related genes

check buttonIdentification of chemicals and drugs interact with genes involved in malignant transfromation
(DGIdb 4.0)
Entrez IDSymbolCategoryInteraction TypesDrug Claim NameDrug NamePMIDs
Page: 1