
|
|||||
|
 | |
| |
| |
| |
| |
| |
|
Gene: DDX39B |
Gene summary for DDX39B |
| Gene information | Species | Human | Gene symbol | DDX39B | Gene ID | 7919 |
| Gene name | DExD-box helicase 39B | |
| Gene Alias | BAT1 | |
| Cytomap | 6p21.33 | |
| Gene Type | protein-coding | GO ID | GO:0000075 | UniProtAcc | A0A024RCM3 |
Top |
Malignant transformation analysis |
| Identification of the aberrant gene expression in precancerous and cancerous lesions by comparing the gene expression of stem-like cells in diseased tissues with normal stem cells |
| Entrez ID | Symbol | Replicates | Species | Organ | Tissue | Adj P-value | Log2FC | Malignancy |
| 7919 | DDX39B | HTA11_3410_2000001011 | Human | Colorectum | AD | 7.05e-23 | 4.15e-01 | 0.0155 |
| 7919 | DDX39B | HTA11_2487_2000001011 | Human | Colorectum | SER | 3.82e-20 | 5.88e-01 | -0.1808 |
| 7919 | DDX39B | HTA11_2951_2000001011 | Human | Colorectum | AD | 1.84e-10 | 5.85e-01 | 0.0216 |
| 7919 | DDX39B | HTA11_1938_2000001011 | Human | Colorectum | AD | 5.76e-31 | 7.71e-01 | -0.0811 |
| 7919 | DDX39B | HTA11_78_2000001011 | Human | Colorectum | AD | 3.57e-32 | 6.94e-01 | -0.1088 |
| 7919 | DDX39B | HTA11_347_2000001011 | Human | Colorectum | AD | 3.89e-58 | 9.40e-01 | -0.1954 |
| 7919 | DDX39B | HTA11_411_2000001011 | Human | Colorectum | SER | 6.89e-14 | 9.53e-01 | -0.2602 |
| 7919 | DDX39B | HTA11_2112_2000001011 | Human | Colorectum | SER | 6.90e-09 | 5.59e-01 | -0.2196 |
| 7919 | DDX39B | HTA11_3361_2000001011 | Human | Colorectum | AD | 1.96e-16 | 5.89e-01 | -0.1207 |
| 7919 | DDX39B | HTA11_83_2000001011 | Human | Colorectum | SER | 2.91e-27 | 7.43e-01 | -0.1526 |
| 7919 | DDX39B | HTA11_696_2000001011 | Human | Colorectum | AD | 1.66e-48 | 7.71e-01 | -0.1464 |
| 7919 | DDX39B | HTA11_866_2000001011 | Human | Colorectum | AD | 1.68e-40 | 7.09e-01 | -0.1001 |
| 7919 | DDX39B | HTA11_1391_2000001011 | Human | Colorectum | AD | 3.17e-42 | 1.01e+00 | -0.059 |
| 7919 | DDX39B | HTA11_2992_2000001011 | Human | Colorectum | SER | 2.50e-12 | 5.66e-01 | -0.1706 |
| 7919 | DDX39B | HTA11_5212_2000001011 | Human | Colorectum | AD | 1.91e-11 | 4.78e-01 | -0.2061 |
| 7919 | DDX39B | HTA11_5216_2000001011 | Human | Colorectum | SER | 2.17e-09 | 4.66e-01 | -0.1462 |
| 7919 | DDX39B | HTA11_546_2000001011 | Human | Colorectum | AD | 2.07e-24 | 8.00e-01 | -0.0842 |
| 7919 | DDX39B | HTA11_7862_2000001011 | Human | Colorectum | AD | 7.27e-11 | 4.04e-01 | -0.0179 |
| 7919 | DDX39B | HTA11_866_3004761011 | Human | Colorectum | AD | 1.47e-27 | 6.15e-01 | 0.096 |
| 7919 | DDX39B | HTA11_4255_2000001011 | Human | Colorectum | SER | 6.82e-15 | 6.95e-01 | 0.0446 |
| Page: 1 2 3 4 5 6 7 8 9 |
| Tissue | Expression Dynamics | Abbreviation |
| Colorectum (GSE201348) |  | FAP: Familial adenomatous polyposis |
| CRC: Colorectal cancer | ||
| Colorectum (HTA11) |  | AD: Adenomas |
| SER: Sessile serrated lesions | ||
| MSI-H: Microsatellite-high colorectal cancer | ||
| MSS: Microsatellite stable colorectal cancer | ||
| Esophagus |  | ESCC: Esophageal squamous cell carcinoma |
| HGIN: High-grade intraepithelial neoplasias | ||
| LGIN: Low-grade intraepithelial neoplasias | ||
| GC |  | CAG: Chronic atrophic gastritis |
| CAG with IM: Chronic atrophic gastritis with intestinal metaplasia | ||
| CSG: Chronic superficial gastritis | ||
| GC: Gastric cancer | ||
| SIM: Severe intestinal metaplasia | ||
| WIM: Wild intestinal metaplasia | ||
| Lung | 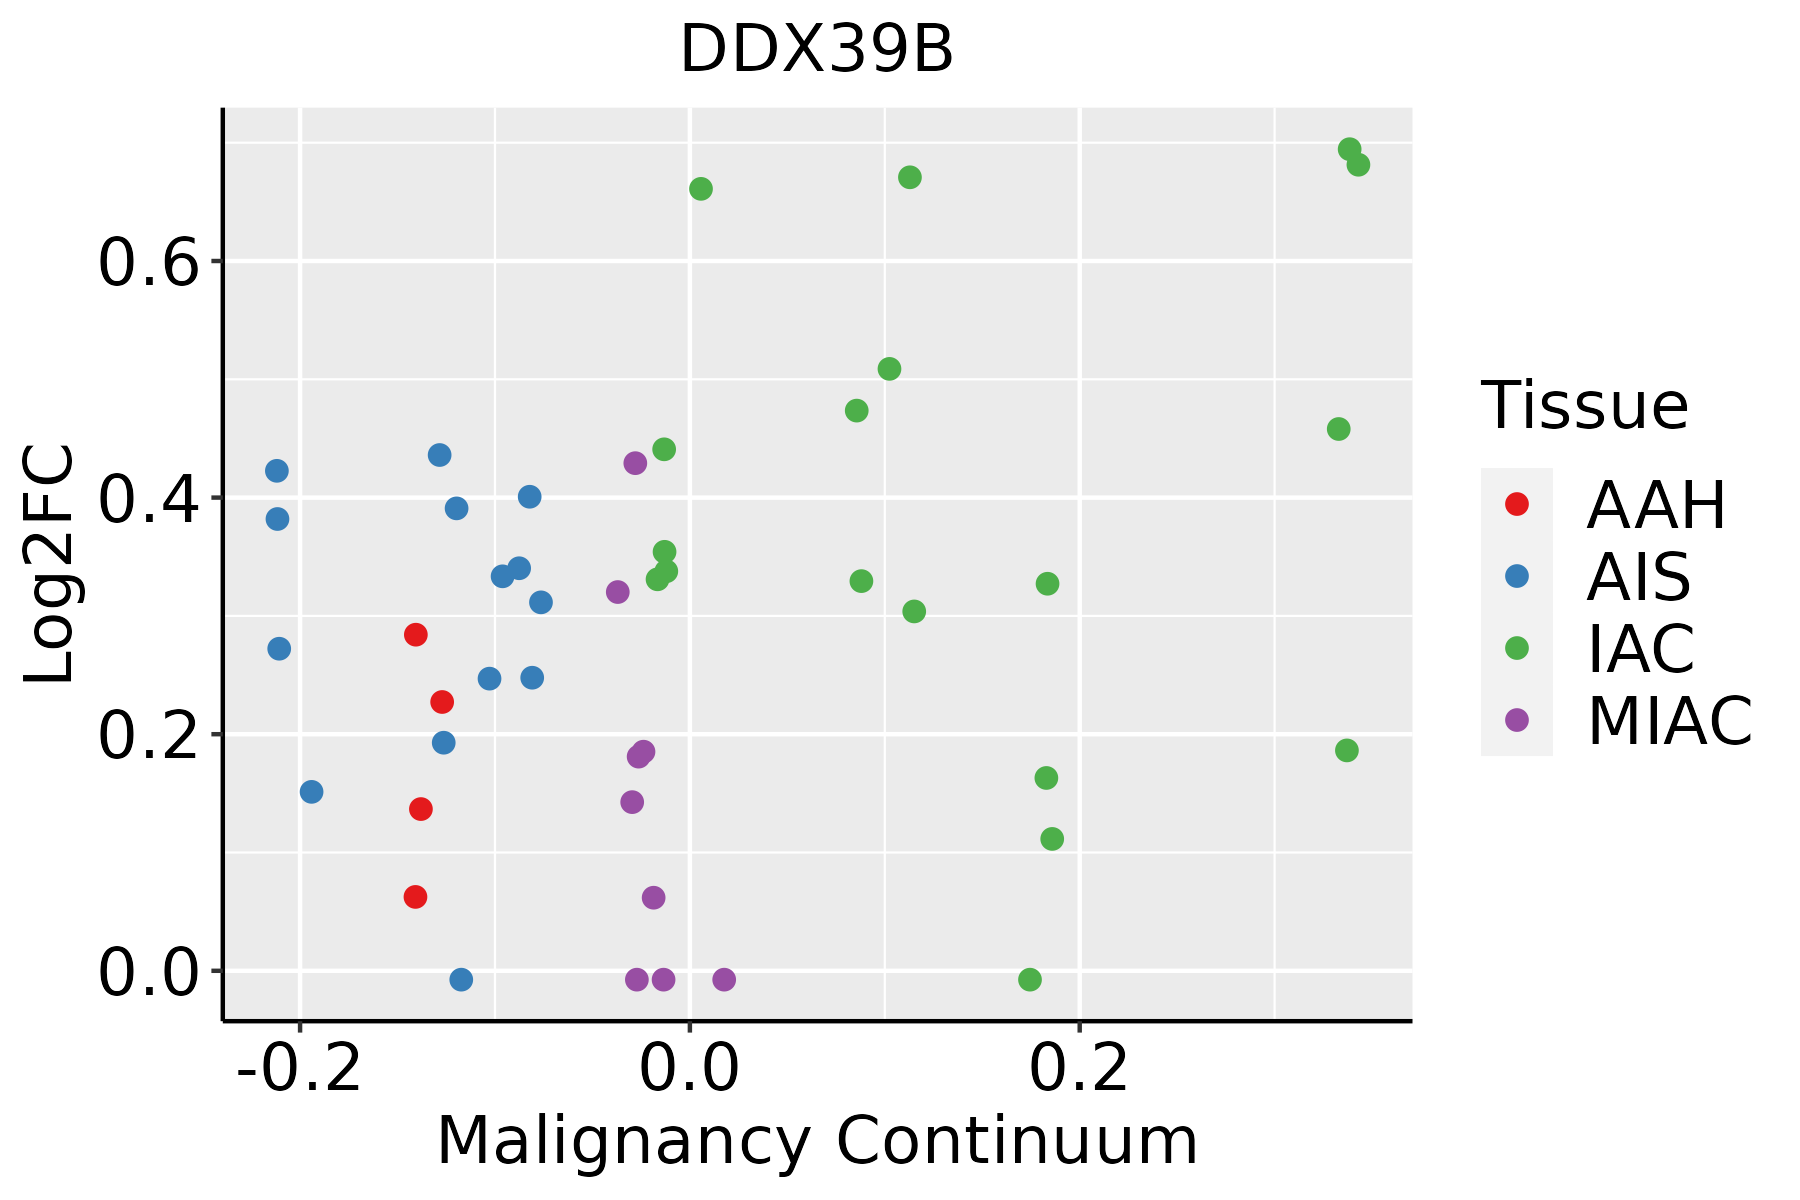 | AAH: Atypical adenomatous hyperplasia |
| AIS: Adenocarcinoma in situ | ||
| IAC: Invasive lung adenocarcinoma | ||
| MIA: Minimally invasive adenocarcinoma | ||
| Prostate | 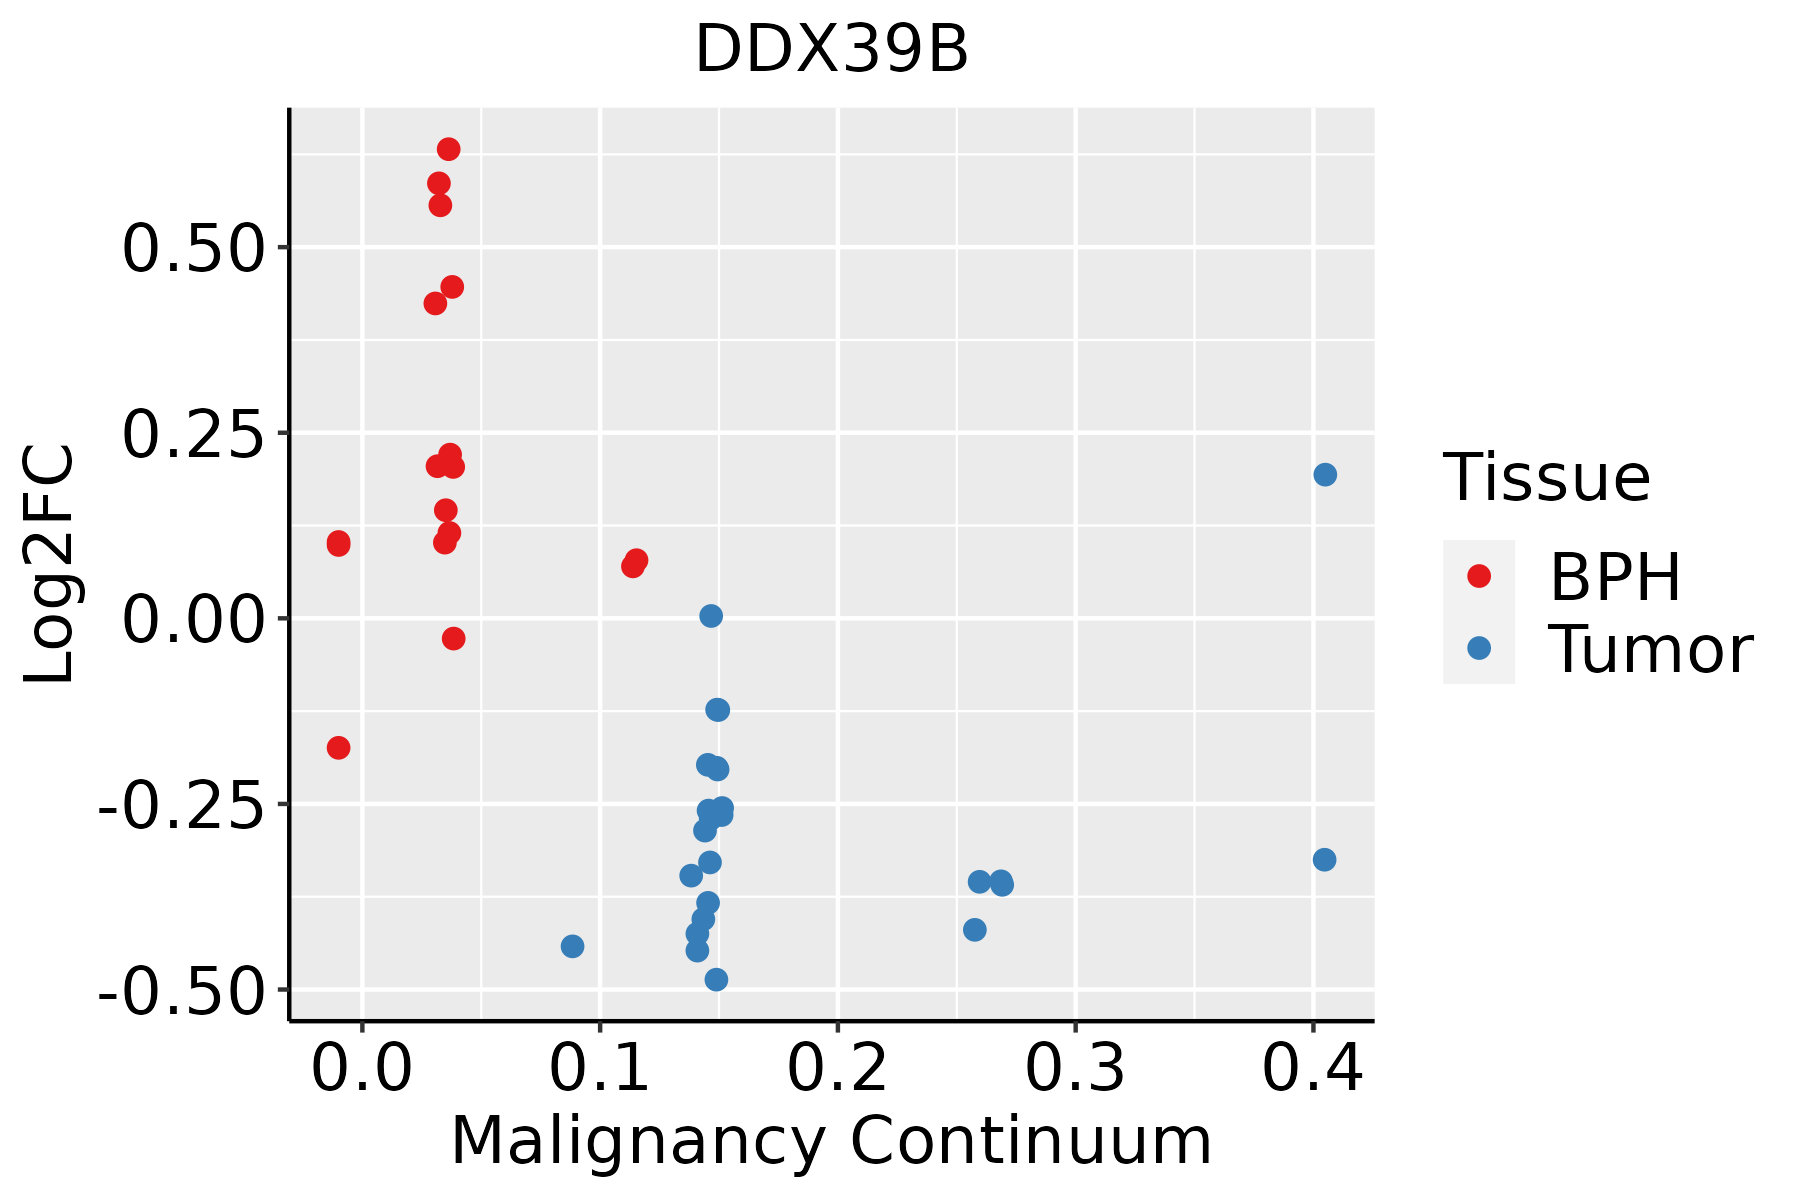 | BPH: Benign Prostatic Hyperplasia |
| Skin | 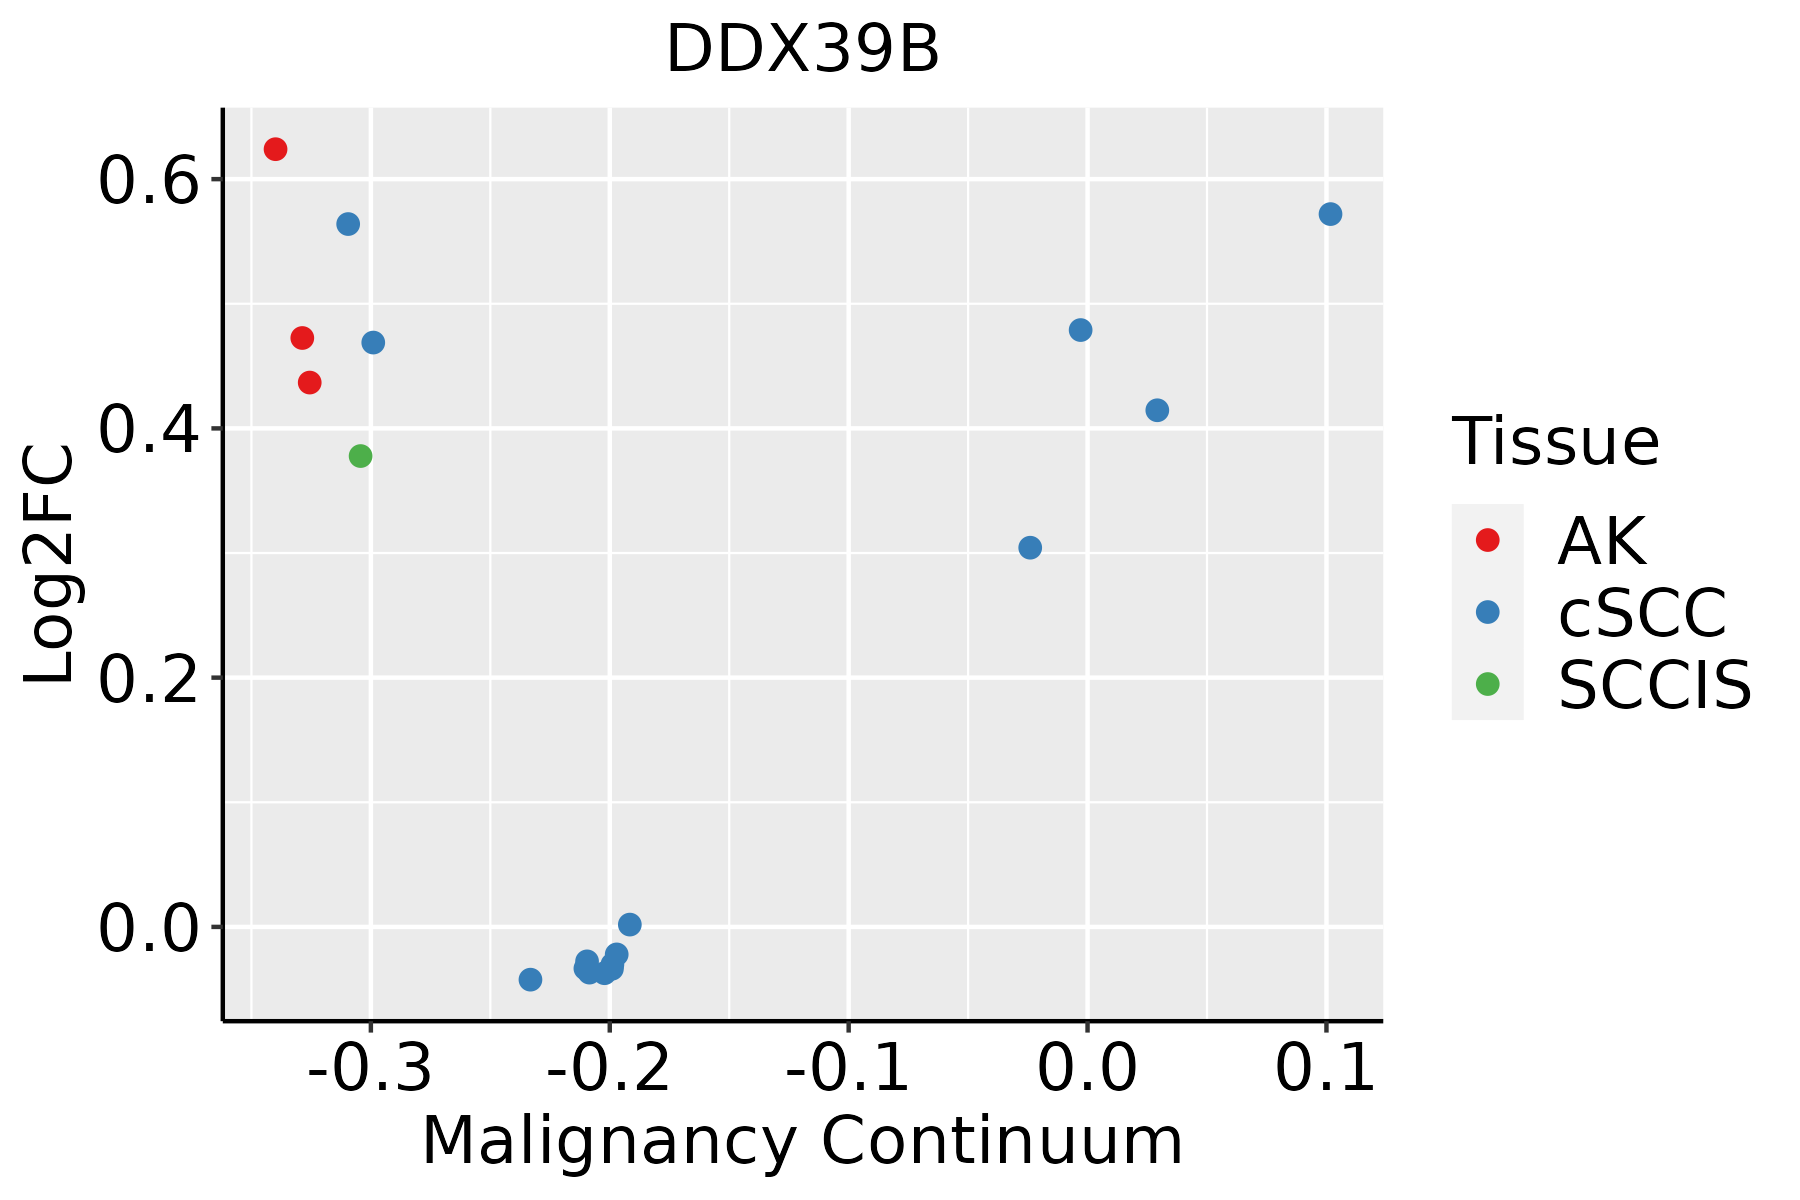 | AK: Actinic keratosis |
| cSCC: Cutaneous squamous cell carcinoma | ||
| SCCIS:squamous cell carcinoma in situ | ||
| Thyroid |  | ATC: Anaplastic thyroid cancer |
| HT: Hashimoto's thyroiditis | ||
| PTC: Papillary thyroid cancer |
| ∗log2FC in expression of this searched gene in stem-like cells from each diseased tissue sample relative to stem-like cells in normal samples in each tissue plotted against the malignancy continuum. Samples are colored based on if they are from different disease stage. |
Top |
Malignant transformation related pathway analysis |
| Find out the enriched GO biological processes and KEGG pathways involved in transition from healthy to precancer to cancer |
| Tissue | Disease Stage | Enriched GO biological Processes |
| Colorectum | AD |  |
| Colorectum | SER |  |
| Colorectum | MSS |  |
| Colorectum | MSI-H |  |
| Colorectum | FAP |  |
| ∗Top 15 enriched GO BP terms are showed in the bar plot of each disease state in each tissue. Each row represents a significant GO biological process which is colored according to the -log10(p.adjust). |
| Page: 1 2 3 4 5 6 7 8 9 |
| GO ID | Tissue | Disease Stage | Description | Gene Ratio | Bg Ratio | pvalue | p.adjust | Count |
| GO:001489612 | Prostate | Tumor | muscle hypertrophy | 35/3246 | 104/18723 | 4.14e-05 | 4.70e-04 | 35 |
| GO:001489711 | Prostate | Tumor | striated muscle hypertrophy | 34/3246 | 102/18723 | 6.59e-05 | 7.10e-04 | 34 |
| GO:004350211 | Prostate | Tumor | regulation of muscle adaptation | 33/3246 | 98/18723 | 6.69e-05 | 7.18e-04 | 33 |
| GO:005105413 | Prostate | Tumor | positive regulation of DNA metabolic process | 57/3246 | 201/18723 | 6.77e-05 | 7.21e-04 | 57 |
| GO:000330011 | Prostate | Tumor | cardiac muscle hypertrophy | 33/3246 | 99/18723 | 8.38e-05 | 8.41e-04 | 33 |
| GO:004578714 | Prostate | Tumor | positive regulation of cell cycle | 81/3246 | 313/18723 | 8.45e-05 | 8.46e-04 | 81 |
| GO:000635412 | Prostate | Tumor | DNA-templated transcription, elongation | 31/3246 | 91/18723 | 8.58e-05 | 8.53e-04 | 31 |
| GO:007189714 | Prostate | Tumor | DNA biosynthetic process | 51/3246 | 180/18723 | 1.63e-04 | 1.46e-03 | 51 |
| GO:004277012 | Prostate | Tumor | signal transduction in response to DNA damage | 49/3246 | 172/18723 | 1.87e-04 | 1.65e-03 | 49 |
| GO:200102016 | Prostate | Tumor | regulation of response to DNA damage stimulus | 59/3246 | 219/18723 | 2.37e-04 | 2.01e-03 | 59 |
| GO:009025713 | Prostate | Tumor | regulation of muscle system process | 66/3246 | 252/18723 | 2.54e-04 | 2.13e-03 | 66 |
| GO:003150312 | Prostate | Tumor | protein-containing complex localization | 59/3246 | 220/18723 | 2.71e-04 | 2.24e-03 | 59 |
| GO:00106131 | Prostate | Tumor | positive regulation of cardiac muscle hypertrophy | 16/3246 | 38/18723 | 3.00e-04 | 2.42e-03 | 16 |
| GO:005105212 | Prostate | Tumor | regulation of DNA metabolic process | 88/3246 | 359/18723 | 3.23e-04 | 2.59e-03 | 88 |
| GO:004269213 | Prostate | Tumor | muscle cell differentiation | 93/3246 | 384/18723 | 3.45e-04 | 2.73e-03 | 93 |
| GO:001593113 | Prostate | Tumor | nucleobase-containing compound transport | 59/3246 | 222/18723 | 3.49e-04 | 2.75e-03 | 59 |
| GO:004578611 | Prostate | Tumor | negative regulation of cell cycle | 93/3246 | 385/18723 | 3.79e-04 | 2.95e-03 | 93 |
| GO:00147421 | Prostate | Tumor | positive regulation of muscle hypertrophy | 16/3246 | 39/18723 | 4.27e-04 | 3.26e-03 | 16 |
| GO:005102813 | Prostate | Tumor | mRNA transport | 38/3246 | 130/18723 | 5.44e-04 | 3.96e-03 | 38 |
| GO:000024512 | Prostate | Tumor | spliceosomal complex assembly | 26/3246 | 79/18723 | 5.68e-04 | 4.11e-03 | 26 |
| Page: 1 2 3 4 5 6 7 8 9 10 11 12 13 14 15 16 17 18 19 20 21 22 23 24 25 26 27 28 29 30 31 32 33 34 35 36 37 38 39 40 41 42 |
| Pathway ID | Tissue | Disease Stage | Description | Gene Ratio | Bg Ratio | pvalue | p.adjust | qvalue | Count |
| hsa03015 | Colorectum | AD | mRNA surveillance pathway | 35/2092 | 97/8465 | 7.95e-03 | 3.13e-02 | 2.00e-02 | 35 |
| hsa030151 | Colorectum | AD | mRNA surveillance pathway | 35/2092 | 97/8465 | 7.95e-03 | 3.13e-02 | 2.00e-02 | 35 |
| hsa030402 | Colorectum | MSS | Spliceosome | 66/1875 | 217/8465 | 2.58e-03 | 1.27e-02 | 7.81e-03 | 66 |
| hsa030403 | Colorectum | MSS | Spliceosome | 66/1875 | 217/8465 | 2.58e-03 | 1.27e-02 | 7.81e-03 | 66 |
| hsa030404 | Colorectum | MSI-H | Spliceosome | 37/797 | 217/8465 | 2.49e-04 | 3.23e-03 | 2.70e-03 | 37 |
| hsa030405 | Colorectum | MSI-H | Spliceosome | 37/797 | 217/8465 | 2.49e-04 | 3.23e-03 | 2.70e-03 | 37 |
| hsa0304018 | Esophagus | HGIN | Spliceosome | 79/1383 | 217/8465 | 3.22e-13 | 7.00e-12 | 5.56e-12 | 79 |
| hsa030159 | Esophagus | HGIN | mRNA surveillance pathway | 30/1383 | 97/8465 | 2.48e-04 | 2.69e-03 | 2.14e-03 | 30 |
| hsa030137 | Esophagus | HGIN | Nucleocytoplasmic transport | 31/1383 | 108/8465 | 8.29e-04 | 7.95e-03 | 6.31e-03 | 31 |
| hsa0304019 | Esophagus | HGIN | Spliceosome | 79/1383 | 217/8465 | 3.22e-13 | 7.00e-12 | 5.56e-12 | 79 |
| hsa0301514 | Esophagus | HGIN | mRNA surveillance pathway | 30/1383 | 97/8465 | 2.48e-04 | 2.69e-03 | 2.14e-03 | 30 |
| hsa0301312 | Esophagus | HGIN | Nucleocytoplasmic transport | 31/1383 | 108/8465 | 8.29e-04 | 7.95e-03 | 6.31e-03 | 31 |
| hsa0301321 | Esophagus | ESCC | Nucleocytoplasmic transport | 89/4205 | 108/8465 | 1.20e-12 | 2.37e-11 | 1.21e-11 | 89 |
| hsa0301524 | Esophagus | ESCC | mRNA surveillance pathway | 72/4205 | 97/8465 | 6.12e-07 | 4.10e-06 | 2.10e-06 | 72 |
| hsa0304027 | Esophagus | ESCC | Spliceosome | 128/4205 | 217/8465 | 3.31e-03 | 8.79e-03 | 4.50e-03 | 128 |
| hsa0301331 | Esophagus | ESCC | Nucleocytoplasmic transport | 89/4205 | 108/8465 | 1.20e-12 | 2.37e-11 | 1.21e-11 | 89 |
| hsa0301534 | Esophagus | ESCC | mRNA surveillance pathway | 72/4205 | 97/8465 | 6.12e-07 | 4.10e-06 | 2.10e-06 | 72 |
| hsa0304037 | Esophagus | ESCC | Spliceosome | 128/4205 | 217/8465 | 3.31e-03 | 8.79e-03 | 4.50e-03 | 128 |
| hsa0304010 | Prostate | BPH | Spliceosome | 62/1718 | 217/8465 | 1.99e-03 | 7.92e-03 | 4.90e-03 | 62 |
| hsa030155 | Prostate | BPH | mRNA surveillance pathway | 32/1718 | 97/8465 | 2.20e-03 | 8.63e-03 | 5.34e-03 | 32 |
| Page: 1 2 |
Top |
Cell-cell communication analysis |
| Identification of potential cell-cell interactions between two cell types and their ligand-receptor pairs for different disease states |
| Ligand | Receptor | LRpair | Pathway | Tissue | Disease Stage |
| Page: 1 |
Top |
Single-cell gene regulatory network inference analysis |
| Find out the significant the regulons (TFs) and the target genes of each regulon across cell types for different disease states |
| TF | Cell Type | Tissue | Disease Stage | Target Gene | RSS | Regulon Activity |
| ∗The dot plots of a searched regulon are shown for all cell subpopulations in each disease state of each tissue based on the regulon specific score inferred using pySCENIC and by calculating the average expression. |
| Page: 1 |
Top |
Somatic mutation of malignant transformation related genes |
| Annotation of somatic variants for genes involved in malignant transformation |
| Hugo Symbol | Variant Class | Variant Classification | dbSNP RS | HGVSc | HGVSp | HGVSp Short | SWISSPROT | BIOTYPE | SIFT | PolyPhen | Tumor Sample Barcode | Tissue | Histology | Sex | Age | Stage | Therapy Types | Drugs | Outcome |
| DDX39B | SNV | Missense_Mutation | novel | c.1126G>T | p.Ala376Ser | p.A376S | Q13838 | protein_coding | deleterious(0.01) | probably_damaging(0.985) | TCGA-2W-A8YY-01 | Cervix | cervical & endocervical cancer | Female | <65 | I/II | Chemotherapy | cisplatin | CR |
| DDX39B | SNV | Missense_Mutation | c.1013N>A | p.Arg338Gln | p.R338Q | Q13838 | protein_coding | tolerated(0.09) | benign(0.011) | TCGA-A6-6781-01 | Colorectum | colon adenocarcinoma | Male | <65 | III/IV | Chemotherapy | oxaliplatin | SD | |
| DDX39B | SNV | Missense_Mutation | novel | c.599N>C | p.Lys200Thr | p.K200T | Q13838 | protein_coding | deleterious(0.03) | possibly_damaging(0.885) | TCGA-AG-A002-01 | Colorectum | rectum adenocarcinoma | Male | <65 | I/II | Unknown | Unknown | SD |
| DDX39B | deletion | Frame_Shift_Del | c.447delT | p.Phe149LeufsTer13 | p.F149Lfs*13 | Q13838 | protein_coding | TCGA-5M-AAT6-01 | Colorectum | colon adenocarcinoma | Female | <65 | III/IV | Unknown | Unknown | PD | |||
| DDX39B | deletion | Frame_Shift_Del | c.447delN | p.Phe149LeufsTer13 | p.F149Lfs*13 | Q13838 | protein_coding | TCGA-AA-3966-01 | Colorectum | colon adenocarcinoma | Female | >=65 | I/II | Unknown | Unknown | SD | |||
| DDX39B | deletion | Frame_Shift_Del | c.447delT | p.Phe149LeufsTer13 | p.F149Lfs*13 | Q13838 | protein_coding | TCGA-CK-5913-01 | Colorectum | colon adenocarcinoma | Female | <65 | I/II | Unknown | Unknown | SD | |||
| DDX39B | deletion | Frame_Shift_Del | c.447delN | p.Phe149LeufsTer13 | p.F149Lfs*13 | Q13838 | protein_coding | TCGA-CM-6162-01 | Colorectum | colon adenocarcinoma | Female | <65 | III/IV | Chemotherapy | oxaliplatin | SD | |||
| DDX39B | deletion | Frame_Shift_Del | c.447delT | p.Phe149LeufsTer13 | p.F149Lfs*13 | Q13838 | protein_coding | TCGA-DM-A1HB-01 | Colorectum | colon adenocarcinoma | Male | >=65 | III/IV | Unknown | Unknown | SD | |||
| DDX39B | deletion | In_Frame_Del | novel | c.814_816delNNN | p.Asn272del | p.N272del | Q13838 | protein_coding | TCGA-AG-3892-01 | Colorectum | rectum adenocarcinoma | Female | <65 | I/II | Unknown | Unknown | SD | ||
| DDX39B | SNV | Missense_Mutation | novel | c.1139N>A | p.Arg380Gln | p.R380Q | Q13838 | protein_coding | deleterious(0.01) | possibly_damaging(0.55) | TCGA-A5-A0G2-01 | Endometrium | uterine corpus endometrioid carcinoma | Female | <65 | III/IV | Unknown | Unknown | SD |
| Page: 1 2 3 4 5 |
Top |
Related drugs of malignant transformation related genes |
| Identification of chemicals and drugs interact with genes involved in malignant transfromation |
| (DGIdb 4.0) |
| Entrez ID | Symbol | Category | Interaction Types | Drug Claim Name | Drug Name | PMIDs |
| Page: 1 |

Copyright 2023-Present -The University of Texas Health Science Center at Houston |