
|
|||||
|
 | |
| |
| |
| |
| |
| |
|
Gene: CDKN2A |
Gene summary for CDKN2A |
| Gene information | Species | Human | Gene symbol | CDKN2A | Gene ID | 1029 |
| Gene name | cyclin dependent kinase inhibitor 2A | |
| Gene Alias | ARF | |
| Cytomap | 9p21.3 | |
| Gene Type | protein-coding | GO ID | GO:0000079 | UniProtAcc | K7PML8 |
Top |
Malignant transformation analysis |
| Identification of the aberrant gene expression in precancerous and cancerous lesions by comparing the gene expression of stem-like cells in diseased tissues with normal stem cells |
| Entrez ID | Symbol | Replicates | Species | Organ | Tissue | Adj P-value | Log2FC | Malignancy |
| 1029 | CDKN2A | GSM4909281 | Human | Breast | IDC | 7.28e-101 | 1.29e+00 | 0.21 |
| 1029 | CDKN2A | GSM4909282 | Human | Breast | IDC | 8.83e-101 | 1.36e+00 | -0.0288 |
| 1029 | CDKN2A | GSM4909285 | Human | Breast | IDC | 2.08e-134 | 1.64e+00 | 0.21 |
| 1029 | CDKN2A | GSM4909286 | Human | Breast | IDC | 5.88e-06 | 1.22e-01 | 0.1081 |
| 1029 | CDKN2A | GSM4909287 | Human | Breast | IDC | 1.26e-48 | 1.01e+00 | 0.2057 |
| 1029 | CDKN2A | GSM4909296 | Human | Breast | IDC | 3.61e-05 | 2.95e-01 | 0.1524 |
| 1029 | CDKN2A | GSM4909301 | Human | Breast | IDC | 9.80e-03 | 1.26e-01 | 0.1577 |
| 1029 | CDKN2A | GSM4909307 | Human | Breast | IDC | 3.54e-04 | 1.23e-01 | 0.1569 |
| 1029 | CDKN2A | GSM4909308 | Human | Breast | IDC | 2.14e-02 | 1.96e-01 | 0.158 |
| 1029 | CDKN2A | GSM4909321 | Human | Breast | IDC | 1.64e-11 | 4.24e-01 | 0.1559 |
| 1029 | CDKN2A | brca2 | Human | Breast | Precancer | 3.88e-02 | 1.36e-01 | -0.024 |
| 1029 | CDKN2A | M2 | Human | Breast | IDC | 5.82e-09 | 7.98e-01 | 0.21 |
| 1029 | CDKN2A | NCCBC3 | Human | Breast | DCIS | 1.52e-02 | 8.36e-02 | 0.1198 |
| 1029 | CDKN2A | P2 | Human | Breast | IDC | 1.20e-18 | 7.47e-01 | 0.21 |
| 1029 | CDKN2A | CA_HPV_2 | Human | Cervix | CC | 1.86e-28 | 7.13e-01 | 0.0391 |
| 1029 | CDKN2A | HSIL_HPV_2 | Human | Cervix | HSIL_HPV | 1.78e-19 | 5.54e-01 | 0.0208 |
| 1029 | CDKN2A | CCI_1 | Human | Cervix | CC | 6.57e-27 | 1.62e+00 | 0.528 |
| 1029 | CDKN2A | CCI_2 | Human | Cervix | CC | 5.09e-48 | 2.39e+00 | 0.5249 |
| 1029 | CDKN2A | CCI_3 | Human | Cervix | CC | 1.63e-26 | 1.40e+00 | 0.516 |
| 1029 | CDKN2A | Tumor | Human | Cervix | CC | 1.86e-113 | 1.50e+00 | 0.1241 |
| Page: 1 2 3 4 5 6 7 |
| Tissue | Expression Dynamics | Abbreviation |
| Breast |  | IDC: Invasive ductal carcinoma |
| DCIS: Ductal carcinoma in situ | ||
| Precancer(BRCA1-mut): Precancerous lesion from BRCA1 mutation carriers | ||
| Cervix |  | CC: Cervix cancer |
| HSIL_HPV: HPV-infected high-grade squamous intraepithelial lesions | ||
| N_HPV: HPV-infected normal cervix | ||
| Endometrium |  | AEH: Atypical endometrial hyperplasia |
| EEC: Endometrioid Cancer | ||
| Esophagus | 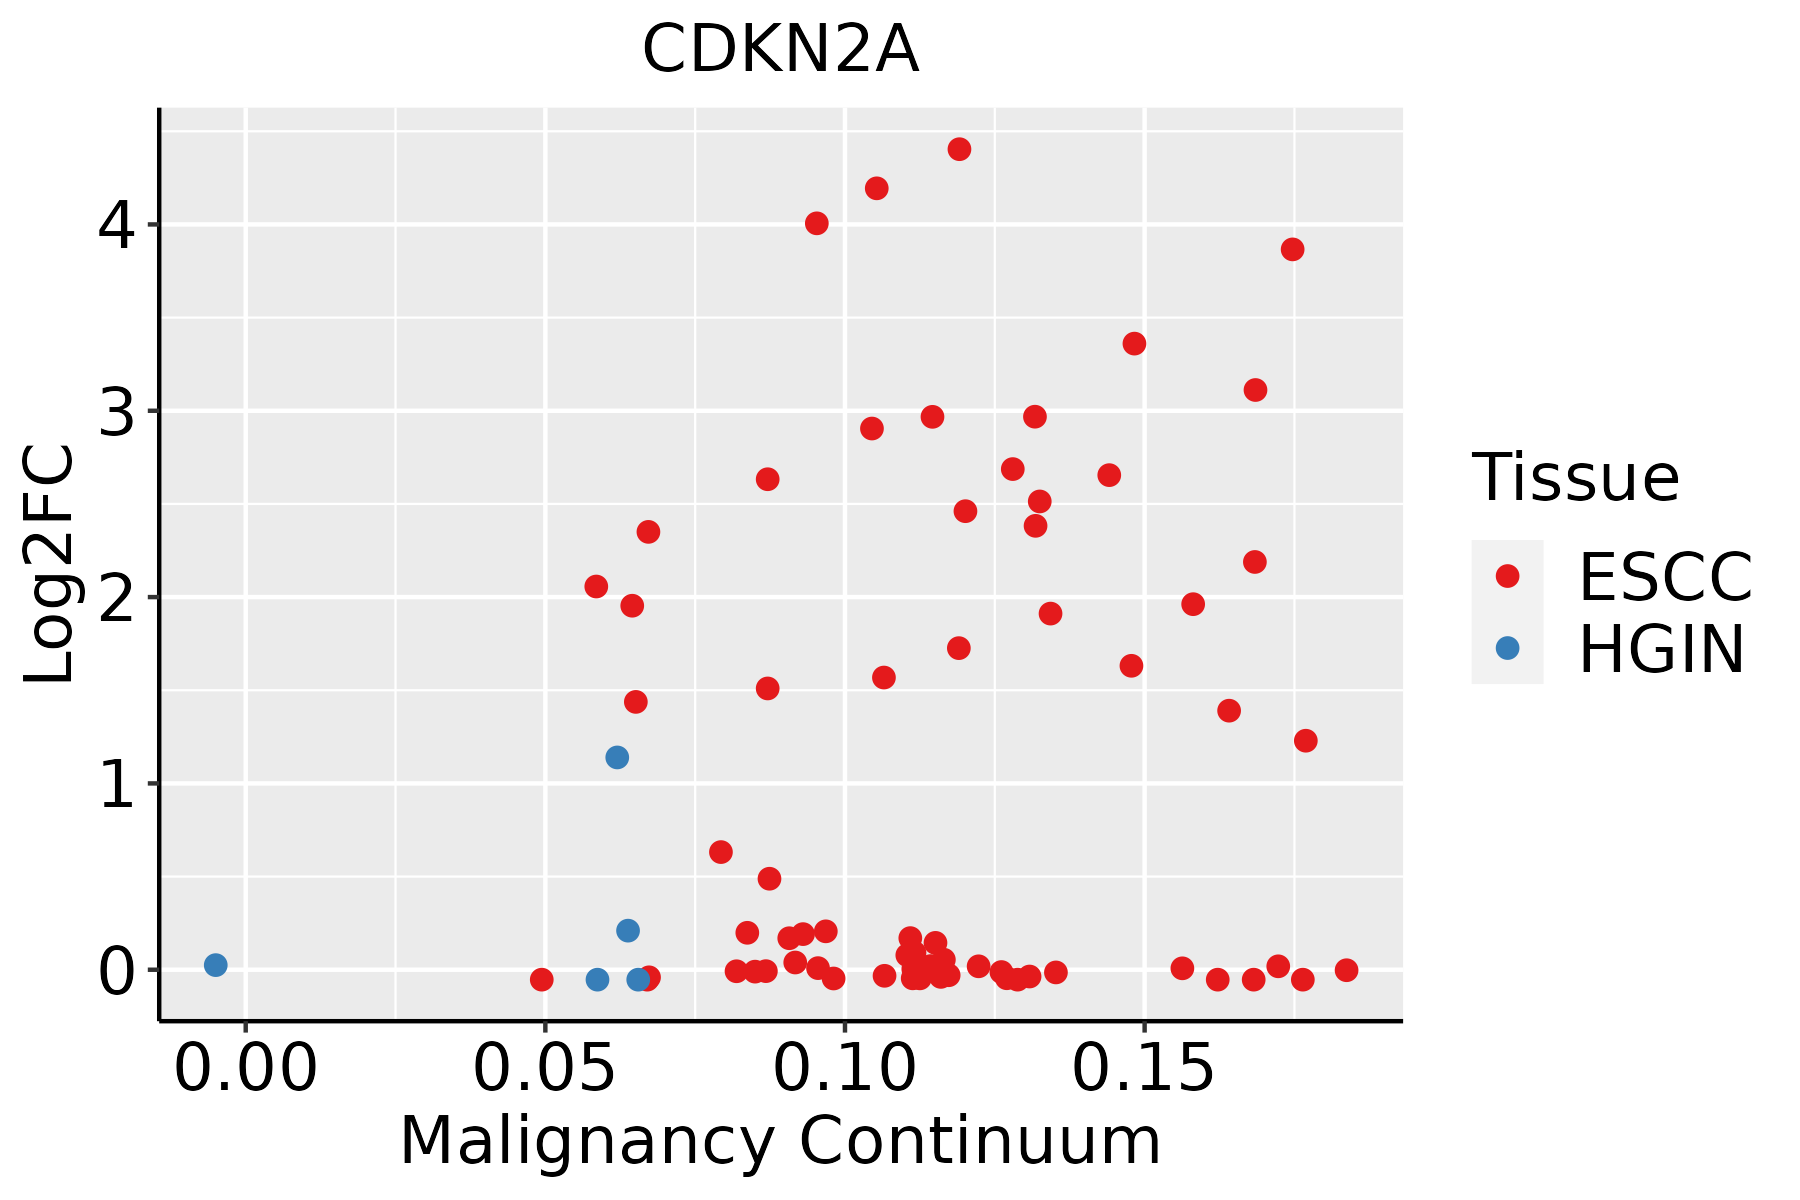 | ESCC: Esophageal squamous cell carcinoma |
| HGIN: High-grade intraepithelial neoplasias | ||
| LGIN: Low-grade intraepithelial neoplasias | ||
| GC | 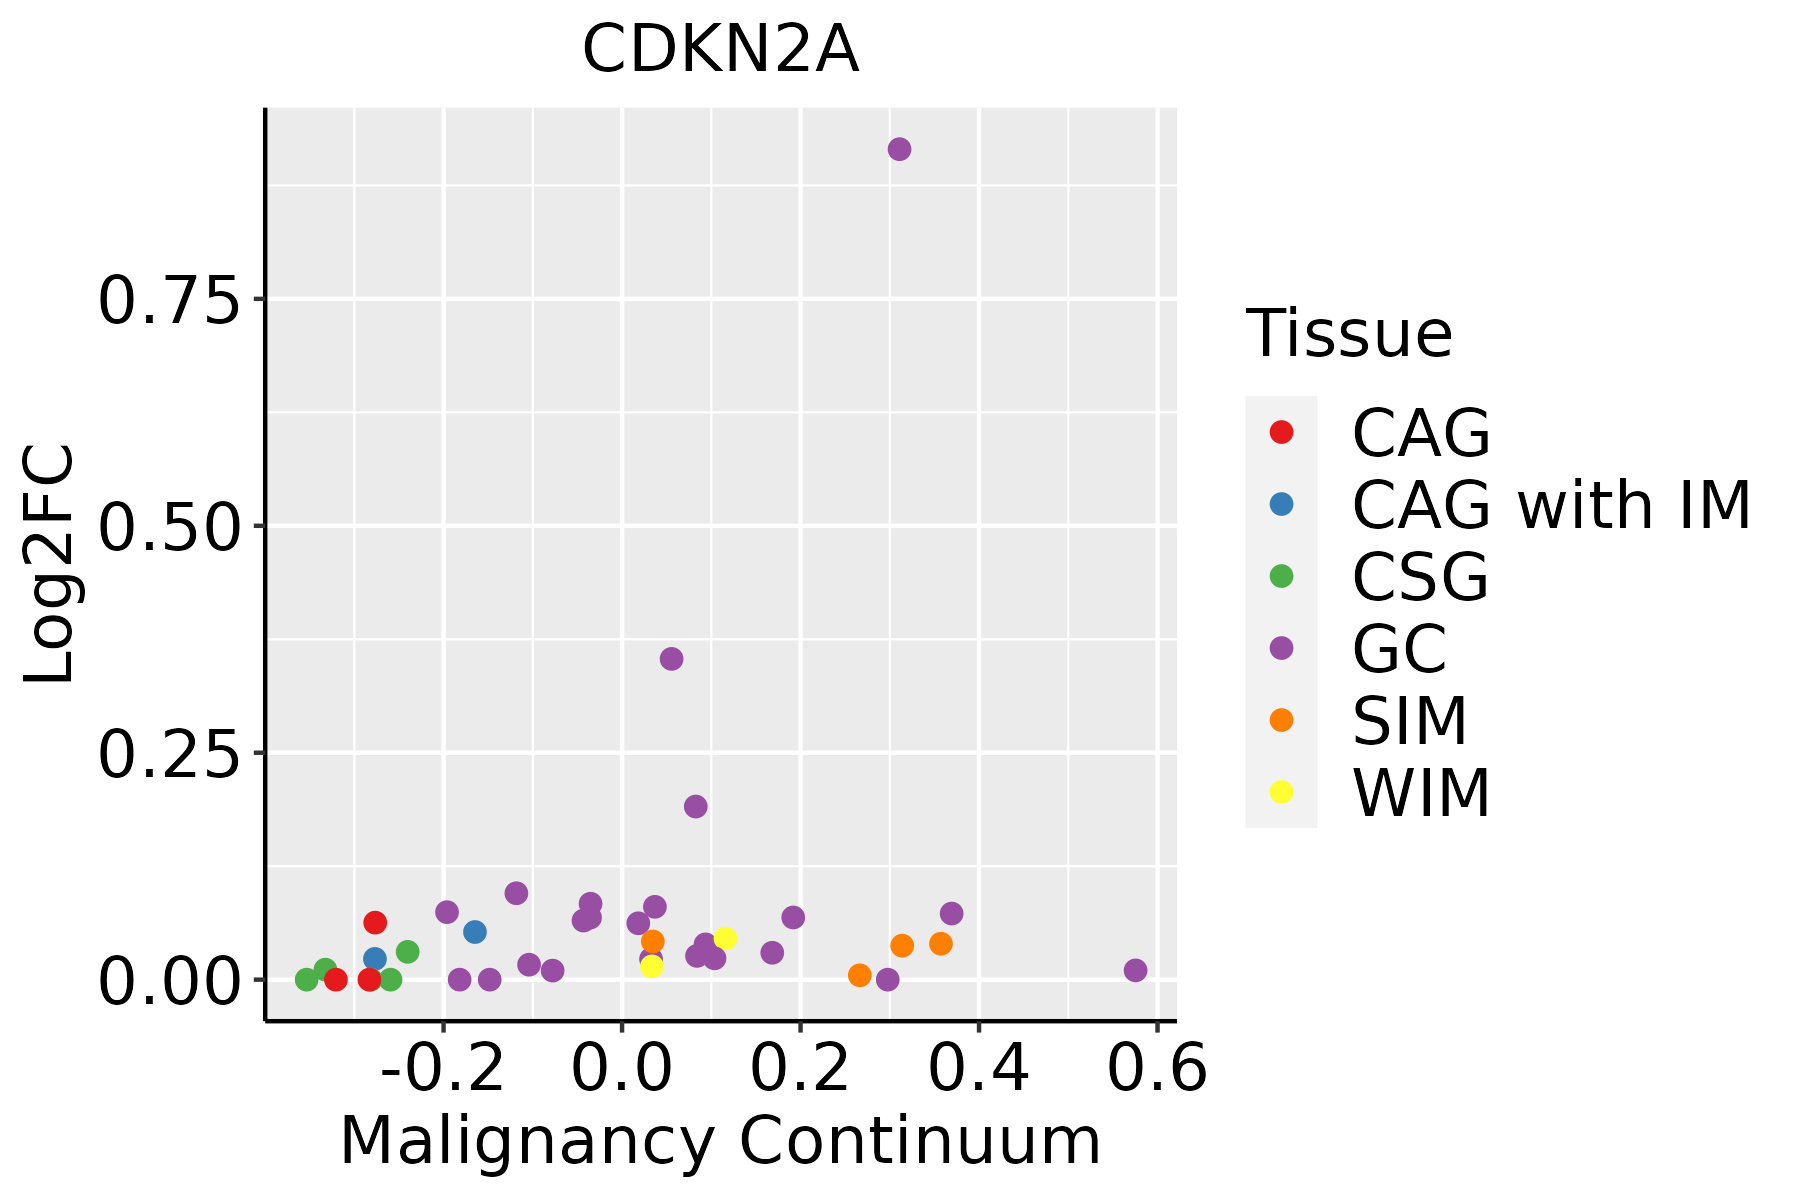 | CAG: Chronic atrophic gastritis |
| CAG with IM: Chronic atrophic gastritis with intestinal metaplasia | ||
| CSG: Chronic superficial gastritis | ||
| GC: Gastric cancer | ||
| SIM: Severe intestinal metaplasia | ||
| WIM: Wild intestinal metaplasia | ||
| Liver | 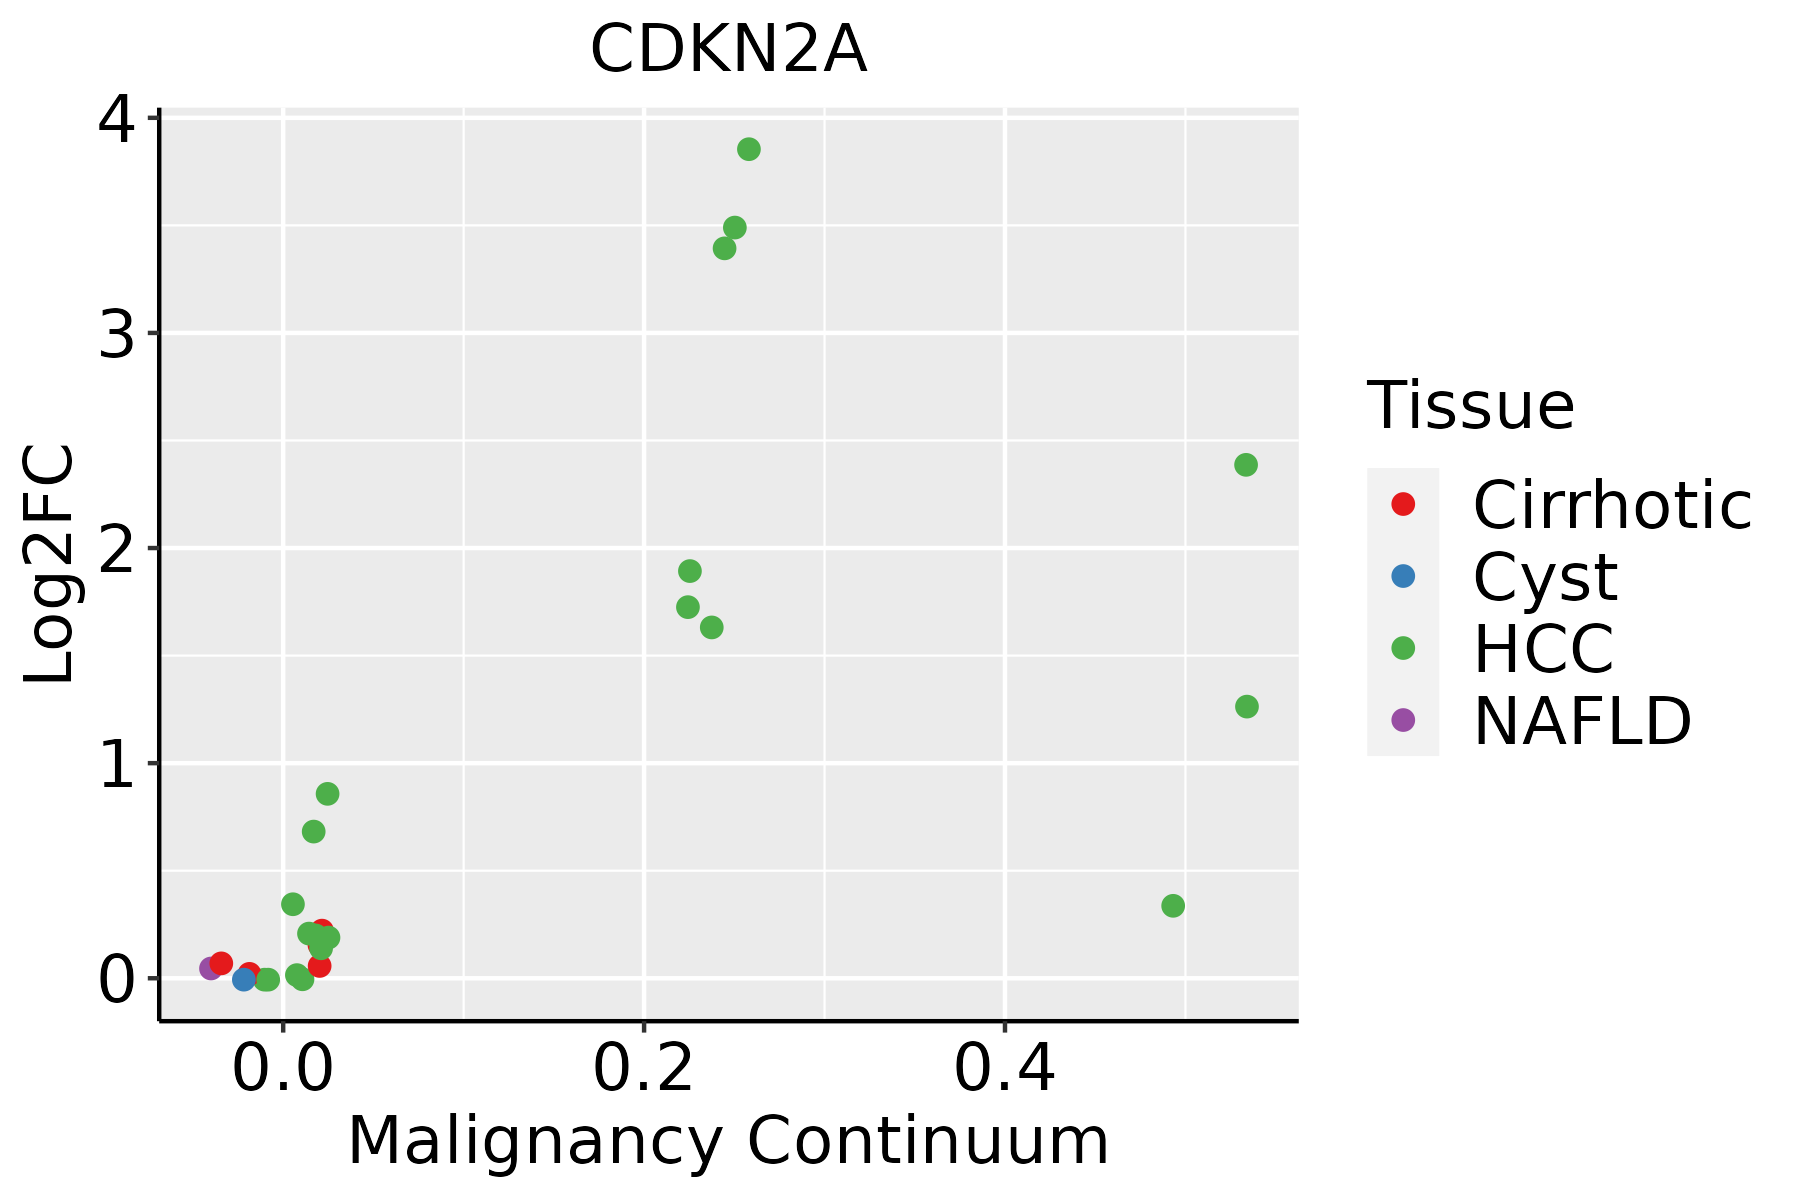 | HCC: Hepatocellular carcinoma |
| NAFLD: Non-alcoholic fatty liver disease | ||
| Lung |  | AAH: Atypical adenomatous hyperplasia |
| AIS: Adenocarcinoma in situ | ||
| IAC: Invasive lung adenocarcinoma | ||
| MIA: Minimally invasive adenocarcinoma | ||
| Oral Cavity | 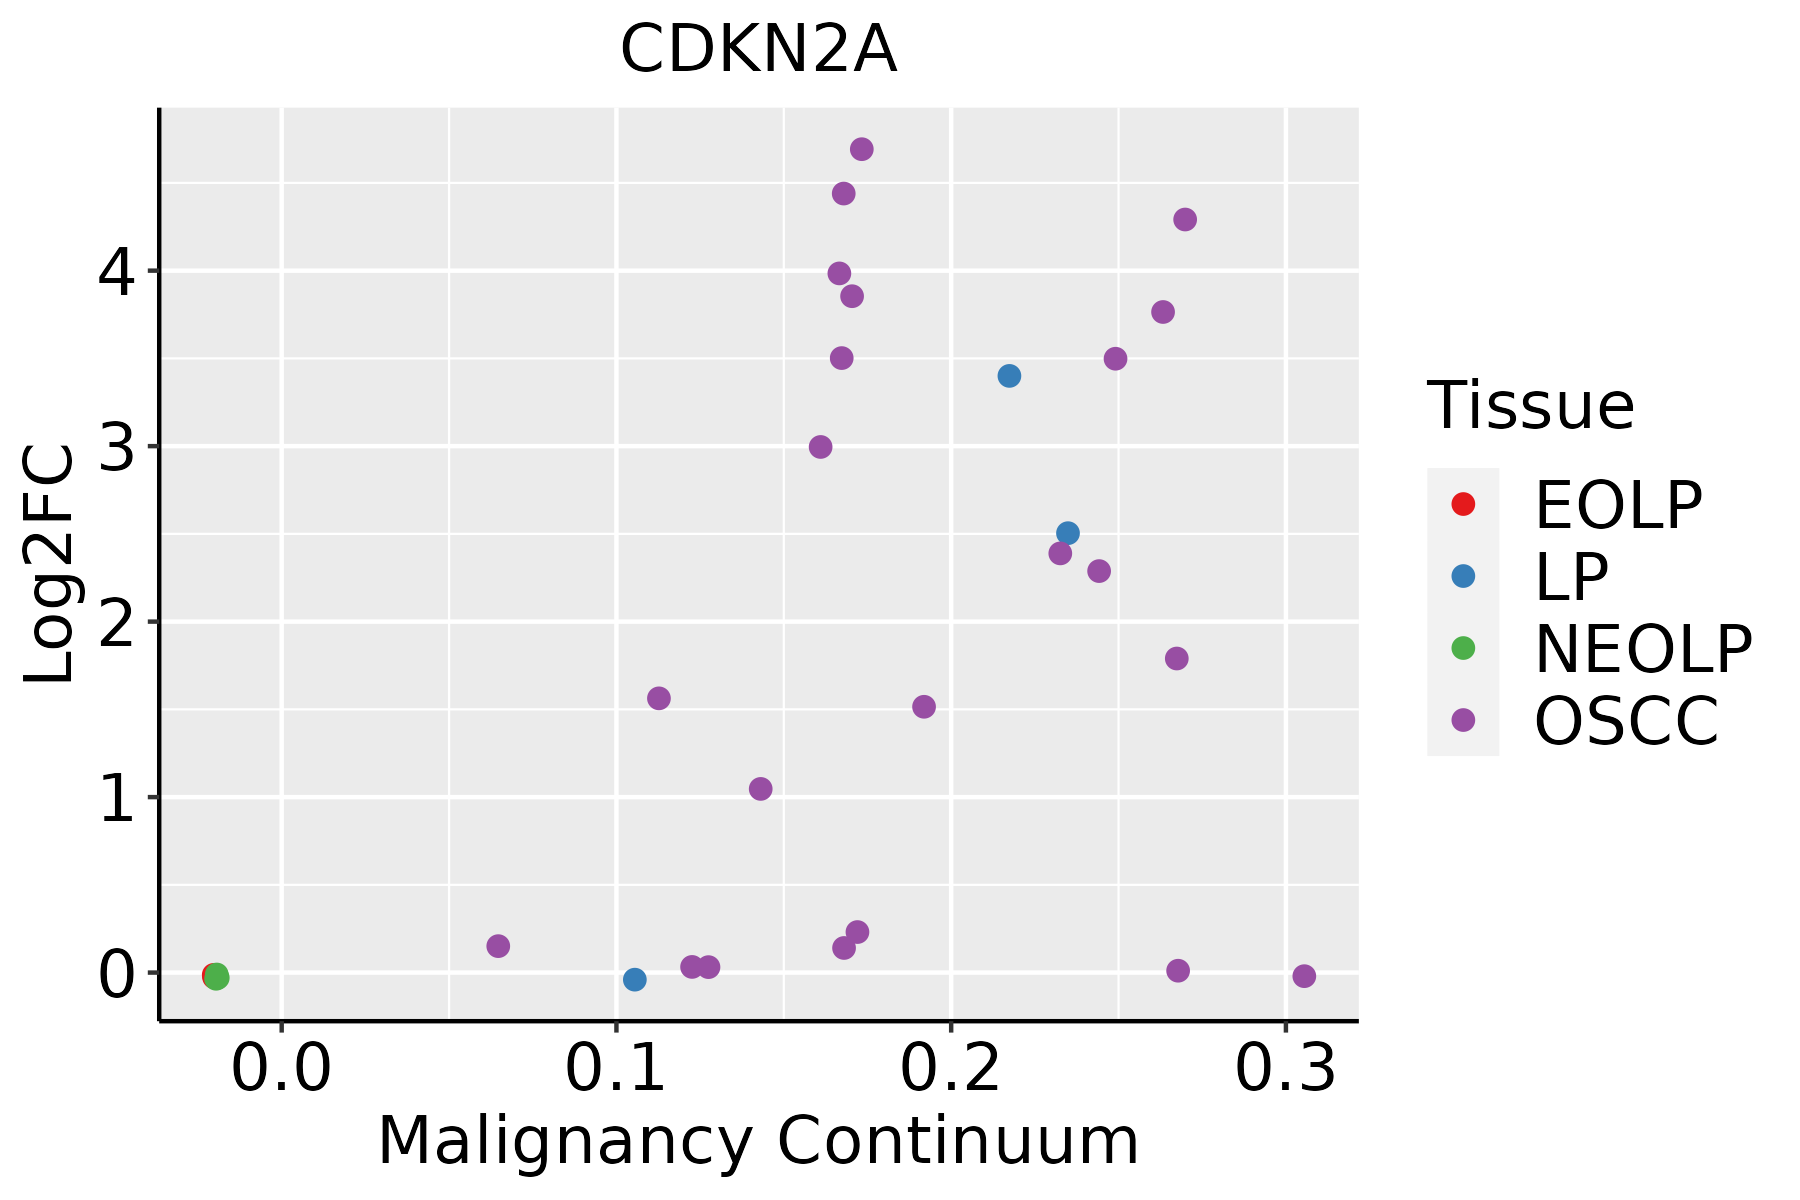 | EOLP: Erosive Oral lichen planus |
| LP: leukoplakia | ||
| NEOLP: Non-erosive oral lichen planus | ||
| OSCC: Oral squamous cell carcinoma | ||
| Prostate |  | BPH: Benign Prostatic Hyperplasia |
| Skin | 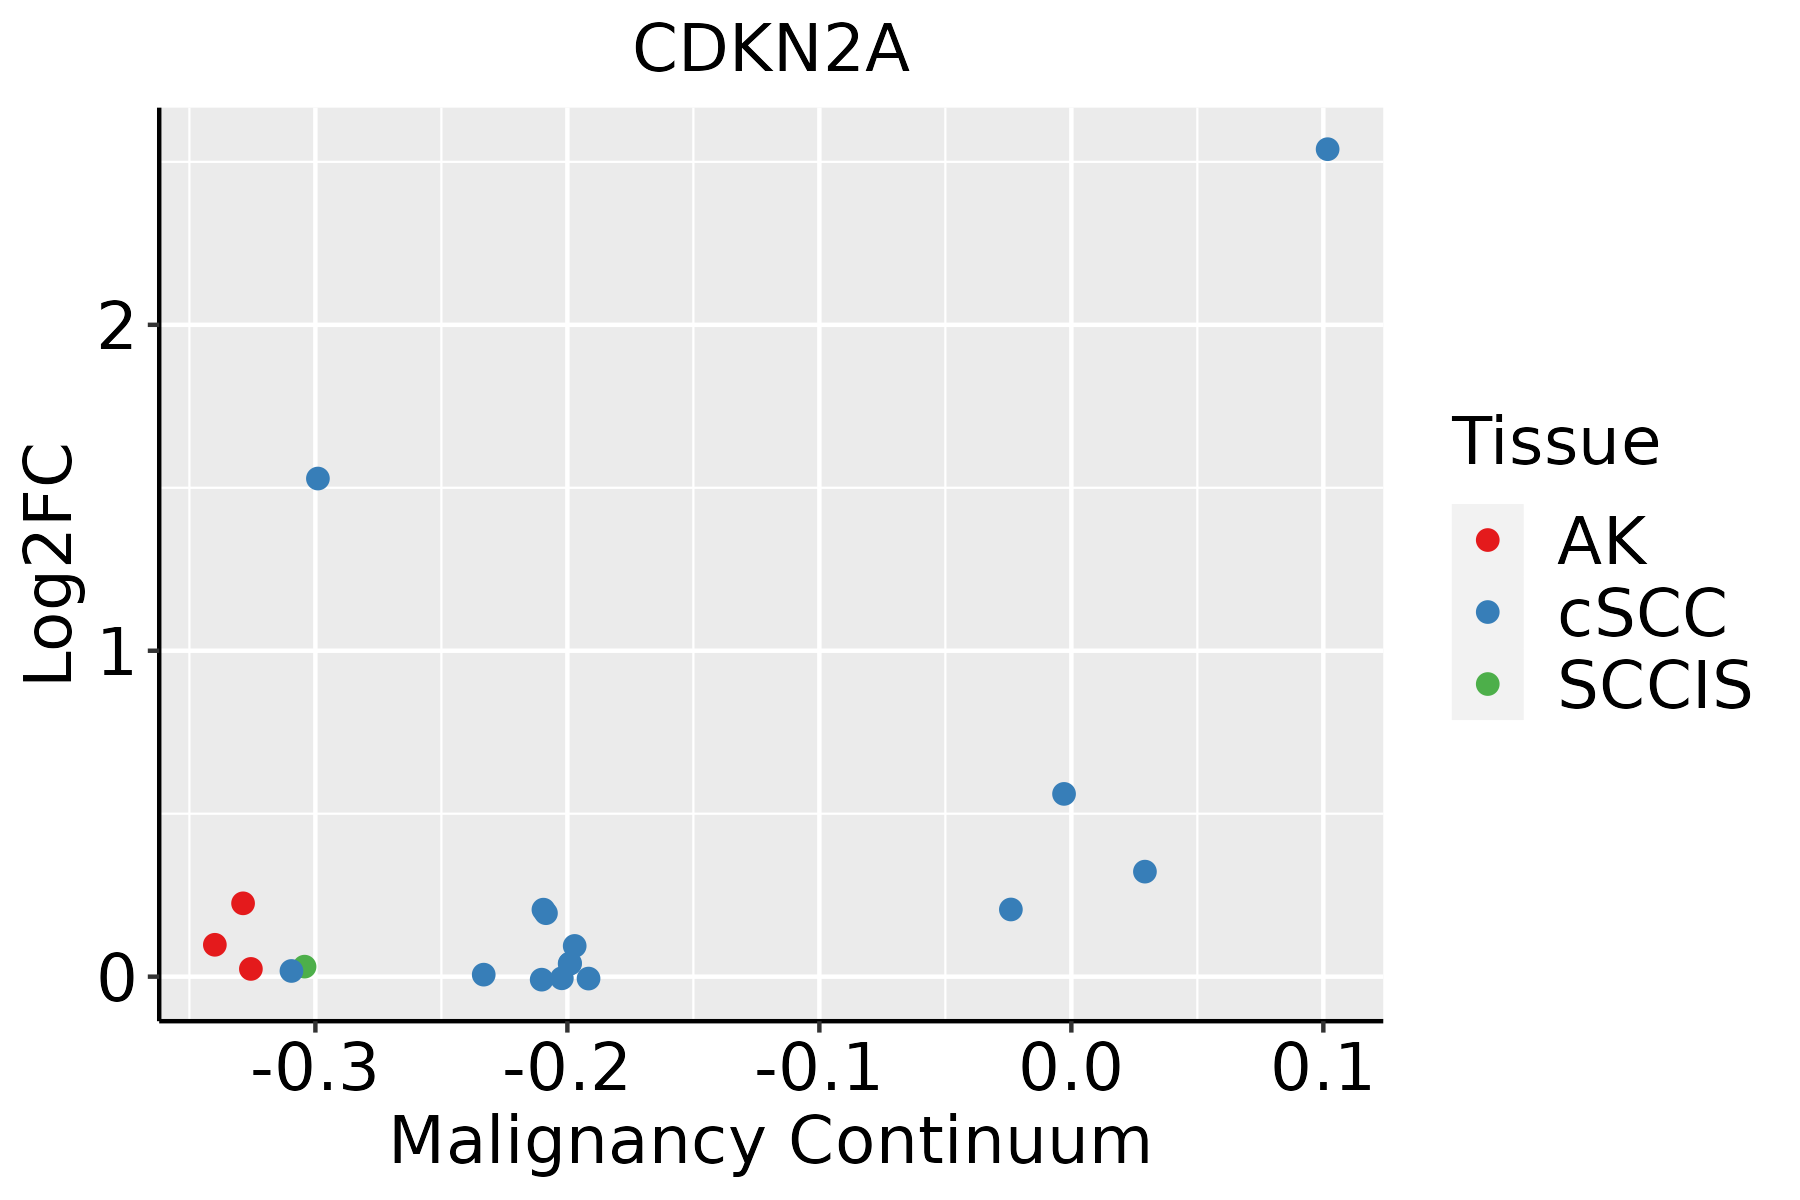 | AK: Actinic keratosis |
| cSCC: Cutaneous squamous cell carcinoma | ||
| SCCIS:squamous cell carcinoma in situ | ||
| Thyroid | 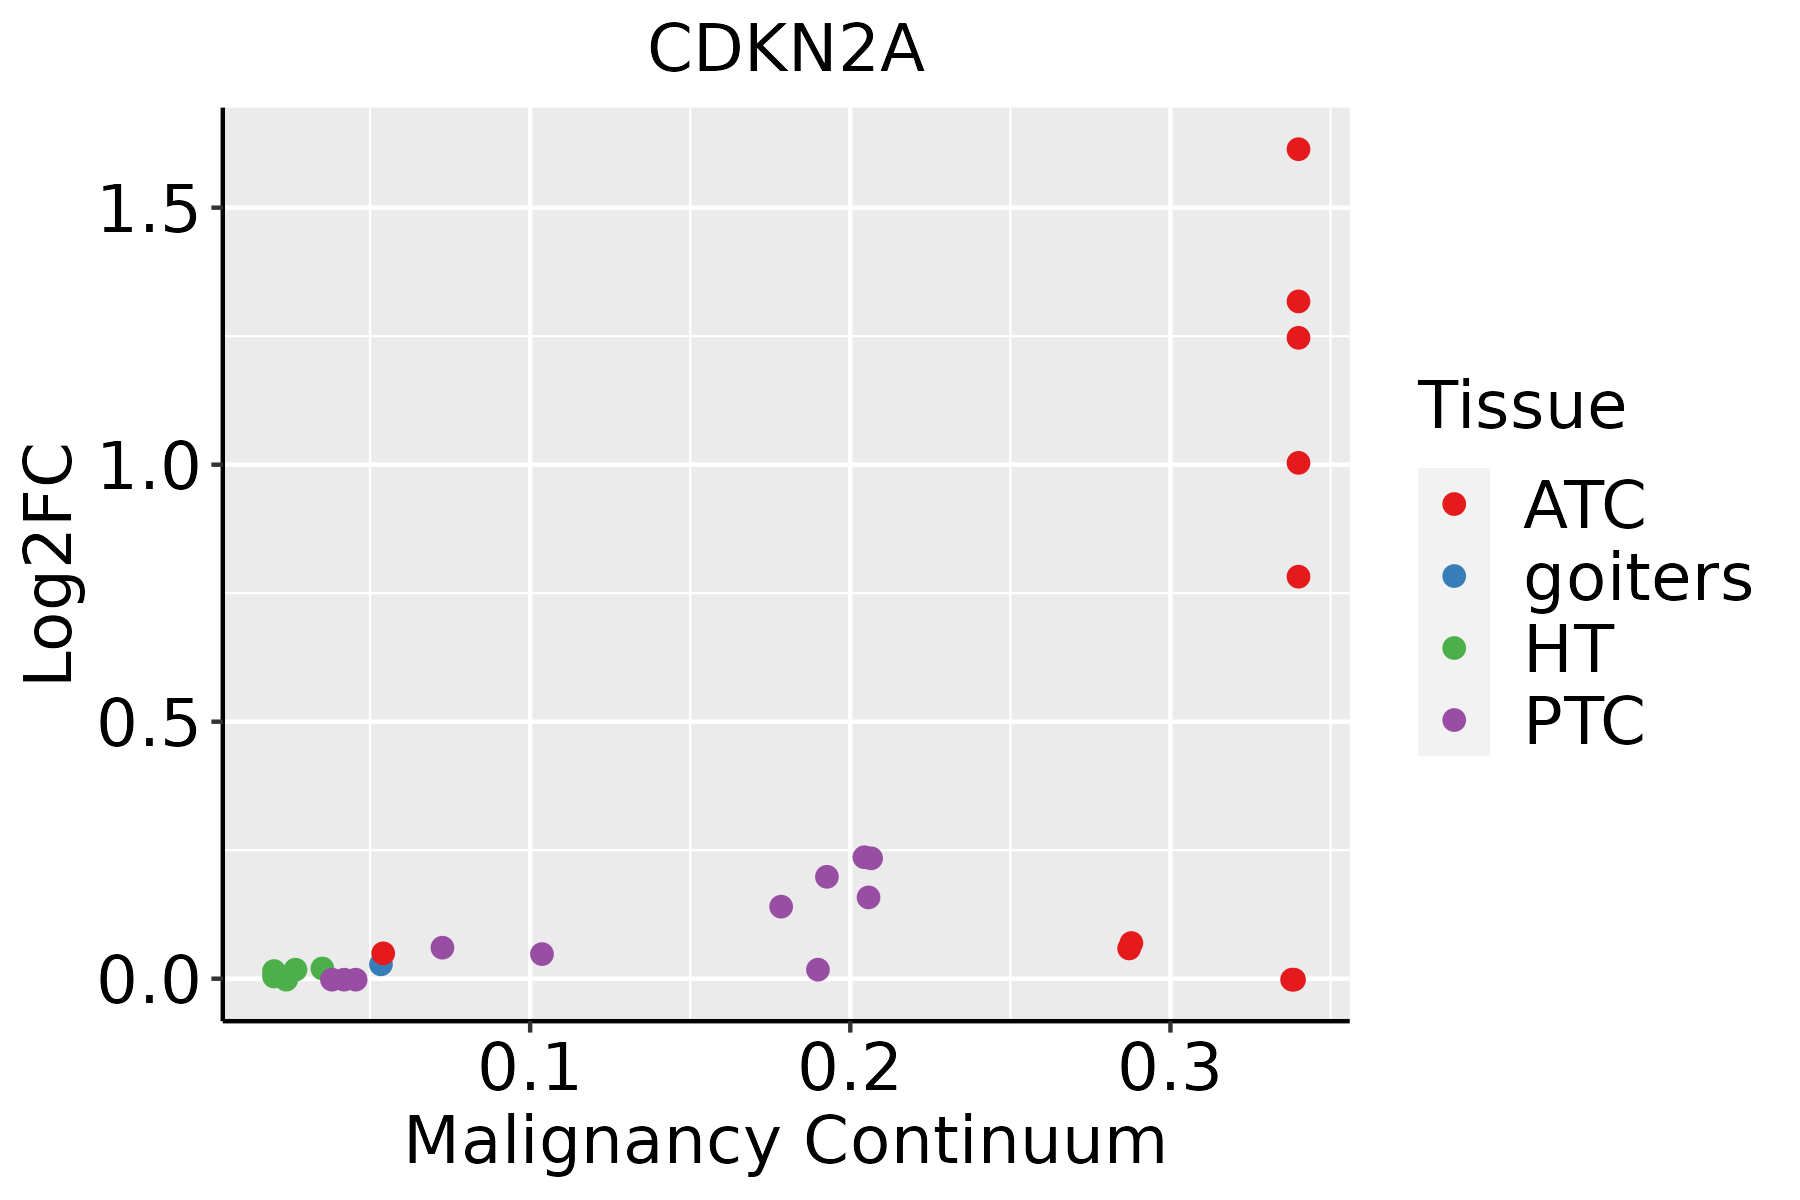 | ATC: Anaplastic thyroid cancer |
| HT: Hashimoto's thyroiditis | ||
| PTC: Papillary thyroid cancer |
| ∗log2FC in expression of this searched gene in stem-like cells from each diseased tissue sample relative to stem-like cells in normal samples in each tissue plotted against the malignancy continuum. Samples are colored based on if they are from different disease stage. |
Top |
Malignant transformation related pathway analysis |
| Find out the enriched GO biological processes and KEGG pathways involved in transition from healthy to precancer to cancer |
| Tissue | Disease Stage | Enriched GO biological Processes |
| Colorectum | AD |  |
| Colorectum | SER |  |
| Colorectum | MSS |  |
| Colorectum | MSI-H |  |
| Colorectum | FAP |  |
| ∗Top 15 enriched GO BP terms are showed in the bar plot of each disease state in each tissue. Each row represents a significant GO biological process which is colored according to the -log10(p.adjust). |
| Page: 1 2 3 4 5 6 7 8 9 |
| GO ID | Tissue | Disease Stage | Description | Gene Ratio | Bg Ratio | pvalue | p.adjust | Count |
| GO:0001558111 | Thyroid | PTC | regulation of cell growth | 188/5968 | 414/18723 | 4.13e-09 | 1.09e-07 | 188 |
| GO:0006469111 | Thyroid | PTC | negative regulation of protein kinase activity | 107/5968 | 212/18723 | 1.24e-08 | 2.96e-07 | 107 |
| GO:0071900110 | Thyroid | PTC | regulation of protein serine/threonine kinase activity | 164/5968 | 359/18723 | 2.41e-08 | 5.43e-07 | 164 |
| GO:0033673111 | Thyroid | PTC | negative regulation of kinase activity | 115/5968 | 237/18723 | 5.98e-08 | 1.26e-06 | 115 |
| GO:0007568111 | Thyroid | PTC | aging | 153/5968 | 339/18723 | 1.80e-07 | 3.34e-06 | 153 |
| GO:000195220 | Thyroid | PTC | regulation of cell-matrix adhesion | 69/5968 | 128/18723 | 1.92e-07 | 3.51e-06 | 69 |
| GO:00000829 | Thyroid | PTC | G1/S transition of mitotic cell cycle | 102/5968 | 214/18723 | 9.48e-07 | 1.43e-05 | 102 |
| GO:000716020 | Thyroid | PTC | cell-matrix adhesion | 109/5968 | 233/18723 | 1.28e-06 | 1.84e-05 | 109 |
| GO:00448439 | Thyroid | PTC | cell cycle G1/S phase transition | 112/5968 | 241/18723 | 1.37e-06 | 1.96e-05 | 112 |
| GO:00457867 | Thyroid | PTC | negative regulation of cell cycle | 166/5968 | 385/18723 | 1.93e-06 | 2.64e-05 | 166 |
| GO:000756917 | Thyroid | PTC | cell aging | 68/5968 | 132/18723 | 2.09e-06 | 2.84e-05 | 68 |
| GO:005109016 | Thyroid | PTC | regulation of DNA-binding transcription factor activity | 178/5968 | 440/18723 | 7.63e-05 | 6.54e-04 | 178 |
| GO:00903986 | Thyroid | PTC | cellular senescence | 47/5968 | 93/18723 | 1.37e-04 | 1.07e-03 | 47 |
| GO:190402912 | Thyroid | PTC | regulation of cyclin-dependent protein kinase activity | 49/5968 | 98/18723 | 1.40e-04 | 1.09e-03 | 49 |
| GO:000007912 | Thyroid | PTC | regulation of cyclin-dependent protein serine/threonine kinase activity | 47/5968 | 94/18723 | 1.90e-04 | 1.42e-03 | 47 |
| GO:004592614 | Thyroid | PTC | negative regulation of growth | 105/5968 | 249/18723 | 3.76e-04 | 2.54e-03 | 105 |
| GO:007190112 | Thyroid | PTC | negative regulation of protein serine/threonine kinase activity | 55/5968 | 120/18723 | 9.30e-04 | 5.65e-03 | 55 |
| GO:00303087 | Thyroid | PTC | negative regulation of cell growth | 80/5968 | 188/18723 | 1.28e-03 | 7.31e-03 | 80 |
| GO:00718872 | Thyroid | PTC | leukocyte apoptotic process | 48/5968 | 106/18723 | 2.58e-03 | 1.32e-02 | 48 |
| GO:000716219 | Thyroid | PTC | negative regulation of cell adhesion | 117/5968 | 303/18723 | 7.28e-03 | 3.12e-02 | 117 |
| Page: 1 2 3 4 5 6 7 8 9 10 11 12 13 14 15 16 17 18 19 20 21 22 23 24 25 26 |
| Pathway ID | Tissue | Disease Stage | Description | Gene Ratio | Bg Ratio | pvalue | p.adjust | qvalue | Count |
| hsa042189 | Breast | Precancer | Cellular senescence | 29/684 | 156/8465 | 1.66e-05 | 1.69e-04 | 1.30e-04 | 29 |
| hsa0516618 | Breast | Precancer | Human T-cell leukemia virus 1 infection | 33/684 | 222/8465 | 4.29e-04 | 3.31e-03 | 2.53e-03 | 33 |
| hsa0516316 | Breast | Precancer | Human cytomegalovirus infection | 32/684 | 225/8465 | 1.13e-03 | 7.57e-03 | 5.80e-03 | 32 |
| hsa052196 | Breast | Precancer | Bladder cancer | 9/684 | 41/8465 | 4.65e-03 | 2.72e-02 | 2.08e-02 | 9 |
| hsa052036 | Breast | Precancer | Viral carcinogenesis | 27/684 | 204/8465 | 7.19e-03 | 4.06e-02 | 3.11e-02 | 27 |
| hsa0421814 | Breast | Precancer | Cellular senescence | 29/684 | 156/8465 | 1.66e-05 | 1.69e-04 | 1.30e-04 | 29 |
| hsa0516619 | Breast | Precancer | Human T-cell leukemia virus 1 infection | 33/684 | 222/8465 | 4.29e-04 | 3.31e-03 | 2.53e-03 | 33 |
| hsa0516317 | Breast | Precancer | Human cytomegalovirus infection | 32/684 | 225/8465 | 1.13e-03 | 7.57e-03 | 5.80e-03 | 32 |
| hsa0521913 | Breast | Precancer | Bladder cancer | 9/684 | 41/8465 | 4.65e-03 | 2.72e-02 | 2.08e-02 | 9 |
| hsa0520312 | Breast | Precancer | Viral carcinogenesis | 27/684 | 204/8465 | 7.19e-03 | 4.06e-02 | 3.11e-02 | 27 |
| hsa0421824 | Breast | IDC | Cellular senescence | 35/867 | 156/8465 | 5.49e-06 | 7.43e-05 | 5.56e-05 | 35 |
| hsa0516624 | Breast | IDC | Human T-cell leukemia virus 1 infection | 40/867 | 222/8465 | 2.52e-04 | 2.21e-03 | 1.66e-03 | 40 |
| hsa0516324 | Breast | IDC | Human cytomegalovirus infection | 39/867 | 225/8465 | 6.66e-04 | 5.41e-03 | 4.05e-03 | 39 |
| hsa0520322 | Breast | IDC | Viral carcinogenesis | 34/867 | 204/8465 | 2.82e-03 | 1.86e-02 | 1.39e-02 | 34 |
| hsa041157 | Breast | IDC | p53 signaling pathway | 16/867 | 74/8465 | 2.86e-03 | 1.86e-02 | 1.39e-02 | 16 |
| hsa052147 | Breast | IDC | Glioma | 16/867 | 75/8465 | 3.30e-03 | 2.10e-02 | 1.57e-02 | 16 |
| hsa0521921 | Breast | IDC | Bladder cancer | 10/867 | 41/8465 | 7.07e-03 | 3.54e-02 | 2.65e-02 | 10 |
| hsa0522010 | Breast | IDC | Chronic myeloid leukemia | 15/867 | 76/8465 | 9.24e-03 | 4.37e-02 | 3.27e-02 | 15 |
| hsa0421834 | Breast | IDC | Cellular senescence | 35/867 | 156/8465 | 5.49e-06 | 7.43e-05 | 5.56e-05 | 35 |
| hsa0516634 | Breast | IDC | Human T-cell leukemia virus 1 infection | 40/867 | 222/8465 | 2.52e-04 | 2.21e-03 | 1.66e-03 | 40 |
| Page: 1 2 3 4 5 6 7 8 9 10 11 12 13 14 15 |
Top |
Cell-cell communication analysis |
| Identification of potential cell-cell interactions between two cell types and their ligand-receptor pairs for different disease states |
| Ligand | Receptor | LRpair | Pathway | Tissue | Disease Stage |
| Page: 1 |
Top |
Single-cell gene regulatory network inference analysis |
| Find out the significant the regulons (TFs) and the target genes of each regulon across cell types for different disease states |
| TF | Cell Type | Tissue | Disease Stage | Target Gene | RSS | Regulon Activity |
| ∗The dot plots of a searched regulon are shown for all cell subpopulations in each disease state of each tissue based on the regulon specific score inferred using pySCENIC and by calculating the average expression. |
| Page: 1 |
Top |
Somatic mutation of malignant transformation related genes |
| Annotation of somatic variants for genes involved in malignant transformation |
| Hugo Symbol | Variant Class | Variant Classification | dbSNP RS | HGVSc | HGVSp | HGVSp Short | SWISSPROT | BIOTYPE | SIFT | PolyPhen | Tumor Sample Barcode | Tissue | Histology | Sex | Age | Stage | Therapy Types | Drugs | Outcome |
| CDKN2A | deletion | Frame_Shift_Del | novel | c.235_236delAC | p.Thr79ProfsTer40 | p.T79Pfs*40 | P42771 | protein_coding | TCGA-LQ-A4E4-01 | Breast | breast invasive carcinoma | Female | >=65 | III/IV | Hormone Therapy | anastrozole | PD | ||
| CDKN2A | SNV | Missense_Mutation | c.395N>T | p.Ala132Val | p.A132V | P42771 | protein_coding | tolerated(0.07) | benign(0.012) | TCGA-2W-A8YY-01 | Cervix | cervical & endocervical cancer | Female | <65 | I/II | Chemotherapy | cisplatin | CR | |
| CDKN2A | SNV | Missense_Mutation | c.437N>G | p.Asp146Gly | p.D146G | P42771 | protein_coding | tolerated_low_confidence(0.08) | benign(0.001) | TCGA-C5-A2LT-01 | Cervix | cervical & endocervical cancer | Female | <65 | I/II | Chemotherapy | cisplatin | SD | |
| CDKN2A | SNV | Missense_Mutation | novel | c.23N>T | p.Ser8Ile | p.S8I | P42771 | protein_coding | deleterious_low_confidence(0.03) | possibly_damaging(0.73) | TCGA-C5-A905-01 | Cervix | cervical & endocervical cancer | Female | <65 | I/II | Unknown | Unknown | SD |
| CDKN2A | SNV | Missense_Mutation | c.22N>C | p.Ser8Arg | p.S8R | P42771 | protein_coding | tolerated_low_confidence(0.18) | possibly_damaging(0.64) | TCGA-C5-A905-01 | Cervix | cervical & endocervical cancer | Female | <65 | I/II | Unknown | Unknown | SD | |
| CDKN2A | SNV | Missense_Mutation | c.262N>A | p.Glu88Lys | p.E88K | P42771 | protein_coding | deleterious(0.04) | possibly_damaging(0.485) | TCGA-EK-A2PM-01 | Cervix | cervical & endocervical cancer | Female | >=65 | I/II | Unknown | Unknown | SD | |
| CDKN2A | SNV | Missense_Mutation | c.383N>A | p.Arg128Gln | p.R128Q | P42771 | protein_coding | tolerated(0.36) | benign(0.001) | TCGA-AD-6901-01 | Colorectum | colon adenocarcinoma | Male | >=65 | I/II | Chemotherapy | xeloda | PD | |
| CDKN2A | SNV | Missense_Mutation | rs755927351 | c.391N>T | p.Arg131Cys | p.R131C | P42771 | protein_coding | deleterious(0) | probably_damaging(0.978) | TCGA-AP-A0LM-01 | Endometrium | uterine corpus endometrioid carcinoma | Female | <65 | III/IV | Chemotherapy | cisplatin | SD |
| CDKN2A | SNV | Missense_Mutation | rs876659307 | c.443N>T | p.Ala148Val | p.A148V | P42771 | protein_coding | tolerated_low_confidence(0.1) | benign(0) | TCGA-AX-A2HC-01 | Endometrium | uterine corpus endometrioid carcinoma | Female | <65 | III/IV | Chemotherapy | paclitaxel | PD |
| CDKN2A | SNV | Missense_Mutation | c.500C>T | p.Ala167Val | p.A167V | P42771 | protein_coding | unknown(0) | TCGA-B5-A3FC-01 | Endometrium | uterine corpus endometrioid carcinoma | Female | <65 | I/II | Unknown | Unknown | SD |
| Page: 1 2 3 4 5 6 7 8 9 10 11 12 13 14 15 |
Top |
Related drugs of malignant transformation related genes |
| Identification of chemicals and drugs interact with genes involved in malignant transfromation |
| (DGIdb 4.0) |
| Entrez ID | Symbol | Category | Interaction Types | Drug Claim Name | Drug Name | PMIDs |
| 1029 | CDKN2A | CLINICALLY ACTIONABLE, DRUG RESISTANCE, KINASE, TUMOR SUPPRESSOR | ON-01910 | RIGOSERTIB | 25156567 | |
| 1029 | CDKN2A | CLINICALLY ACTIONABLE, DRUG RESISTANCE, KINASE, TUMOR SUPPRESSOR | LY2835219 | ABEMACICLIB | ||
| 1029 | CDKN2A | CLINICALLY ACTIONABLE, DRUG RESISTANCE, KINASE, TUMOR SUPPRESSOR | Alvocidib | ALVOCIDIB | 12777976 | |
| 1029 | CDKN2A | CLINICALLY ACTIONABLE, DRUG RESISTANCE, KINASE, TUMOR SUPPRESSOR | Palbociclib | PALBOCICLIB | ||
| 1029 | CDKN2A | CLINICALLY ACTIONABLE, DRUG RESISTANCE, KINASE, TUMOR SUPPRESSOR | BAY1000394 | |||
| 1029 | CDKN2A | CLINICALLY ACTIONABLE, DRUG RESISTANCE, KINASE, TUMOR SUPPRESSOR | LETROZOLE | LETROZOLE | 26715889 | |
| 1029 | CDKN2A | CLINICALLY ACTIONABLE, DRUG RESISTANCE, KINASE, TUMOR SUPPRESSOR | VEMURAFENIB | VEMURAFENIB | 24265155 | |
| 1029 | CDKN2A | CLINICALLY ACTIONABLE, DRUG RESISTANCE, KINASE, TUMOR SUPPRESSOR | PD 0332991 | |||
| 1029 | CDKN2A | CLINICALLY ACTIONABLE, DRUG RESISTANCE, KINASE, TUMOR SUPPRESSOR | ZK304709 | 18829975 | ||
| 1029 | CDKN2A | CLINICALLY ACTIONABLE, DRUG RESISTANCE, KINASE, TUMOR SUPPRESSOR | Sapanisertib | SAPANISERTIB | 25261369 |
| Page: 1 2 3 4 |

Copyright 2023-Present -The University of Texas Health Science Center at Houston |