
|
|||||
|
 | |
| |
| |
| |
| |
| |
|
Gene: CDK1 |
Gene summary for CDK1 |
| Gene information | Species | Human | Gene symbol | CDK1 | Gene ID | 983 |
| Gene name | cyclin dependent kinase 1 | |
| Gene Alias | CDC2 | |
| Cytomap | 10q21.2 | |
| Gene Type | protein-coding | GO ID | GO:0000003 | UniProtAcc | B7Z3D6 |
Top |
Malignant transformation analysis |
| Identification of the aberrant gene expression in precancerous and cancerous lesions by comparing the gene expression of stem-like cells in diseased tissues with normal stem cells |
| Entrez ID | Symbol | Replicates | Species | Organ | Tissue | Adj P-value | Log2FC | Malignancy |
| 983 | CDK1 | GSM4909281 | Human | Breast | IDC | 3.56e-02 | 1.62e-01 | 0.21 |
| 983 | CDK1 | GSM4909282 | Human | Breast | IDC | 3.04e-31 | 6.70e-01 | -0.0288 |
| 983 | CDK1 | GSM4909285 | Human | Breast | IDC | 8.66e-08 | 3.07e-01 | 0.21 |
| 983 | CDK1 | GSM4909287 | Human | Breast | IDC | 4.23e-02 | 2.18e-01 | 0.2057 |
| 983 | CDK1 | GSM4909304 | Human | Breast | IDC | 1.03e-03 | 1.67e-01 | 0.1636 |
| 983 | CDK1 | GSM4909318 | Human | Breast | IDC | 6.98e-03 | 5.48e-01 | 0.2031 |
| 983 | CDK1 | M2 | Human | Breast | IDC | 7.99e-07 | 6.71e-01 | 0.21 |
| 983 | CDK1 | NCCBC5 | Human | Breast | DCIS | 1.50e-03 | 3.56e-01 | 0.2046 |
| 983 | CDK1 | LZE4T | Human | Esophagus | ESCC | 6.35e-03 | 1.72e-01 | 0.0811 |
| 983 | CDK1 | LZE22T | Human | Esophagus | ESCC | 1.57e-02 | 2.98e-01 | 0.068 |
| 983 | CDK1 | LZE6T | Human | Esophagus | ESCC | 2.61e-09 | 5.56e-01 | 0.0845 |
| 983 | CDK1 | P2T-E | Human | Esophagus | ESCC | 5.80e-08 | 6.79e-01 | 0.1177 |
| 983 | CDK1 | P4T-E | Human | Esophagus | ESCC | 3.78e-04 | 2.37e-01 | 0.1323 |
| 983 | CDK1 | P5T-E | Human | Esophagus | ESCC | 1.75e-25 | 9.12e-01 | 0.1327 |
| 983 | CDK1 | P8T-E | Human | Esophagus | ESCC | 4.44e-08 | 3.14e-01 | 0.0889 |
| 983 | CDK1 | P9T-E | Human | Esophagus | ESCC | 2.30e-02 | 1.11e-01 | 0.1131 |
| 983 | CDK1 | P10T-E | Human | Esophagus | ESCC | 6.56e-15 | 4.29e-01 | 0.116 |
| 983 | CDK1 | P12T-E | Human | Esophagus | ESCC | 3.97e-04 | 1.06e-01 | 0.1122 |
| 983 | CDK1 | P15T-E | Human | Esophagus | ESCC | 2.11e-03 | 1.87e-01 | 0.1149 |
| 983 | CDK1 | P16T-E | Human | Esophagus | ESCC | 2.05e-07 | 2.75e-01 | 0.1153 |
| Page: 1 2 3 4 |
| Tissue | Expression Dynamics | Abbreviation |
| Breast | 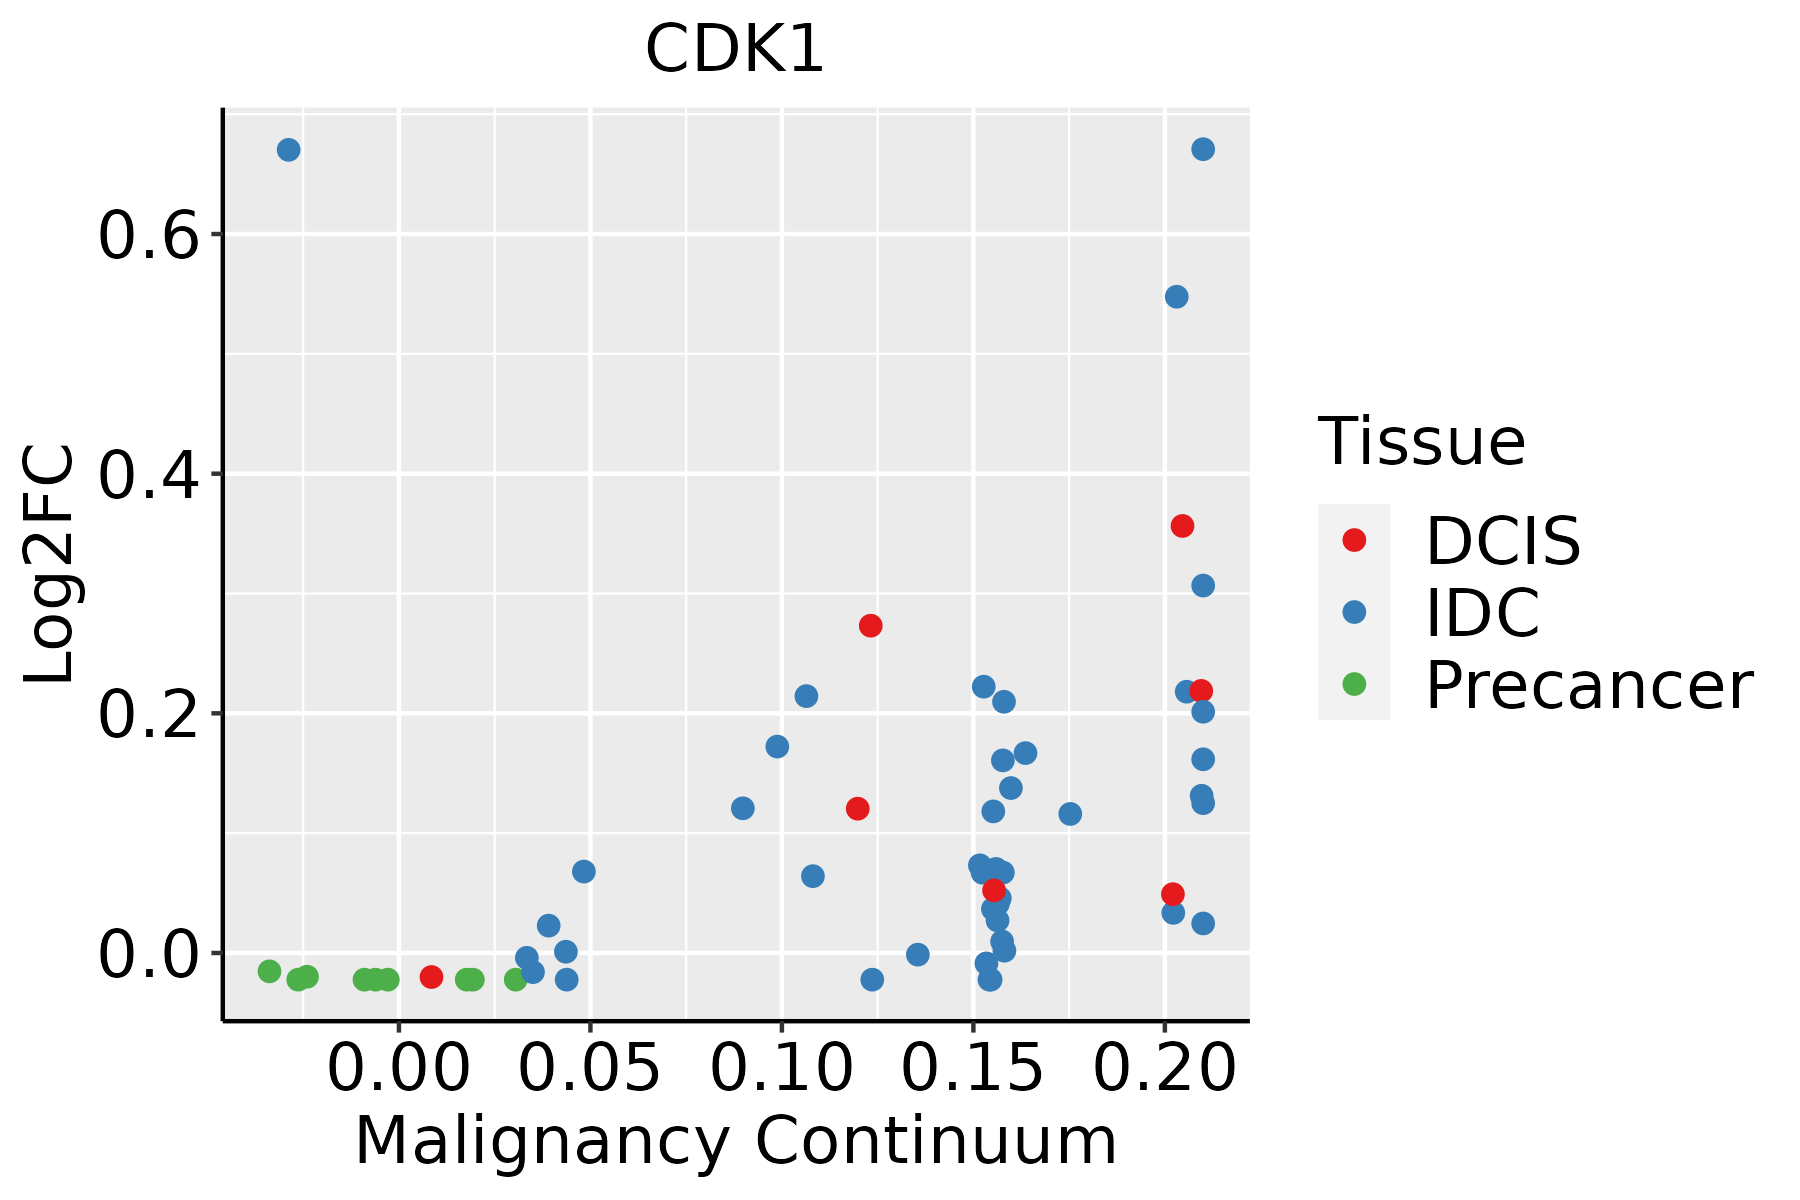 | IDC: Invasive ductal carcinoma |
| DCIS: Ductal carcinoma in situ | ||
| Precancer(BRCA1-mut): Precancerous lesion from BRCA1 mutation carriers | ||
| Esophagus |  | ESCC: Esophageal squamous cell carcinoma |
| HGIN: High-grade intraepithelial neoplasias | ||
| LGIN: Low-grade intraepithelial neoplasias | ||
| Liver | 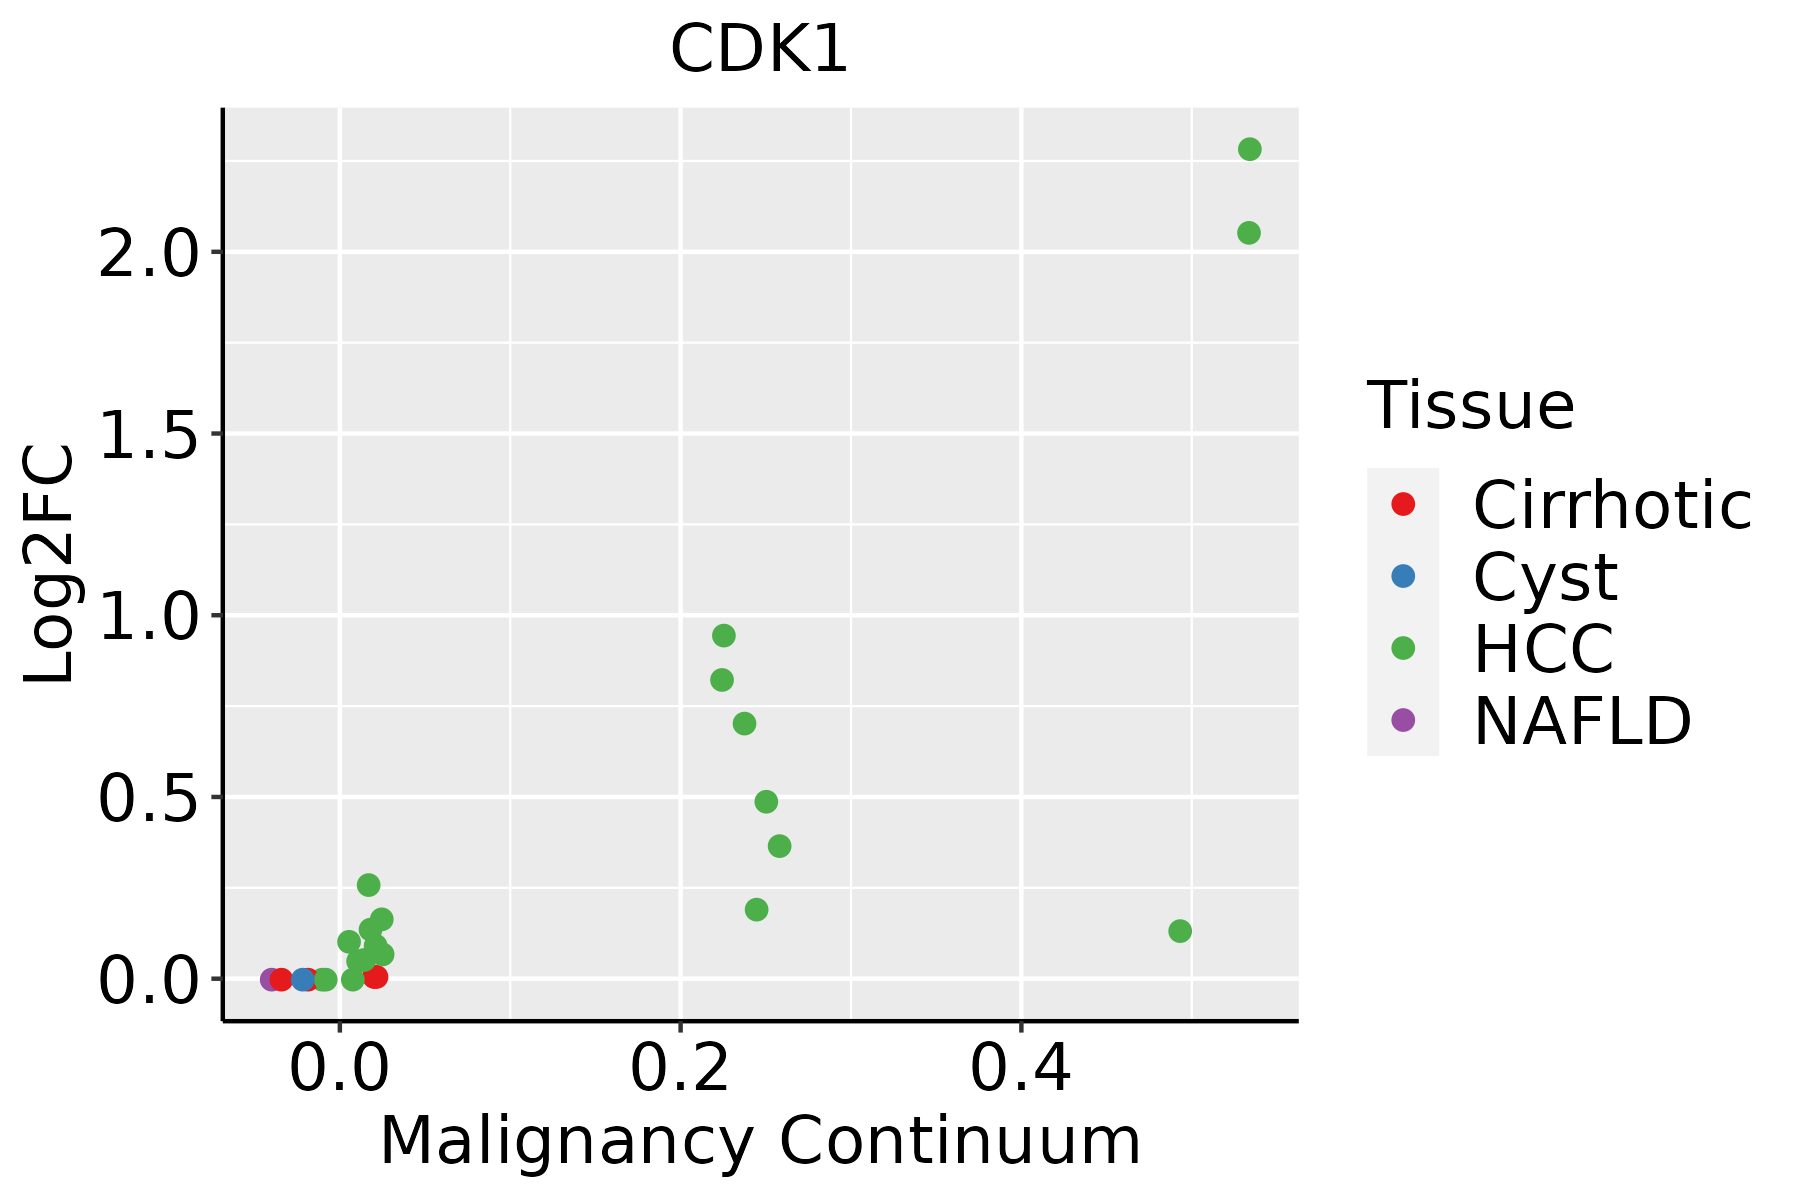 | HCC: Hepatocellular carcinoma |
| NAFLD: Non-alcoholic fatty liver disease | ||
| Oral Cavity |  | EOLP: Erosive Oral lichen planus |
| LP: leukoplakia | ||
| NEOLP: Non-erosive oral lichen planus | ||
| OSCC: Oral squamous cell carcinoma | ||
| Skin | 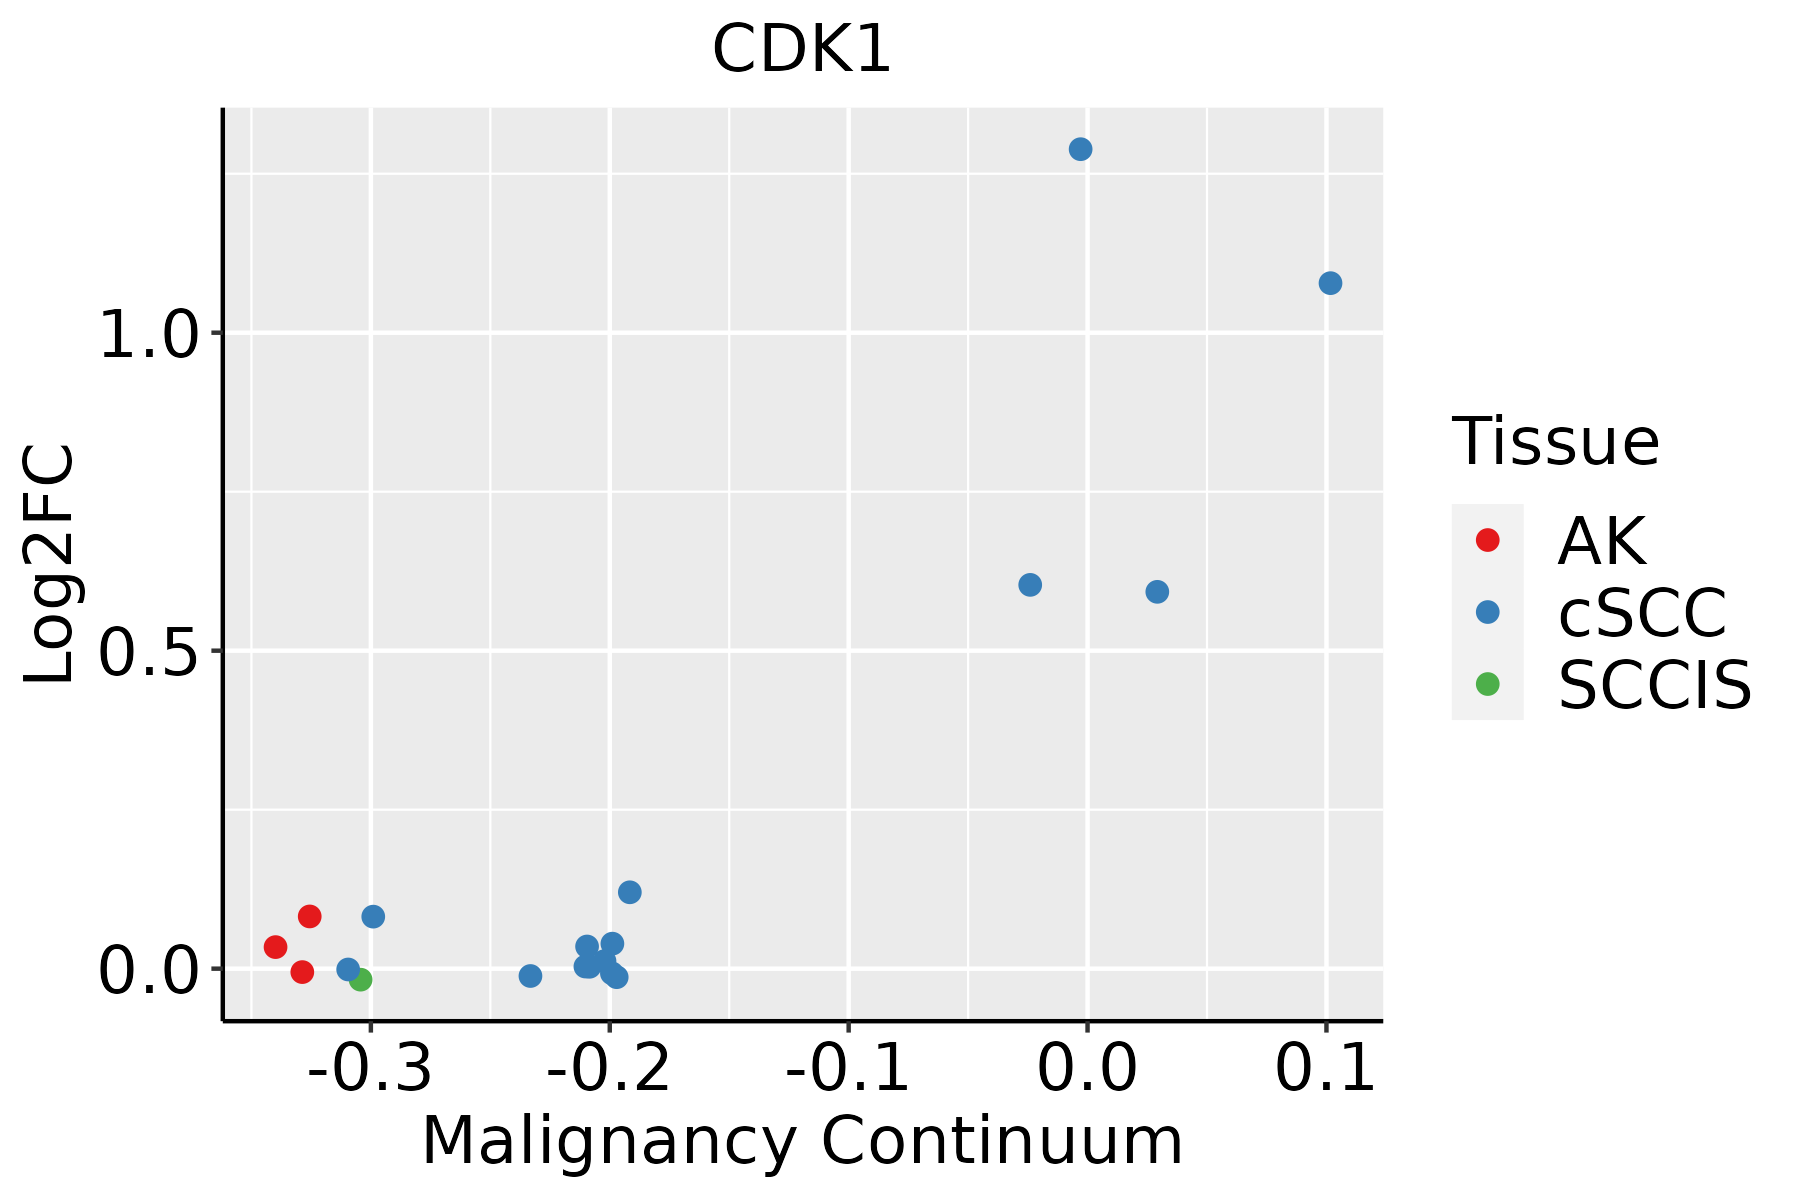 | AK: Actinic keratosis |
| cSCC: Cutaneous squamous cell carcinoma | ||
| SCCIS:squamous cell carcinoma in situ |
| ∗log2FC in expression of this searched gene in stem-like cells from each diseased tissue sample relative to stem-like cells in normal samples in each tissue plotted against the malignancy continuum. Samples are colored based on if they are from different disease stage. |
Top |
Malignant transformation related pathway analysis |
| Find out the enriched GO biological processes and KEGG pathways involved in transition from healthy to precancer to cancer |
| Tissue | Disease Stage | Enriched GO biological Processes |
| Colorectum | AD |  |
| Colorectum | SER |  |
| Colorectum | MSS |  |
| Colorectum | MSI-H |  |
| Colorectum | FAP |  |
| ∗Top 15 enriched GO BP terms are showed in the bar plot of each disease state in each tissue. Each row represents a significant GO biological process which is colored according to the -log10(p.adjust). |
| Page: 1 2 3 4 5 6 7 8 9 |
| GO ID | Tissue | Disease Stage | Description | Gene Ratio | Bg Ratio | pvalue | p.adjust | Count |
| GO:19027491 | Esophagus | ESCC | regulation of cell cycle G2/M phase transition | 68/8552 | 102/18723 | 1.48e-05 | 1.33e-04 | 68 |
| GO:19019925 | Esophagus | ESCC | positive regulation of mitotic cell cycle phase transition | 62/8552 | 93/18723 | 3.47e-05 | 2.83e-04 | 62 |
| GO:00420636 | Esophagus | ESCC | gliogenesis | 172/8552 | 301/18723 | 3.75e-05 | 3.04e-04 | 172 |
| GO:000941020 | Esophagus | ESCC | response to xenobiotic stimulus | 253/8552 | 462/18723 | 4.55e-05 | 3.58e-04 | 253 |
| GO:001003827 | Esophagus | ESCC | response to metal ion | 208/8552 | 373/18723 | 5.02e-05 | 3.90e-04 | 208 |
| GO:00488638 | Esophagus | ESCC | stem cell differentiation | 122/8552 | 206/18723 | 5.95e-05 | 4.59e-04 | 122 |
| GO:004671827 | Esophagus | ESCC | viral entry into host cell | 89/8552 | 144/18723 | 6.84e-05 | 5.18e-04 | 89 |
| GO:004668619 | Esophagus | ESCC | response to cadmium ion | 47/8552 | 68/18723 | 7.81e-05 | 5.80e-04 | 47 |
| GO:00708161 | Esophagus | ESCC | phosphorylation of RNA polymerase II C-terminal domain | 12/8552 | 12/18723 | 8.21e-05 | 6.01e-04 | 12 |
| GO:004346719 | Esophagus | ESCC | regulation of generation of precursor metabolites and energy | 81/8552 | 130/18723 | 9.58e-05 | 6.81e-04 | 81 |
| GO:000963620 | Esophagus | ESCC | response to toxic substance | 150/8552 | 262/18723 | 1.00e-04 | 7.12e-04 | 150 |
| GO:004477312 | Esophagus | ESCC | mitotic DNA damage checkpoint | 54/8552 | 81/18723 | 1.09e-04 | 7.64e-04 | 54 |
| GO:007064612 | Esophagus | ESCC | protein modification by small protein removal | 95/8552 | 157/18723 | 1.25e-04 | 8.56e-04 | 95 |
| GO:00447745 | Esophagus | ESCC | mitotic DNA integrity checkpoint | 56/8552 | 85/18723 | 1.34e-04 | 9.09e-04 | 56 |
| GO:00483083 | Esophagus | ESCC | organelle inheritance | 14/8552 | 15/18723 | 1.47e-04 | 9.85e-04 | 14 |
| GO:00483133 | Esophagus | ESCC | Golgi inheritance | 14/8552 | 15/18723 | 1.47e-04 | 9.85e-04 | 14 |
| GO:00075699 | Esophagus | ESCC | cell aging | 81/8552 | 132/18723 | 2.00e-04 | 1.27e-03 | 81 |
| GO:006049118 | Esophagus | ESCC | regulation of cell projection assembly | 110/8552 | 188/18723 | 2.60e-04 | 1.58e-03 | 110 |
| GO:00100016 | Esophagus | ESCC | glial cell differentiation | 129/8552 | 225/18723 | 2.73e-04 | 1.65e-03 | 129 |
| GO:00311009 | Esophagus | ESCC | animal organ regeneration | 50/8552 | 76/18723 | 3.17e-04 | 1.88e-03 | 50 |
| Page: 1 2 3 4 5 6 7 8 9 10 11 12 13 14 15 16 17 18 19 20 21 22 23 24 25 26 27 28 29 30 31 32 33 34 35 36 37 38 39 40 41 42 43 44 45 46 47 48 49 50 51 52 53 54 55 56 57 58 59 60 61 62 63 64 65 66 67 68 69 |
| Pathway ID | Tissue | Disease Stage | Description | Gene Ratio | Bg Ratio | pvalue | p.adjust | qvalue | Count |
| hsa0421824 | Breast | IDC | Cellular senescence | 35/867 | 156/8465 | 5.49e-06 | 7.43e-05 | 5.56e-05 | 35 |
| hsa041157 | Breast | IDC | p53 signaling pathway | 16/867 | 74/8465 | 2.86e-03 | 1.86e-02 | 1.39e-02 | 16 |
| hsa0517014 | Breast | IDC | Human immunodeficiency virus 1 infection | 33/867 | 212/8465 | 9.28e-03 | 4.37e-02 | 3.27e-02 | 33 |
| hsa0421834 | Breast | IDC | Cellular senescence | 35/867 | 156/8465 | 5.49e-06 | 7.43e-05 | 5.56e-05 | 35 |
| hsa0411512 | Breast | IDC | p53 signaling pathway | 16/867 | 74/8465 | 2.86e-03 | 1.86e-02 | 1.39e-02 | 16 |
| hsa0517015 | Breast | IDC | Human immunodeficiency virus 1 infection | 33/867 | 212/8465 | 9.28e-03 | 4.37e-02 | 3.27e-02 | 33 |
| hsa0421844 | Breast | DCIS | Cellular senescence | 34/846 | 156/8465 | 8.53e-06 | 1.06e-04 | 7.80e-05 | 34 |
| hsa0520341 | Breast | DCIS | Viral carcinogenesis | 34/846 | 204/8465 | 1.88e-03 | 1.27e-02 | 9.33e-03 | 34 |
| hsa0517024 | Breast | DCIS | Human immunodeficiency virus 1 infection | 33/846 | 212/8465 | 6.49e-03 | 3.22e-02 | 2.37e-02 | 33 |
| hsa0421854 | Breast | DCIS | Cellular senescence | 34/846 | 156/8465 | 8.53e-06 | 1.06e-04 | 7.80e-05 | 34 |
| hsa052035 | Breast | DCIS | Viral carcinogenesis | 34/846 | 204/8465 | 1.88e-03 | 1.27e-02 | 9.33e-03 | 34 |
| hsa0517034 | Breast | DCIS | Human immunodeficiency virus 1 infection | 33/846 | 212/8465 | 6.49e-03 | 3.22e-02 | 2.37e-02 | 33 |
| hsa0411023 | Esophagus | ESCC | Cell cycle | 126/4205 | 157/8465 | 1.34e-15 | 5.60e-14 | 2.87e-14 | 126 |
| hsa0411524 | Esophagus | ESCC | p53 signaling pathway | 65/4205 | 74/8465 | 3.88e-12 | 6.50e-11 | 3.33e-11 | 65 |
| hsa0421829 | Esophagus | ESCC | Cellular senescence | 119/4205 | 156/8465 | 5.89e-12 | 9.40e-11 | 4.81e-11 | 119 |
| hsa05170210 | Esophagus | ESCC | Human immunodeficiency virus 1 infection | 147/4205 | 212/8465 | 3.37e-09 | 3.53e-08 | 1.81e-08 | 147 |
| hsa0520325 | Esophagus | ESCC | Viral carcinogenesis | 137/4205 | 204/8465 | 2.47e-07 | 1.88e-06 | 9.62e-07 | 137 |
| hsa041146 | Esophagus | ESCC | Oocyte meiosis | 77/4205 | 131/8465 | 2.19e-02 | 4.80e-02 | 2.46e-02 | 77 |
| hsa0411033 | Esophagus | ESCC | Cell cycle | 126/4205 | 157/8465 | 1.34e-15 | 5.60e-14 | 2.87e-14 | 126 |
| hsa0411534 | Esophagus | ESCC | p53 signaling pathway | 65/4205 | 74/8465 | 3.88e-12 | 6.50e-11 | 3.33e-11 | 65 |
| Page: 1 2 3 |
Top |
Cell-cell communication analysis |
| Identification of potential cell-cell interactions between two cell types and their ligand-receptor pairs for different disease states |
| Ligand | Receptor | LRpair | Pathway | Tissue | Disease Stage |
| Page: 1 |
Top |
Single-cell gene regulatory network inference analysis |
| Find out the significant the regulons (TFs) and the target genes of each regulon across cell types for different disease states |
| TF | Cell Type | Tissue | Disease Stage | Target Gene | RSS | Regulon Activity |
| ∗The dot plots of a searched regulon are shown for all cell subpopulations in each disease state of each tissue based on the regulon specific score inferred using pySCENIC and by calculating the average expression. |
| Page: 1 |
Top |
Somatic mutation of malignant transformation related genes |
| Annotation of somatic variants for genes involved in malignant transformation |
| Hugo Symbol | Variant Class | Variant Classification | dbSNP RS | HGVSc | HGVSp | HGVSp Short | SWISSPROT | BIOTYPE | SIFT | PolyPhen | Tumor Sample Barcode | Tissue | Histology | Sex | Age | Stage | Therapy Types | Drugs | Outcome |
| CDK1 | SNV | Missense_Mutation | novel | c.376N>A | p.His126Asn | p.H126N | P06493 | protein_coding | deleterious(0) | probably_damaging(0.997) | TCGA-AC-A8OP-01 | Breast | breast invasive carcinoma | Female | >=65 | I/II | Unknown | Unknown | SD |
| CDK1 | SNV | Missense_Mutation | rs764750612 | c.675T>G | p.Asn225Lys | p.N225K | P06493 | protein_coding | deleterious(0.03) | benign(0.023) | TCGA-D8-A143-01 | Breast | breast invasive carcinoma | Female | <65 | I/II | Chemotherapy | doxorubicin | SD |
| CDK1 | SNV | Missense_Mutation | c.684N>C | p.Trp228Cys | p.W228C | P06493 | protein_coding | deleterious(0.01) | probably_damaging(0.998) | TCGA-D8-A1JL-01 | Breast | breast invasive carcinoma | Female | >=65 | I/II | Unknown | Unknown | SD | |
| CDK1 | SNV | Missense_Mutation | novel | c.768G>T | p.Leu256Phe | p.L256F | P06493 | protein_coding | deleterious(0.03) | benign(0.145) | TCGA-E2-A1LE-01 | Breast | breast invasive carcinoma | Female | >=65 | III/IV | Chemotherapy | herceptin | PD |
| CDK1 | SNV | Missense_Mutation | rs45540532 | c.539N>A | p.Arg180His | p.R180H | P06493 | protein_coding | tolerated(0.68) | possibly_damaging(0.876) | TCGA-A6-5665-01 | Colorectum | colon adenocarcinoma | Female | >=65 | I/II | Unknown | Unknown | PD |
| CDK1 | SNV | Missense_Mutation | c.824N>A | p.Arg275Gln | p.R275Q | P06493 | protein_coding | deleterious(0.04) | possibly_damaging(0.795) | TCGA-A6-6141-01 | Colorectum | colon adenocarcinoma | Male | <65 | I/II | Chemotherapy | 5-fu | SD | |
| CDK1 | SNV | Missense_Mutation | c.688N>C | p.Glu230Gln | p.E230Q | P06493 | protein_coding | deleterious(0.04) | benign(0.167) | TCGA-AA-3495-01 | Colorectum | colon adenocarcinoma | Male | >=65 | I/II | Unknown | Unknown | SD | |
| CDK1 | SNV | Missense_Mutation | c.26A>G | p.Lys9Arg | p.K9R | P06493 | protein_coding | deleterious(0.03) | probably_damaging(0.995) | TCGA-AZ-6603-01 | Colorectum | colon adenocarcinoma | Female | >=65 | I/II | Unknown | Unknown | SD | |
| CDK1 | SNV | Missense_Mutation | novel | c.373N>A | p.Leu125Ile | p.L125I | P06493 | protein_coding | tolerated(0.2) | benign(0.129) | TCGA-CA-6717-01 | Colorectum | colon adenocarcinoma | Male | <65 | I/II | Chemotherapy | oxaliplatin | CR |
| CDK1 | SNV | Missense_Mutation | c.791N>C | p.Leu264Pro | p.L264P | P06493 | protein_coding | deleterious(0.01) | probably_damaging(1) | TCGA-CK-6746-01 | Colorectum | colon adenocarcinoma | Female | >=65 | I/II | Unknown | Unknown | SD |
| Page: 1 2 3 |
Top |
Related drugs of malignant transformation related genes |
| Identification of chemicals and drugs interact with genes involved in malignant transfromation |
| (DGIdb 4.0) |
| Entrez ID | Symbol | Category | Interaction Types | Drug Claim Name | Drug Name | PMIDs |
| 983 | CDK1 | SERINE THREONINE KINASE, KINASE, DNA REPAIR, TRANSCRIPTION FACTOR, DRUGGABLE GENOME, ENZYME | RGB-286638 | RGB-286638 | ||
| 983 | CDK1 | SERINE THREONINE KINASE, KINASE, DNA REPAIR, TRANSCRIPTION FACTOR, DRUGGABLE GENOME, ENZYME | inhibitor | BAY1000394 | ||
| 983 | CDK1 | SERINE THREONINE KINASE, KINASE, DNA REPAIR, TRANSCRIPTION FACTOR, DRUGGABLE GENOME, ENZYME | inhibitor | CHEMBL3545420 | AG-24322 | |
| 983 | CDK1 | SERINE THREONINE KINASE, KINASE, DNA REPAIR, TRANSCRIPTION FACTOR, DRUGGABLE GENOME, ENZYME | BAY 10-00394 | |||
| 983 | CDK1 | SERINE THREONINE KINASE, KINASE, DNA REPAIR, TRANSCRIPTION FACTOR, DRUGGABLE GENOME, ENZYME | inhibitor | CHEMBL3544942 | RONICICLIB | |
| 983 | CDK1 | SERINE THREONINE KINASE, KINASE, DNA REPAIR, TRANSCRIPTION FACTOR, DRUGGABLE GENOME, ENZYME | inhibitor | 223366203 | RONICICLIB | |
| 983 | CDK1 | SERINE THREONINE KINASE, KINASE, DNA REPAIR, TRANSCRIPTION FACTOR, DRUGGABLE GENOME, ENZYME | inhibitor | 249565694 | CHIR-99021 | |
| 983 | CDK1 | SERINE THREONINE KINASE, KINASE, DNA REPAIR, TRANSCRIPTION FACTOR, DRUGGABLE GENOME, ENZYME | inhibitor | 249565590 | CHEMBL1236539 | |
| 983 | CDK1 | SERINE THREONINE KINASE, KINASE, DNA REPAIR, TRANSCRIPTION FACTOR, DRUGGABLE GENOME, ENZYME | L-751250 | |||
| 983 | CDK1 | SERINE THREONINE KINASE, KINASE, DNA REPAIR, TRANSCRIPTION FACTOR, DRUGGABLE GENOME, ENZYME | inhibitor | CHEMBL445813 | AT-7519 |
| Page: 1 2 3 4 5 6 7 8 9 10 11 12 |

Copyright 2023-Present -The University of Texas Health Science Center at Houston |