
|
|||||
|
 | |
| |
| |
| |
| |
| |
|
Gene: CAD |
Gene summary for CAD |
| Gene information | Species | Human | Gene symbol | CAD | Gene ID | 790 |
| Gene name | carbamoyl-phosphate synthetase 2, aspartate transcarbamylase, and dihydroorotase | |
| Gene Alias | CDG1Z | |
| Cytomap | 2p23.3 | |
| Gene Type | protein-coding | GO ID | GO:0000003 | UniProtAcc | F8VPD4 |
Top |
Malignant transformation analysis |
| Identification of the aberrant gene expression in precancerous and cancerous lesions by comparing the gene expression of stem-like cells in diseased tissues with normal stem cells |
| Entrez ID | Symbol | Replicates | Species | Organ | Tissue | Adj P-value | Log2FC | Malignancy |
| 790 | CAD | LZE4T | Human | Esophagus | ESCC | 5.13e-03 | 8.84e-02 | 0.0811 |
| 790 | CAD | LZE24T | Human | Esophagus | ESCC | 4.08e-03 | 5.93e-02 | 0.0596 |
| 790 | CAD | P1T-E | Human | Esophagus | ESCC | 1.43e-04 | 2.09e-01 | 0.0875 |
| 790 | CAD | P2T-E | Human | Esophagus | ESCC | 1.69e-08 | 2.10e-01 | 0.1177 |
| 790 | CAD | P4T-E | Human | Esophagus | ESCC | 6.37e-12 | 1.64e-01 | 0.1323 |
| 790 | CAD | P5T-E | Human | Esophagus | ESCC | 2.65e-04 | 1.24e-01 | 0.1327 |
| 790 | CAD | P8T-E | Human | Esophagus | ESCC | 1.26e-04 | 1.23e-01 | 0.0889 |
| 790 | CAD | P9T-E | Human | Esophagus | ESCC | 1.02e-03 | 9.63e-02 | 0.1131 |
| 790 | CAD | P10T-E | Human | Esophagus | ESCC | 1.67e-18 | 3.53e-01 | 0.116 |
| 790 | CAD | P11T-E | Human | Esophagus | ESCC | 2.15e-04 | 2.19e-01 | 0.1426 |
| 790 | CAD | P12T-E | Human | Esophagus | ESCC | 1.30e-07 | 1.83e-01 | 0.1122 |
| 790 | CAD | P15T-E | Human | Esophagus | ESCC | 8.99e-16 | 3.04e-01 | 0.1149 |
| 790 | CAD | P16T-E | Human | Esophagus | ESCC | 9.60e-09 | 1.84e-01 | 0.1153 |
| 790 | CAD | P17T-E | Human | Esophagus | ESCC | 7.98e-04 | 2.21e-01 | 0.1278 |
| 790 | CAD | P19T-E | Human | Esophagus | ESCC | 5.38e-03 | 4.59e-01 | 0.1662 |
| 790 | CAD | P20T-E | Human | Esophagus | ESCC | 1.92e-07 | 1.58e-01 | 0.1124 |
| 790 | CAD | P21T-E | Human | Esophagus | ESCC | 2.72e-13 | 2.49e-01 | 0.1617 |
| 790 | CAD | P22T-E | Human | Esophagus | ESCC | 8.77e-18 | 2.36e-01 | 0.1236 |
| 790 | CAD | P23T-E | Human | Esophagus | ESCC | 2.04e-05 | 1.24e-01 | 0.108 |
| 790 | CAD | P24T-E | Human | Esophagus | ESCC | 1.61e-05 | 1.63e-01 | 0.1287 |
| Page: 1 2 3 4 |
| Tissue | Expression Dynamics | Abbreviation |
| Esophagus | 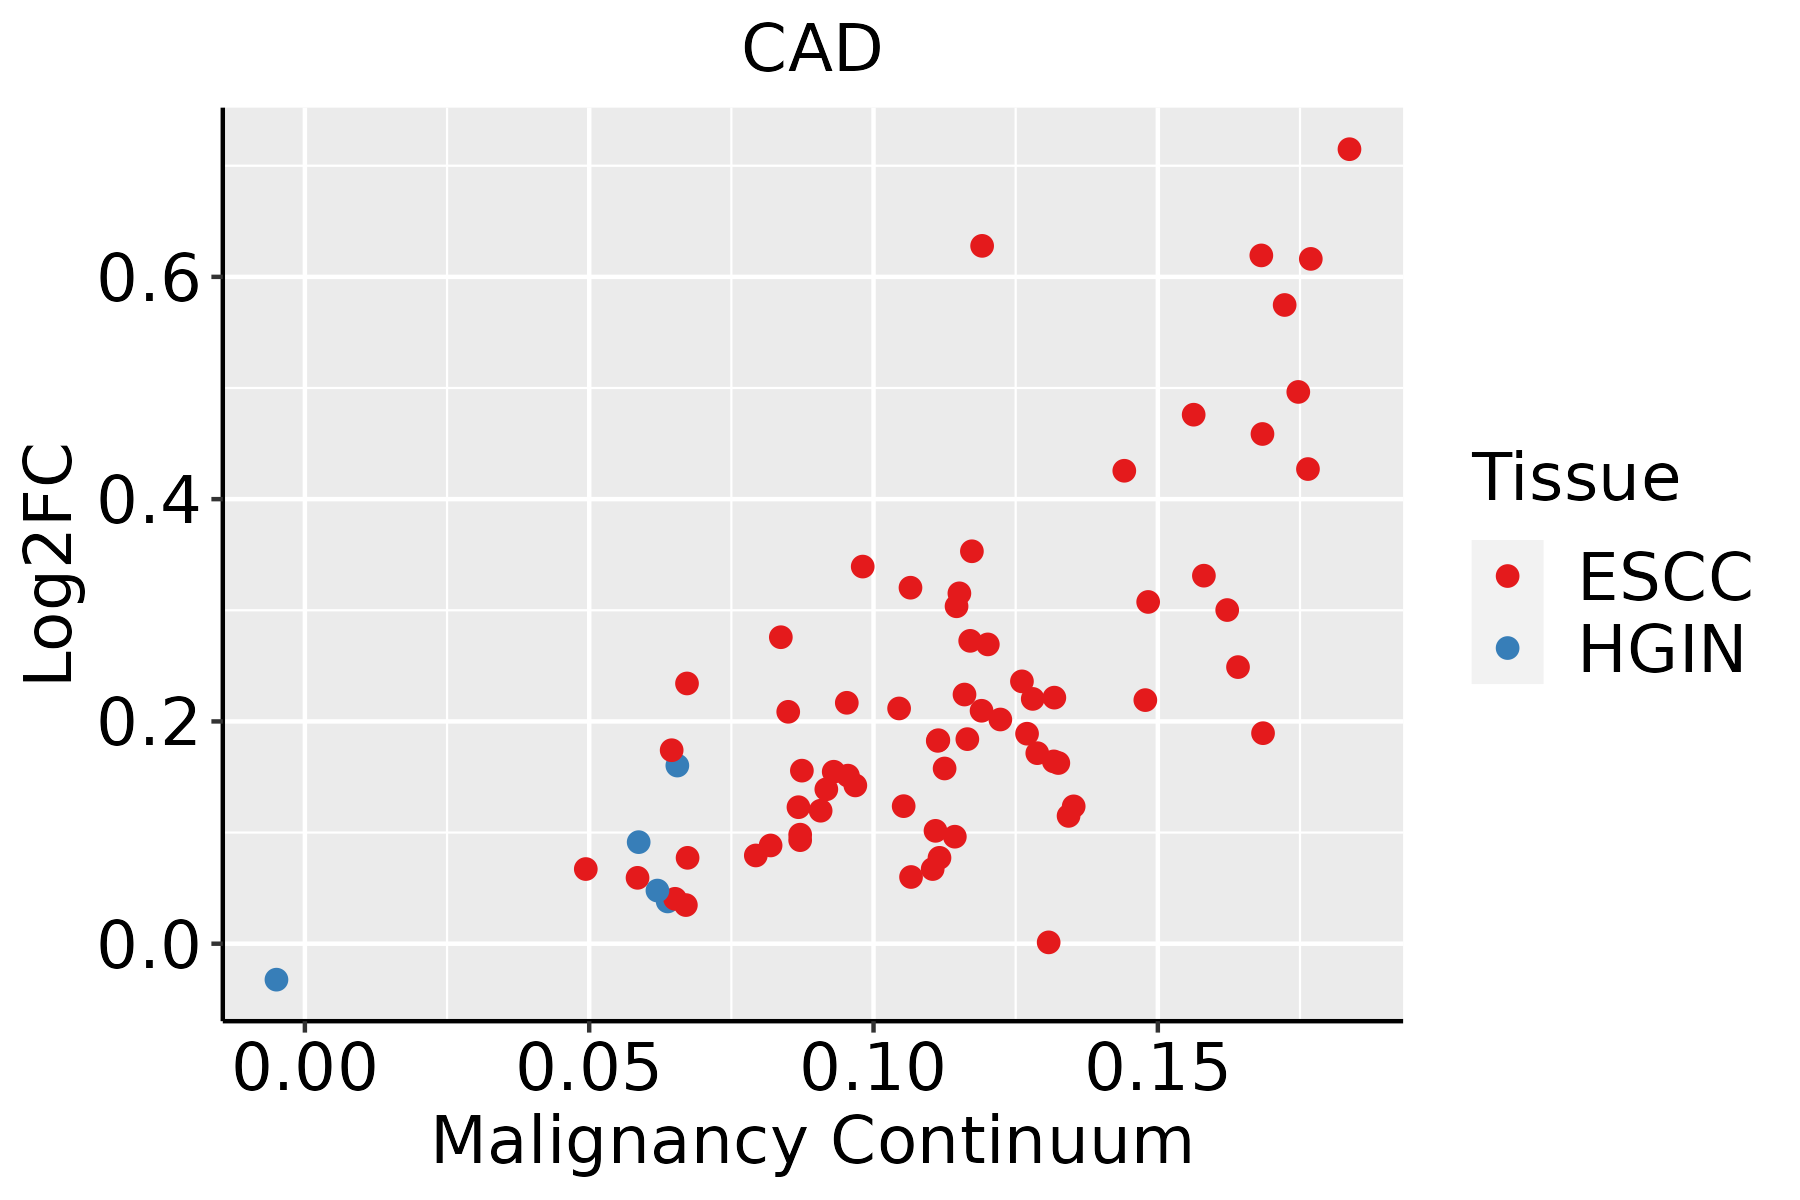 | ESCC: Esophageal squamous cell carcinoma |
| HGIN: High-grade intraepithelial neoplasias | ||
| LGIN: Low-grade intraepithelial neoplasias | ||
| Liver |  | HCC: Hepatocellular carcinoma |
| NAFLD: Non-alcoholic fatty liver disease | ||
| Oral Cavity |  | EOLP: Erosive Oral lichen planus |
| LP: leukoplakia | ||
| NEOLP: Non-erosive oral lichen planus | ||
| OSCC: Oral squamous cell carcinoma |
| ∗log2FC in expression of this searched gene in stem-like cells from each diseased tissue sample relative to stem-like cells in normal samples in each tissue plotted against the malignancy continuum. Samples are colored based on if they are from different disease stage. |
Top |
Malignant transformation related pathway analysis |
| Find out the enriched GO biological processes and KEGG pathways involved in transition from healthy to precancer to cancer |
| Tissue | Disease Stage | Enriched GO biological Processes |
| Colorectum | AD |  |
| Colorectum | SER |  |
| Colorectum | MSS |  |
| Colorectum | MSI-H |  |
| Colorectum | FAP |  |
| ∗Top 15 enriched GO BP terms are showed in the bar plot of each disease state in each tissue. Each row represents a significant GO biological process which is colored according to the -log10(p.adjust). |
| Page: 1 2 3 4 5 6 7 8 9 |
| GO ID | Tissue | Disease Stage | Description | Gene Ratio | Bg Ratio | pvalue | p.adjust | Count |
| GO:004218021 | Liver | HCC | cellular ketone metabolic process | 123/7958 | 211/18723 | 2.52e-06 | 3.37e-05 | 123 |
| GO:007084911 | Liver | HCC | response to epidermal growth factor | 37/7958 | 49/18723 | 2.70e-06 | 3.61e-05 | 37 |
| GO:003025821 | Liver | HCC | lipid modification | 123/7958 | 212/18723 | 3.50e-06 | 4.58e-05 | 123 |
| GO:000914212 | Liver | HCC | nucleoside triphosphate biosynthetic process | 57/7958 | 85/18723 | 4.10e-06 | 5.27e-05 | 57 |
| GO:000912311 | Liver | HCC | nucleoside monophosphate metabolic process | 52/7958 | 76/18723 | 4.35e-06 | 5.54e-05 | 52 |
| GO:00192162 | Liver | HCC | regulation of lipid metabolic process | 181/7958 | 331/18723 | 4.58e-06 | 5.79e-05 | 181 |
| GO:005138421 | Liver | HCC | response to glucocorticoid | 90/7958 | 148/18723 | 5.18e-06 | 6.47e-05 | 90 |
| GO:00090632 | Liver | HCC | cellular amino acid catabolic process | 70/7958 | 110/18723 | 6.12e-06 | 7.52e-05 | 70 |
| GO:001604221 | Liver | HCC | lipid catabolic process | 175/7958 | 320/18723 | 6.50e-06 | 7.88e-05 | 175 |
| GO:007136411 | Liver | HCC | cellular response to epidermal growth factor stimulus | 34/7958 | 45/18723 | 6.75e-06 | 8.08e-05 | 34 |
| GO:00106752 | Liver | HCC | regulation of cellular carbohydrate metabolic process | 88/7958 | 146/18723 | 1.08e-05 | 1.24e-04 | 88 |
| GO:00091612 | Liver | HCC | ribonucleoside monophosphate metabolic process | 41/7958 | 58/18723 | 1.29e-05 | 1.44e-04 | 41 |
| GO:00091995 | Liver | HCC | ribonucleoside triphosphate metabolic process | 58/7958 | 89/18723 | 1.31e-05 | 1.45e-04 | 58 |
| GO:004239821 | Liver | HCC | cellular modified amino acid biosynthetic process | 34/7958 | 46/18723 | 1.53e-05 | 1.67e-04 | 34 |
| GO:000663321 | Liver | HCC | fatty acid biosynthetic process | 96/7958 | 163/18723 | 1.71e-05 | 1.85e-04 | 96 |
| GO:003196021 | Liver | HCC | response to corticosteroid | 98/7958 | 167/18723 | 1.73e-05 | 1.87e-04 | 98 |
| GO:00062201 | Liver | HCC | pyrimidine nucleotide metabolic process | 36/7958 | 50/18723 | 2.28e-05 | 2.41e-04 | 36 |
| GO:00062062 | Liver | HCC | pyrimidine nucleobase metabolic process | 15/7958 | 16/18723 | 2.55e-05 | 2.66e-04 | 15 |
| GO:00092015 | Liver | HCC | ribonucleoside triphosphate biosynthetic process | 49/7958 | 74/18723 | 3.21e-05 | 3.26e-04 | 49 |
| GO:004426221 | Liver | HCC | cellular carbohydrate metabolic process | 153/7958 | 283/18723 | 5.27e-05 | 5.00e-04 | 153 |
| Page: 1 2 3 4 5 6 7 8 9 10 11 12 13 14 15 16 17 18 19 20 21 22 23 24 25 26 27 28 29 30 31 32 33 34 35 36 37 38 39 40 41 42 43 44 45 46 47 48 49 |
| Pathway ID | Tissue | Disease Stage | Description | Gene Ratio | Bg Ratio | pvalue | p.adjust | qvalue | Count |
| hsa012405 | Esophagus | ESCC | Biosynthesis of cofactors | 97/4205 | 153/8465 | 3.88e-04 | 1.35e-03 | 6.94e-04 | 97 |
| hsa002405 | Esophagus | ESCC | Pyrimidine metabolism | 41/4205 | 58/8465 | 9.14e-04 | 2.92e-03 | 1.49e-03 | 41 |
| hsa0124012 | Esophagus | ESCC | Biosynthesis of cofactors | 97/4205 | 153/8465 | 3.88e-04 | 1.35e-03 | 6.94e-04 | 97 |
| hsa0024012 | Esophagus | ESCC | Pyrimidine metabolism | 41/4205 | 58/8465 | 9.14e-04 | 2.92e-03 | 1.49e-03 | 41 |
| hsa012402 | Liver | HCC | Biosynthesis of cofactors | 103/4020 | 153/8465 | 4.67e-07 | 5.05e-06 | 2.81e-06 | 103 |
| hsa002402 | Liver | HCC | Pyrimidine metabolism | 44/4020 | 58/8465 | 9.34e-06 | 7.11e-05 | 3.95e-05 | 44 |
| hsa012403 | Liver | HCC | Biosynthesis of cofactors | 103/4020 | 153/8465 | 4.67e-07 | 5.05e-06 | 2.81e-06 | 103 |
| hsa002403 | Liver | HCC | Pyrimidine metabolism | 44/4020 | 58/8465 | 9.34e-06 | 7.11e-05 | 3.95e-05 | 44 |
| hsa012404 | Oral cavity | OSCC | Biosynthesis of cofactors | 88/3704 | 153/8465 | 3.84e-04 | 1.20e-03 | 6.12e-04 | 88 |
| hsa0124011 | Oral cavity | OSCC | Biosynthesis of cofactors | 88/3704 | 153/8465 | 3.84e-04 | 1.20e-03 | 6.12e-04 | 88 |
| Page: 1 |
Top |
Cell-cell communication analysis |
| Identification of potential cell-cell interactions between two cell types and their ligand-receptor pairs for different disease states |
| Ligand | Receptor | LRpair | Pathway | Tissue | Disease Stage |
| CADM1 | CADM1 | CADM1_CADM1 | CADM | Breast | DCIS |
| CADM1 | CADM1 | CADM1_CADM1 | CADM | Breast | IDC |
| CADM1 | CADM1 | CADM1_CADM1 | CADM | Cervix | Precancer |
| CADM1 | CADM1 | CADM1_CADM1 | CADM | CRC | ADJ |
| CADM1 | CADM1 | CADM1_CADM1 | CADM | CRC | CRC |
| CADM1 | CADM1 | CADM1_CADM1 | CADM | CRC | FAP |
| CADM1 | CADM1 | CADM1_CADM1 | CADM | Endometrium | ADJ |
| CADM1 | CADM1 | CADM1_CADM1 | CADM | Endometrium | AEH |
| CADM1 | CADM1 | CADM1_CADM1 | CADM | Endometrium | EEC |
| CADM1 | CADM1 | CADM1_CADM1 | CADM | Endometrium | Healthy |
| CADM1 | CADM1 | CADM1_CADM1 | CADM | Esophagus | ADJ |
| CADM1 | CADM1 | CADM1_CADM1 | CADM | Esophagus | ESCC |
| CADM1 | CADM1 | CADM1_CADM1 | CADM | GC | ADJ |
| CADM1 | CADM1 | CADM1_CADM1 | CADM | GC | GC |
| CADM1 | CADM1 | CADM1_CADM1 | CADM | GC | Precancer |
| CADM3 | CADM3 | CADM3_CADM3 | CADM | GC | Precancer |
| CADM3 | CADM3 | CADM3_CADM3 | CADM | HNSCC | ADJ |
| CADM3 | CADM3 | CADM3_CADM3 | CADM | HNSCC | Healthy |
| CADM1 | CADM1 | CADM1_CADM1 | CADM | HNSCC | OSCC |
| CADM1 | CADM1 | CADM1_CADM1 | CADM | HNSCC | Precancer |
| Page: 1 |
Top |
Single-cell gene regulatory network inference analysis |
| Find out the significant the regulons (TFs) and the target genes of each regulon across cell types for different disease states |
| TF | Cell Type | Tissue | Disease Stage | Target Gene | RSS | Regulon Activity |
| ∗The dot plots of a searched regulon are shown for all cell subpopulations in each disease state of each tissue based on the regulon specific score inferred using pySCENIC and by calculating the average expression. |
| Page: 1 |
Top |
Somatic mutation of malignant transformation related genes |
| Annotation of somatic variants for genes involved in malignant transformation |
| Hugo Symbol | Variant Class | Variant Classification | dbSNP RS | HGVSc | HGVSp | HGVSp Short | SWISSPROT | BIOTYPE | SIFT | PolyPhen | Tumor Sample Barcode | Tissue | Histology | Sex | Age | Stage | Therapy Types | Drugs | Outcome |
| CAD | SNV | Missense_Mutation | c.2277G>A | p.Met759Ile | p.M759I | P27708 | protein_coding | deleterious(0) | benign(0.03) | TCGA-A2-A04W-01 | Breast | breast invasive carcinoma | Female | <65 | I/II | Chemotherapy | cytoxan | SD | |
| CAD | SNV | Missense_Mutation | novel | c.6202N>C | p.Gly2068Arg | p.G2068R | P27708 | protein_coding | deleterious(0) | probably_damaging(0.999) | TCGA-A2-A0T0-01 | Breast | breast invasive carcinoma | Female | <65 | I/II | Chemotherapy | taxotere | SD |
| CAD | SNV | Missense_Mutation | novel | c.6203N>T | p.Gly2068Val | p.G2068V | P27708 | protein_coding | deleterious(0) | probably_damaging(0.998) | TCGA-A2-A0T0-01 | Breast | breast invasive carcinoma | Female | <65 | I/II | Chemotherapy | taxotere | SD |
| CAD | SNV | Missense_Mutation | c.6149N>A | p.Gly2050Glu | p.G2050E | P27708 | protein_coding | deleterious(0.02) | probably_damaging(1) | TCGA-A2-A0YD-01 | Breast | breast invasive carcinoma | Female | <65 | I/II | Chemotherapy | cytoxan | SD | |
| CAD | SNV | Missense_Mutation | rs182811252 | c.5863N>T | p.Arg1955Trp | p.R1955W | P27708 | protein_coding | deleterious(0.02) | probably_damaging(0.949) | TCGA-A2-A1FX-01 | Breast | breast invasive carcinoma | Female | <65 | III/IV | Chemotherapy | taxotere | SD |
| CAD | SNV | Missense_Mutation | rs367846045 | c.6367N>A | p.Gly2123Ser | p.G2123S | P27708 | protein_coding | deleterious(0.03) | probably_damaging(0.94) | TCGA-A8-A09Z-01 | Breast | breast invasive carcinoma | Female | >=65 | I/II | Unknown | Unknown | SD |
| CAD | SNV | Missense_Mutation | c.1333N>T | p.Gly445Trp | p.G445W | P27708 | protein_coding | deleterious(0) | probably_damaging(0.998) | TCGA-AC-A23C-01 | Breast | breast invasive carcinoma | Female | <65 | I/II | Chemotherapy | chemo | CR | |
| CAD | SNV | Missense_Mutation | c.2977N>A | p.Glu993Lys | p.E993K | P27708 | protein_coding | deleterious(0.01) | probably_damaging(0.998) | TCGA-AC-A23H-01 | Breast | breast invasive carcinoma | Female | >=65 | I/II | Unknown | Unknown | PD | |
| CAD | SNV | Missense_Mutation | novel | c.2888N>A | p.Arg963Gln | p.R963Q | P27708 | protein_coding | deleterious(0) | possibly_damaging(0.738) | TCGA-AN-A046-01 | Breast | breast invasive carcinoma | Female | >=65 | I/II | Unknown | Unknown | SD |
| CAD | SNV | Missense_Mutation | c.1493N>T | p.Gly498Val | p.G498V | P27708 | protein_coding | deleterious(0) | benign(0.113) | TCGA-AN-A0AK-01 | Breast | breast invasive carcinoma | Female | >=65 | I/II | Unknown | Unknown | SD |
| Page: 1 2 3 4 5 6 7 8 9 10 11 12 13 14 15 16 17 18 19 20 21 22 23 |
Top |
Related drugs of malignant transformation related genes |
| Identification of chemicals and drugs interact with genes involved in malignant transfromation |
| (DGIdb 4.0) |
| Entrez ID | Symbol | Category | Interaction Types | Drug Claim Name | Drug Name | PMIDs |
| Page: 1 |

Copyright 2023-Present -The University of Texas Health Science Center at Houston |