
|
|||||
|
 | |
| |
| |
| |
| |
| |
|
Gene: BRD4 |
Gene summary for BRD4 |
| Gene information | Species | Human | Gene symbol | BRD4 | Gene ID | 23476 |
| Gene name | bromodomain containing 4 | |
| Gene Alias | CAP | |
| Cytomap | 19p13.12 | |
| Gene Type | protein-coding | GO ID | GO:0000082 | UniProtAcc | A0A024R7H8 |
Top |
Malignant transformation analysis |
| Identification of the aberrant gene expression in precancerous and cancerous lesions by comparing the gene expression of stem-like cells in diseased tissues with normal stem cells |
| Entrez ID | Symbol | Replicates | Species | Organ | Tissue | Adj P-value | Log2FC | Malignancy |
| 23476 | BRD4 | CA_HPV_1 | Human | Cervix | CC | 2.43e-04 | 6.42e-02 | 0.0264 |
| 23476 | BRD4 | CCI_2 | Human | Cervix | CC | 2.96e-07 | 6.52e-01 | 0.5249 |
| 23476 | BRD4 | CCI_3 | Human | Cervix | CC | 1.34e-03 | 5.92e-01 | 0.516 |
| 23476 | BRD4 | sample1 | Human | Cervix | CC | 2.68e-02 | 4.60e-01 | 0.0959 |
| 23476 | BRD4 | sample3 | Human | Cervix | CC | 2.31e-02 | 7.18e-02 | 0.1387 |
| 23476 | BRD4 | T1 | Human | Cervix | CC | 2.24e-08 | 5.04e-01 | 0.0918 |
| 23476 | BRD4 | HTA11_3410_2000001011 | Human | Colorectum | AD | 3.09e-05 | -3.27e-01 | 0.0155 |
| 23476 | BRD4 | HTA11_7696_3000711011 | Human | Colorectum | AD | 1.49e-10 | 5.38e-01 | 0.0674 |
| 23476 | BRD4 | A015-C-203 | Human | Colorectum | FAP | 1.01e-18 | -1.24e-01 | -0.1294 |
| 23476 | BRD4 | A015-C-204 | Human | Colorectum | FAP | 8.49e-03 | -1.08e-01 | -0.0228 |
| 23476 | BRD4 | A002-C-201 | Human | Colorectum | FAP | 2.74e-08 | 8.28e-02 | 0.0324 |
| 23476 | BRD4 | A001-C-119 | Human | Colorectum | FAP | 1.02e-03 | 4.82e-02 | -0.1557 |
| 23476 | BRD4 | A001-C-108 | Human | Colorectum | FAP | 4.48e-10 | -2.12e-02 | -0.0272 |
| 23476 | BRD4 | A002-C-205 | Human | Colorectum | FAP | 1.53e-18 | -1.13e-01 | -0.1236 |
| 23476 | BRD4 | A015-C-005 | Human | Colorectum | FAP | 2.41e-02 | -1.43e-01 | -0.0336 |
| 23476 | BRD4 | A015-C-006 | Human | Colorectum | FAP | 1.02e-12 | -1.92e-02 | -0.0994 |
| 23476 | BRD4 | A015-C-106 | Human | Colorectum | FAP | 1.02e-06 | -4.20e-02 | -0.0511 |
| 23476 | BRD4 | A002-C-114 | Human | Colorectum | FAP | 3.29e-15 | -2.09e-01 | -0.1561 |
| 23476 | BRD4 | A015-C-104 | Human | Colorectum | FAP | 2.39e-20 | -4.64e-02 | -0.1899 |
| 23476 | BRD4 | A001-C-014 | Human | Colorectum | FAP | 1.61e-05 | -8.49e-02 | 0.0135 |
| Page: 1 2 3 4 5 6 7 8 9 |
| Tissue | Expression Dynamics | Abbreviation |
| Cervix |  | CC: Cervix cancer |
| HSIL_HPV: HPV-infected high-grade squamous intraepithelial lesions | ||
| N_HPV: HPV-infected normal cervix | ||
| Colorectum (GSE201348) |  | FAP: Familial adenomatous polyposis |
| CRC: Colorectal cancer | ||
| Colorectum (HTA11) |  | AD: Adenomas |
| SER: Sessile serrated lesions | ||
| MSI-H: Microsatellite-high colorectal cancer | ||
| MSS: Microsatellite stable colorectal cancer | ||
| Esophagus | 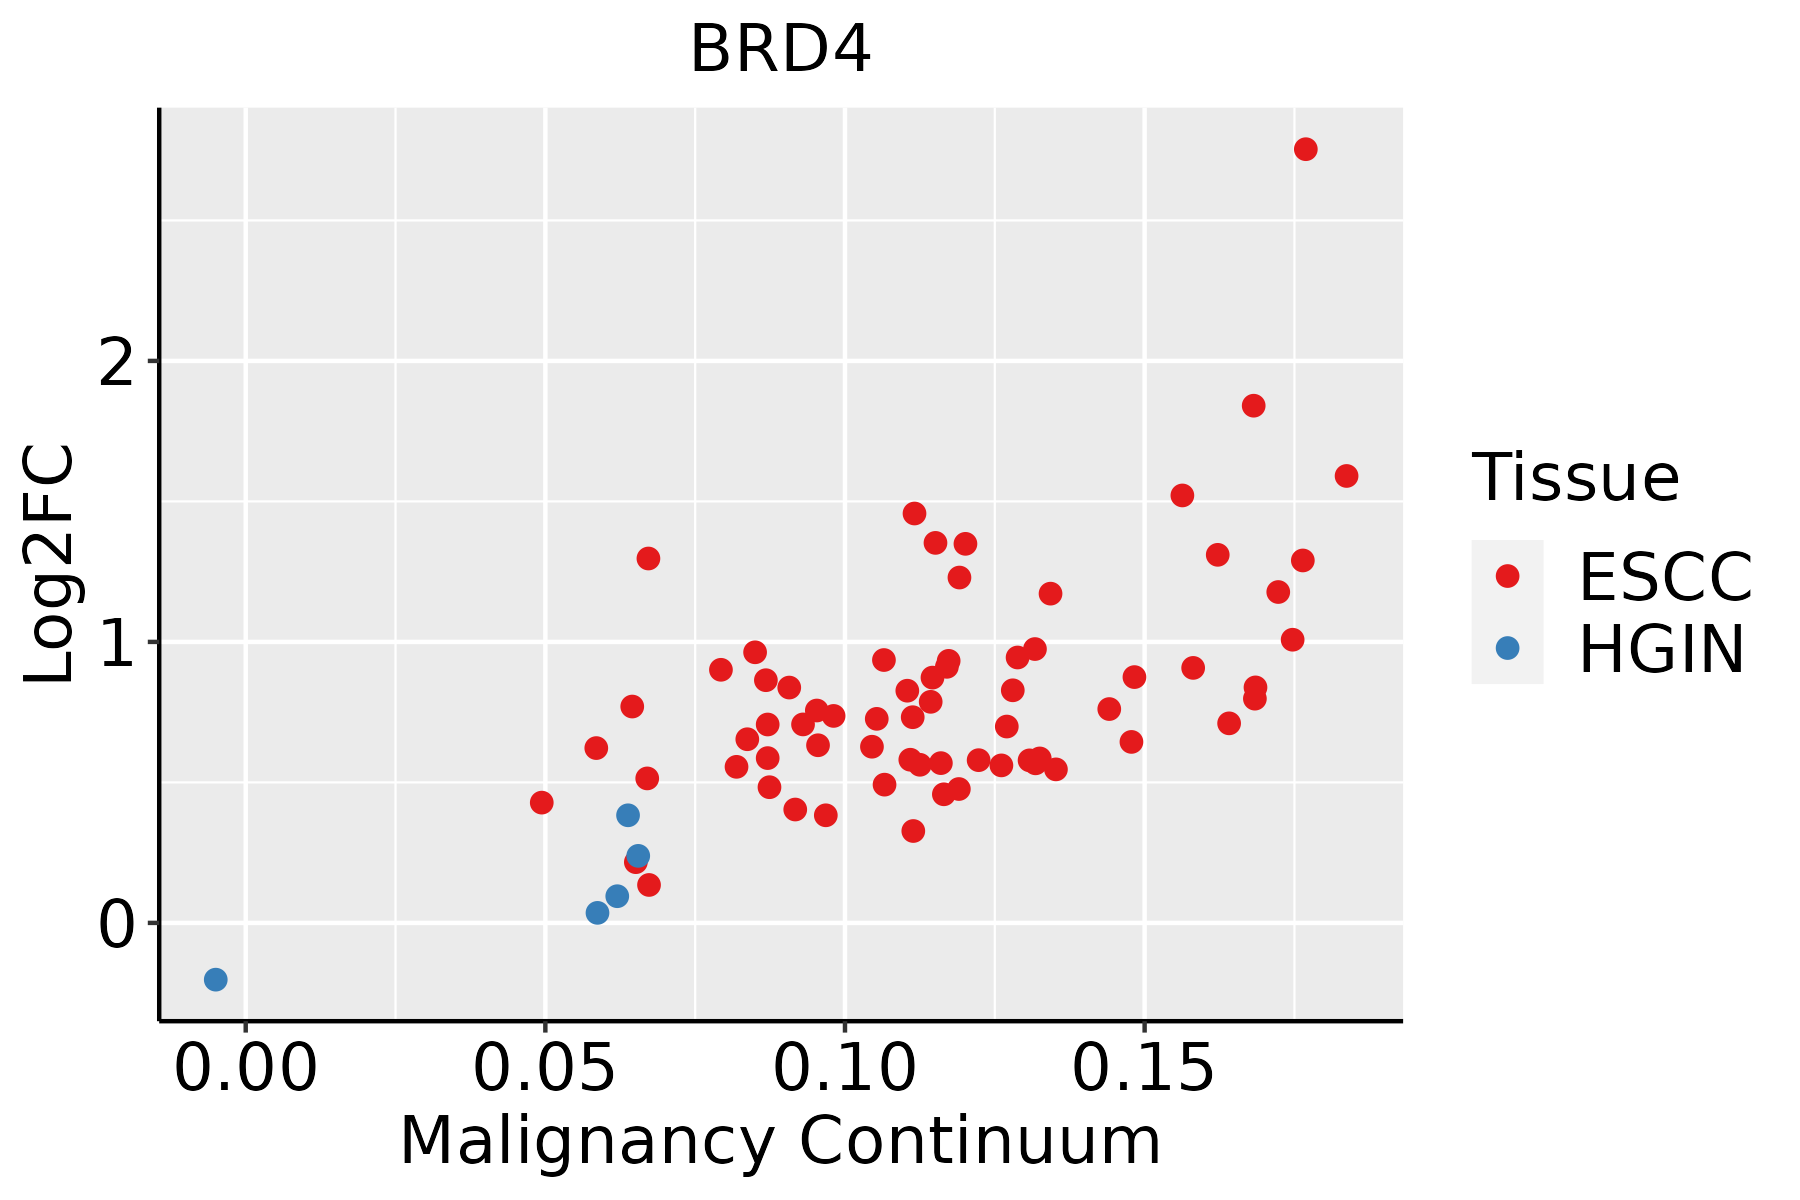 | ESCC: Esophageal squamous cell carcinoma |
| HGIN: High-grade intraepithelial neoplasias | ||
| LGIN: Low-grade intraepithelial neoplasias | ||
| Liver | 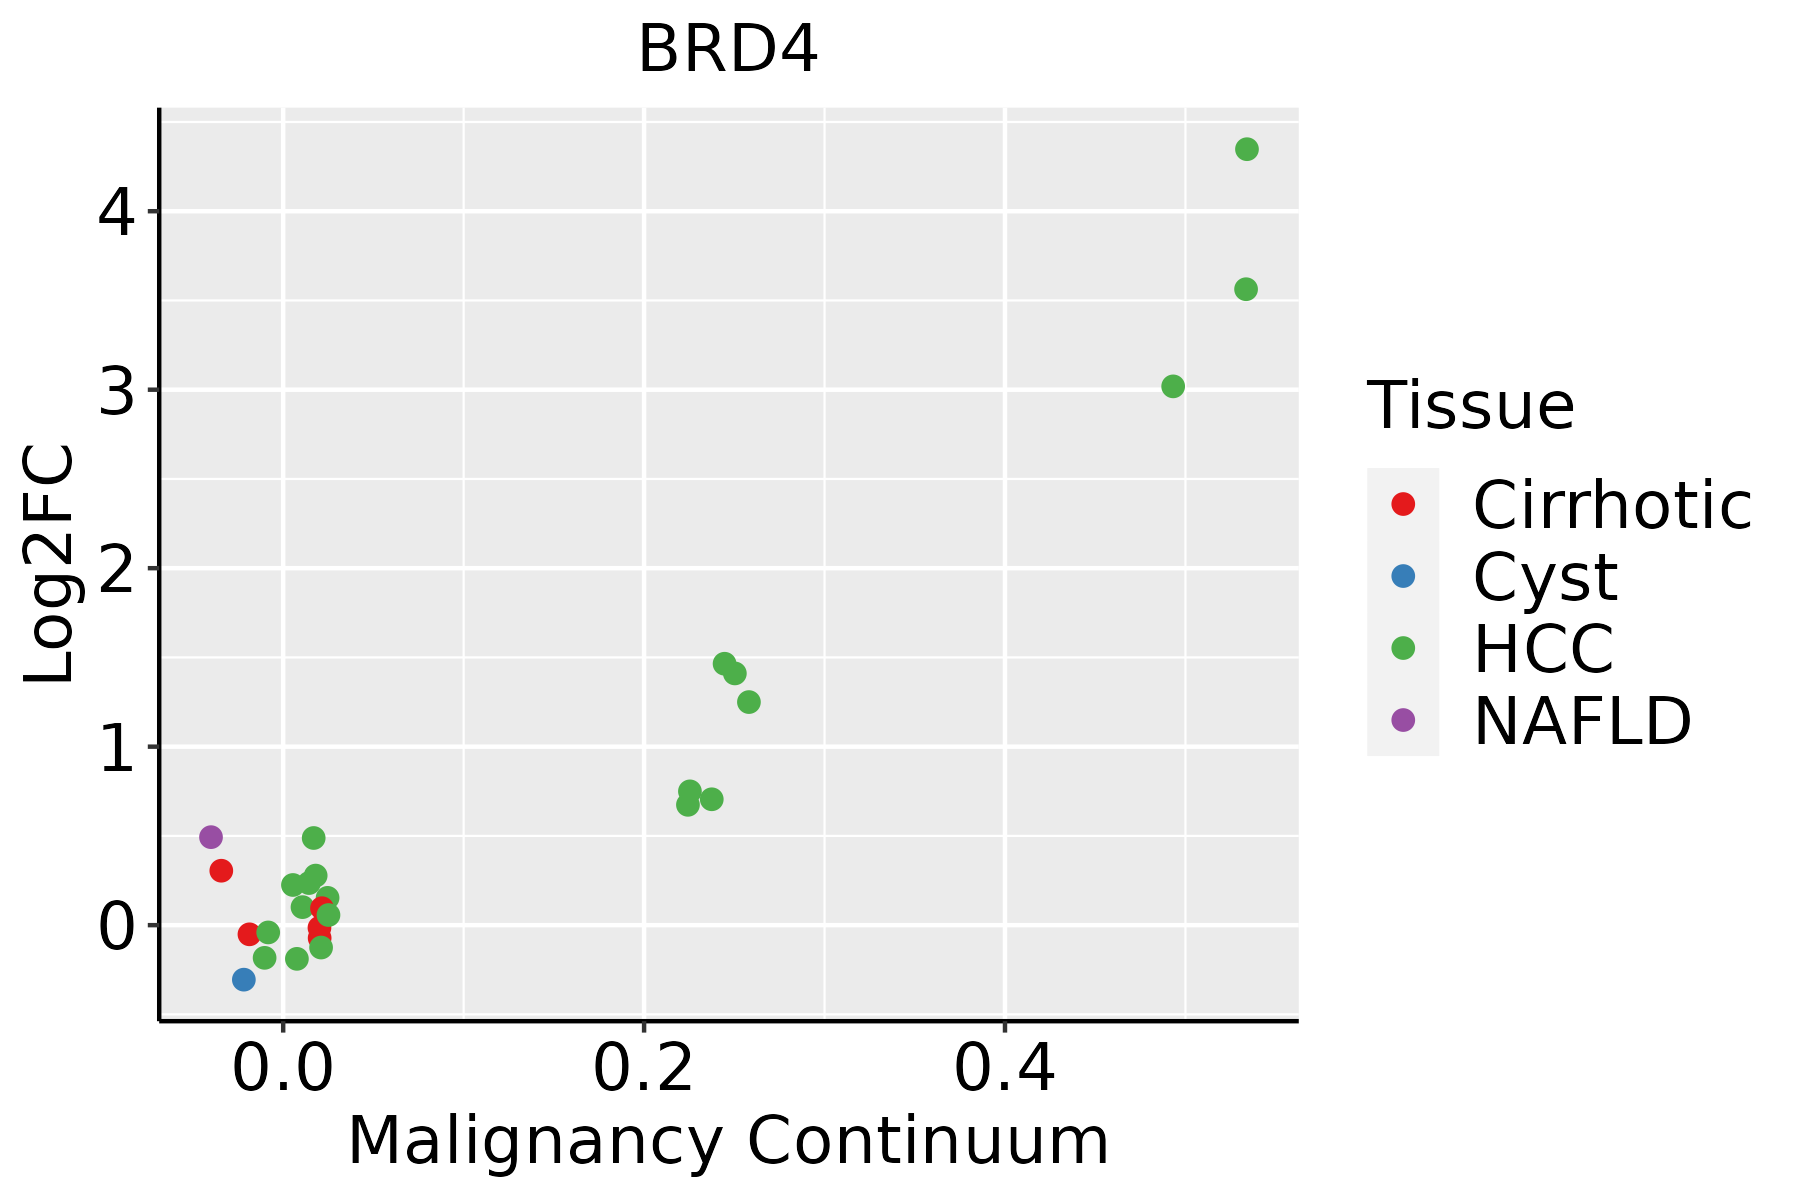 | HCC: Hepatocellular carcinoma |
| NAFLD: Non-alcoholic fatty liver disease | ||
| Oral Cavity | 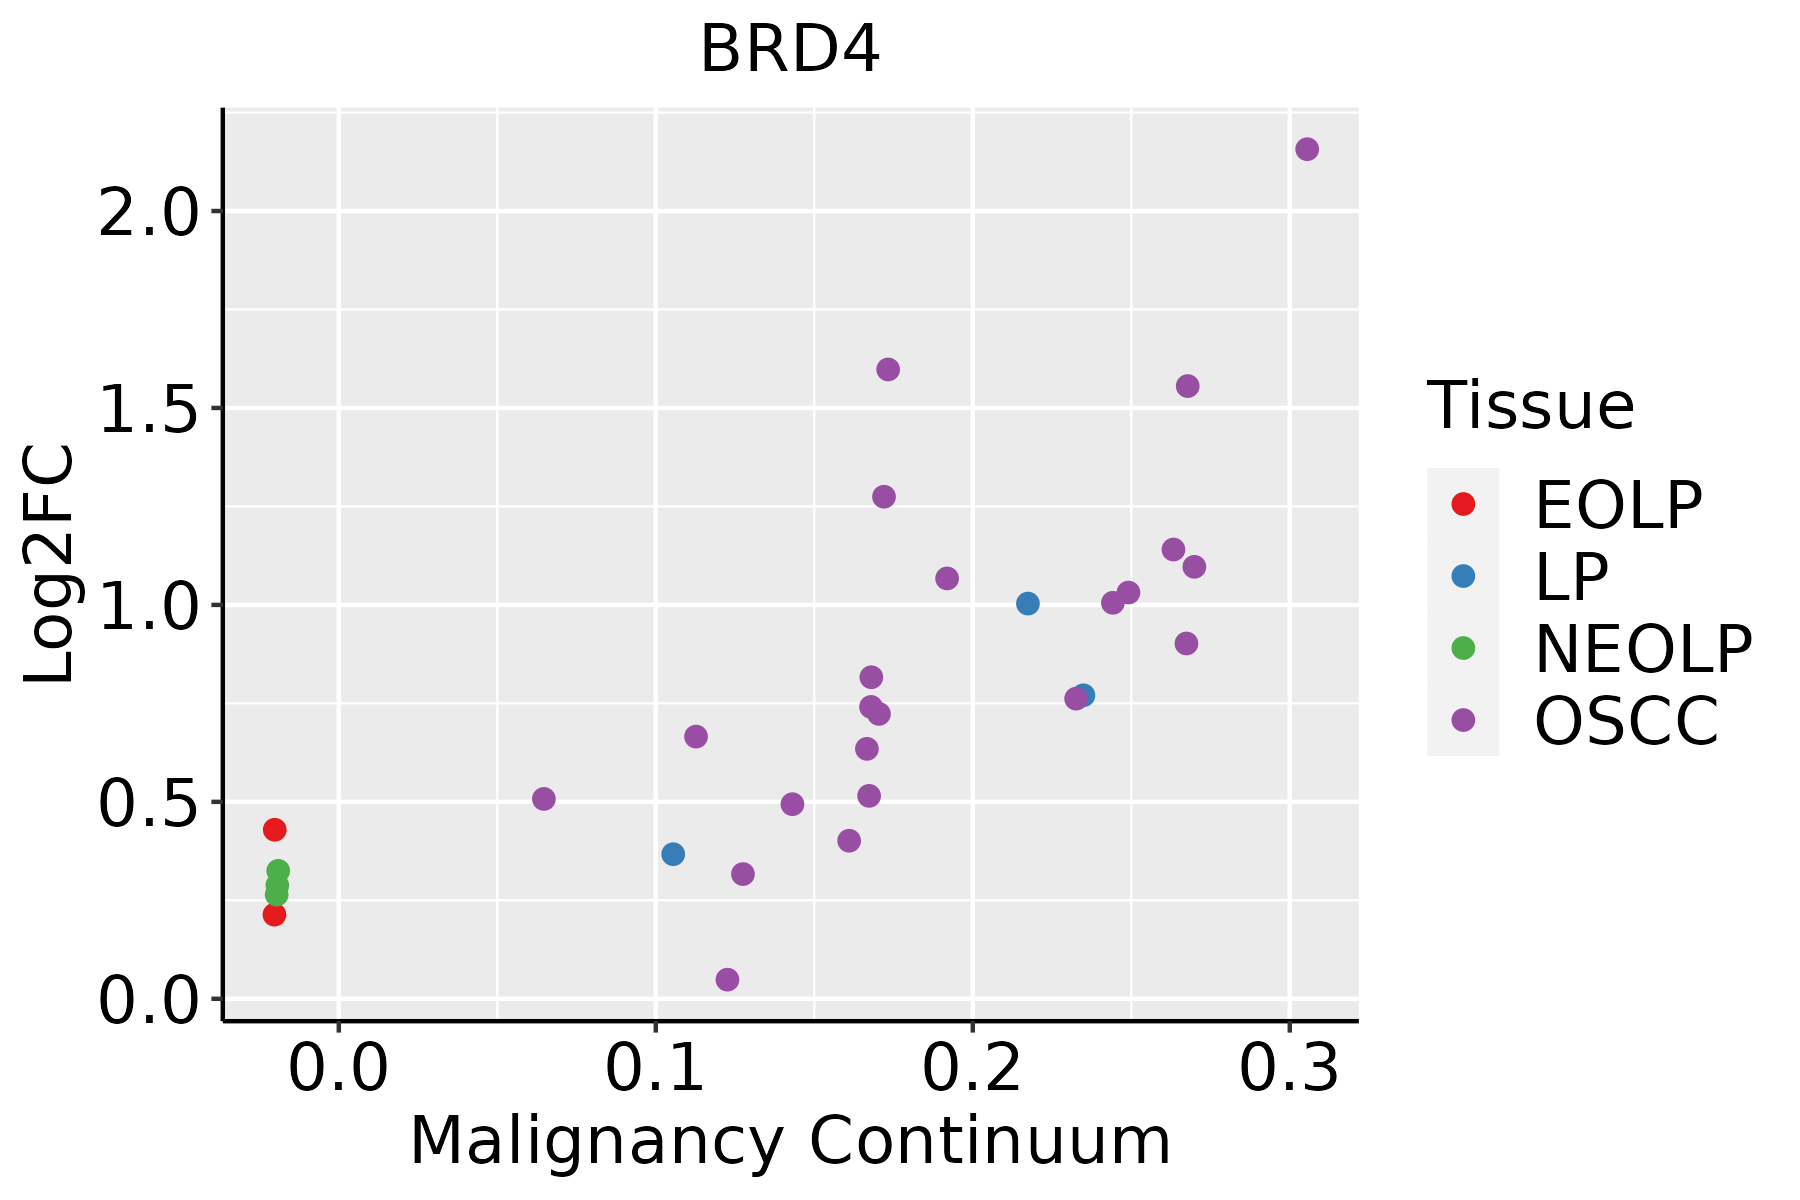 | EOLP: Erosive Oral lichen planus |
| LP: leukoplakia | ||
| NEOLP: Non-erosive oral lichen planus | ||
| OSCC: Oral squamous cell carcinoma | ||
| Skin | 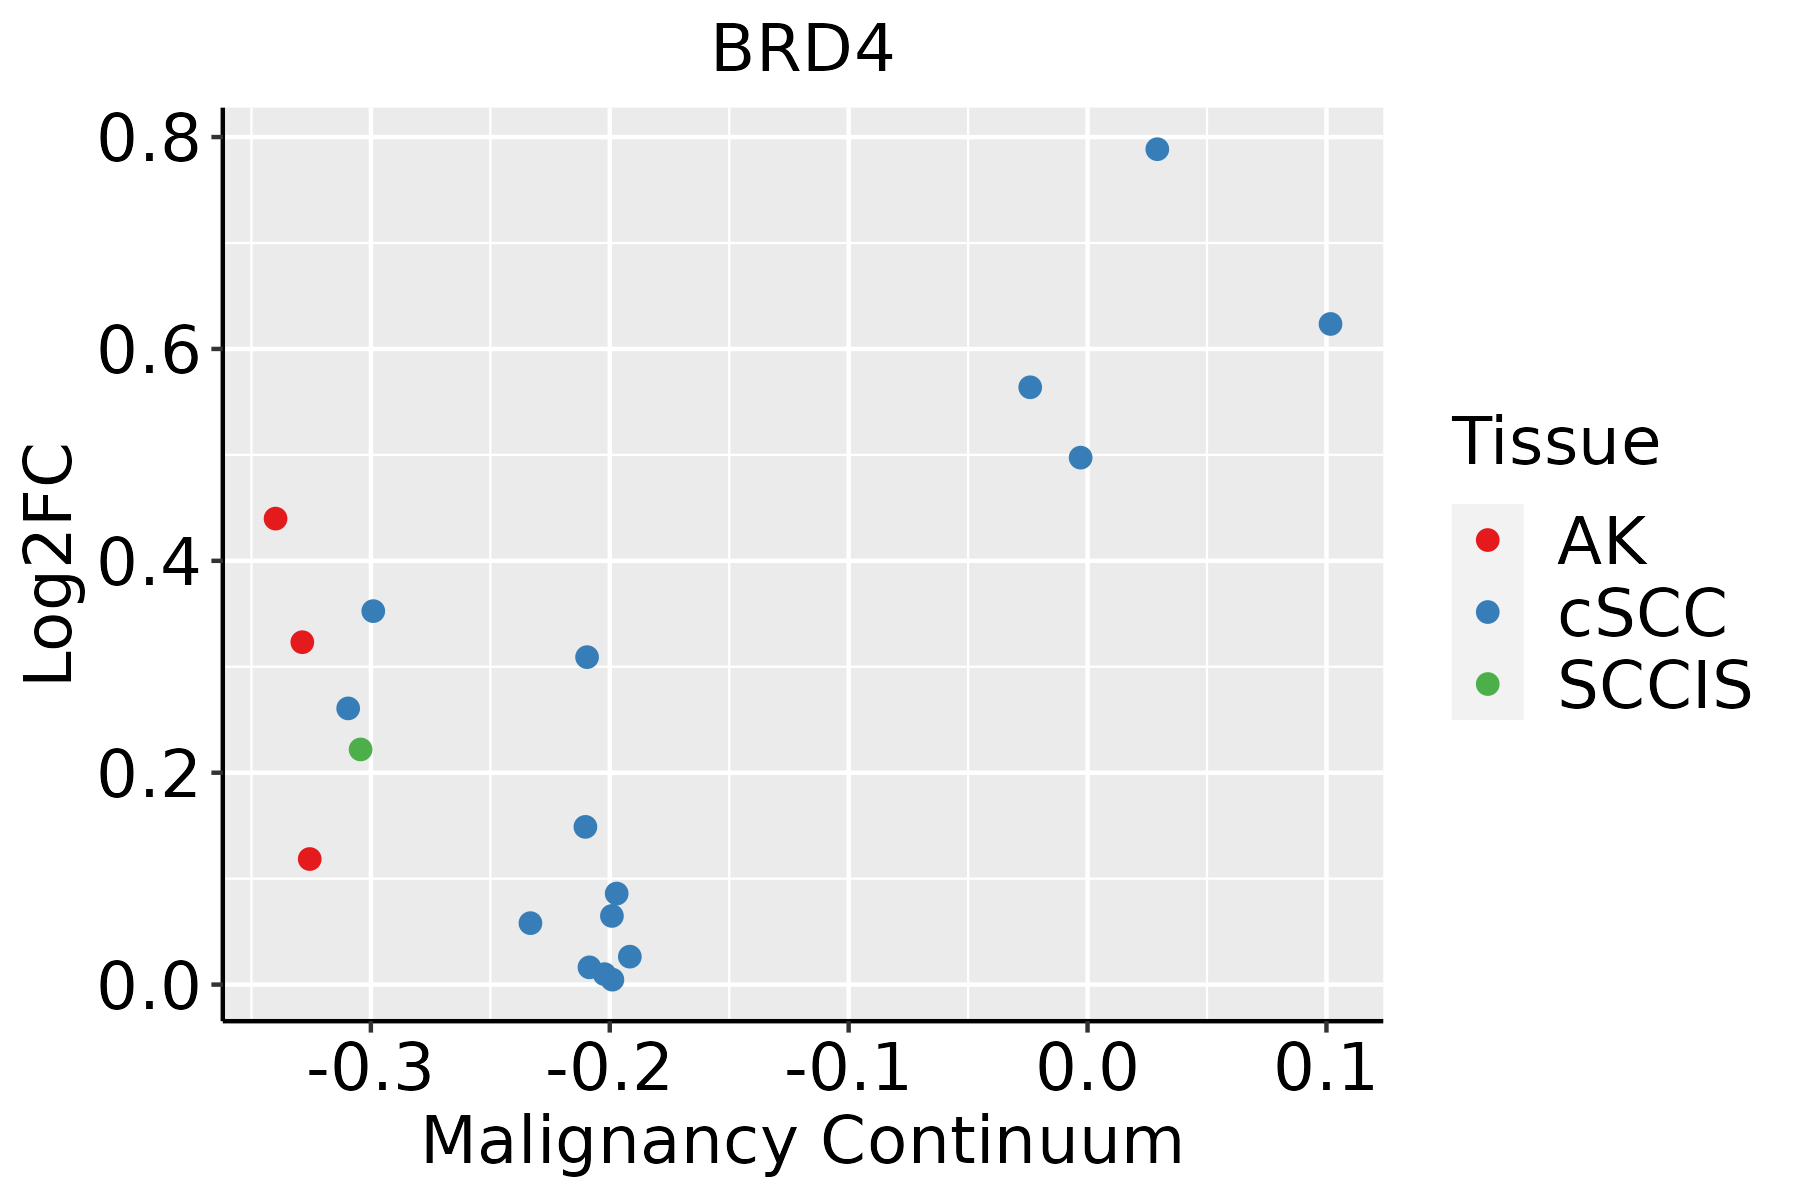 | AK: Actinic keratosis |
| cSCC: Cutaneous squamous cell carcinoma | ||
| SCCIS:squamous cell carcinoma in situ | ||
| Thyroid | 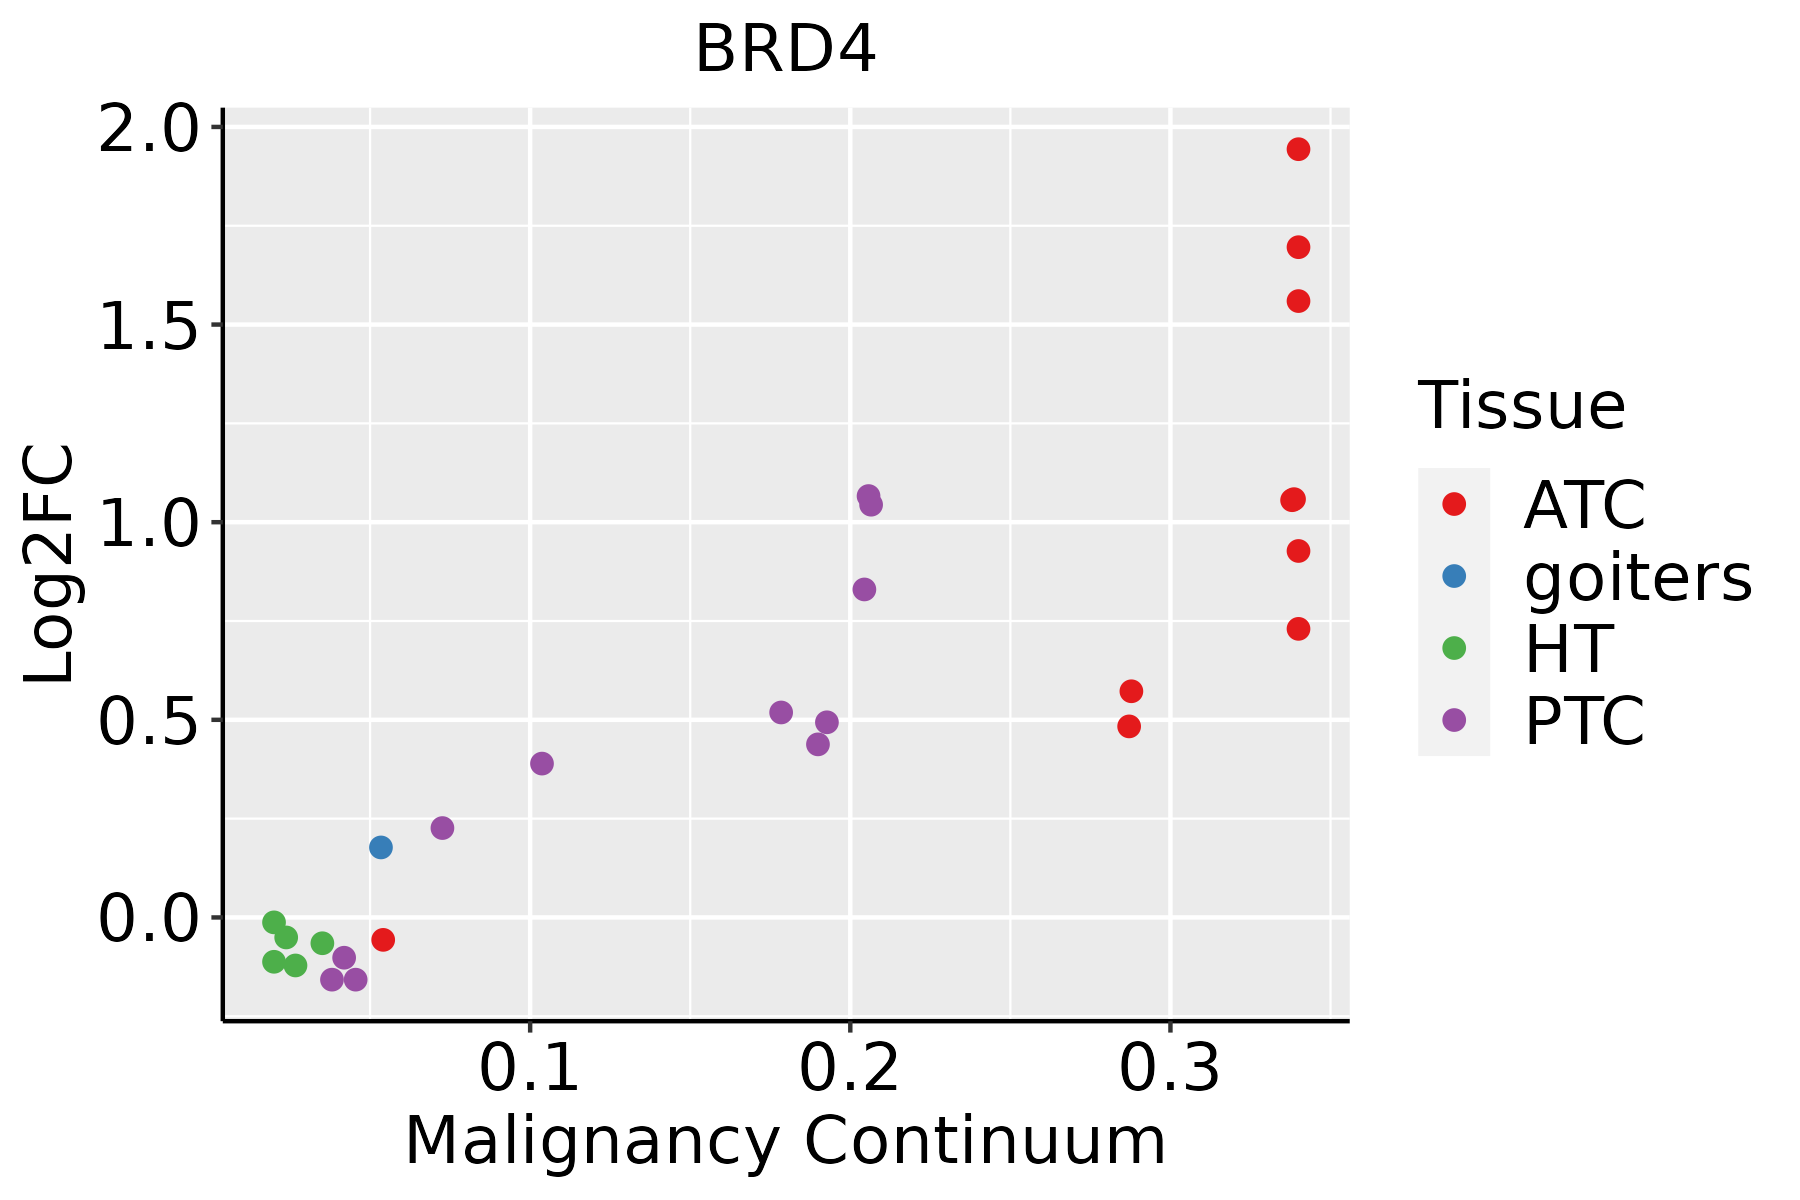 | ATC: Anaplastic thyroid cancer |
| HT: Hashimoto's thyroiditis | ||
| PTC: Papillary thyroid cancer |
| ∗log2FC in expression of this searched gene in stem-like cells from each diseased tissue sample relative to stem-like cells in normal samples in each tissue plotted against the malignancy continuum. Samples are colored based on if they are from different disease stage. |
Top |
Malignant transformation related pathway analysis |
| Find out the enriched GO biological processes and KEGG pathways involved in transition from healthy to precancer to cancer |
| Tissue | Disease Stage | Enriched GO biological Processes |
| Colorectum | AD |  |
| Colorectum | SER |  |
| Colorectum | MSS |  |
| Colorectum | MSI-H |  |
| Colorectum | FAP |  |
| ∗Top 15 enriched GO BP terms are showed in the bar plot of each disease state in each tissue. Each row represents a significant GO biological process which is colored according to the -log10(p.adjust). |
| Page: 1 2 3 4 5 6 7 8 9 |
| GO ID | Tissue | Disease Stage | Description | Gene Ratio | Bg Ratio | pvalue | p.adjust | Count |
| GO:000647916 | Thyroid | ATC | protein methylation | 85/6293 | 181/18723 | 1.27e-04 | 9.00e-04 | 85 |
| GO:000821316 | Thyroid | ATC | protein alkylation | 85/6293 | 181/18723 | 1.27e-04 | 9.00e-04 | 85 |
| GO:001038911 | Thyroid | ATC | regulation of G2/M transition of mitotic cell cycle | 49/6293 | 94/18723 | 1.60e-04 | 1.10e-03 | 49 |
| GO:003106015 | Thyroid | ATC | regulation of histone methylation | 38/6293 | 69/18723 | 1.97e-04 | 1.31e-03 | 38 |
| GO:003296814 | Thyroid | ATC | positive regulation of transcription elongation from RNA polymerase II promoter | 11/6293 | 13/18723 | 2.30e-04 | 1.49e-03 | 11 |
| GO:190274911 | Thyroid | ATC | regulation of cell cycle G2/M phase transition | 51/6293 | 102/18723 | 4.45e-04 | 2.64e-03 | 51 |
| GO:190198914 | Thyroid | ATC | positive regulation of cell cycle phase transition | 56/6293 | 115/18723 | 5.63e-04 | 3.25e-03 | 56 |
| GO:190199213 | Thyroid | ATC | positive regulation of mitotic cell cycle phase transition | 46/6293 | 93/18723 | 1.11e-03 | 5.85e-03 | 46 |
| GO:003496815 | Thyroid | ATC | histone lysine methylation | 54/6293 | 115/18723 | 2.00e-03 | 9.58e-03 | 54 |
| GO:004341412 | Thyroid | ATC | macromolecule methylation | 131/6293 | 316/18723 | 2.01e-03 | 9.60e-03 | 131 |
| GO:003225911 | Thyroid | ATC | methylation | 148/6293 | 364/18723 | 2.69e-03 | 1.23e-02 | 148 |
| Page: 1 2 3 4 5 6 7 8 9 10 11 12 13 14 15 16 17 18 19 20 21 22 23 24 |
| Pathway ID | Tissue | Disease Stage | Description | Gene Ratio | Bg Ratio | pvalue | p.adjust | qvalue | Count |
| Page: 1 |
Top |
Cell-cell communication analysis |
| Identification of potential cell-cell interactions between two cell types and their ligand-receptor pairs for different disease states |
| Ligand | Receptor | LRpair | Pathway | Tissue | Disease Stage |
| Page: 1 |
Top |
Single-cell gene regulatory network inference analysis |
| Find out the significant the regulons (TFs) and the target genes of each regulon across cell types for different disease states |
| TF | Cell Type | Tissue | Disease Stage | Target Gene | RSS | Regulon Activity |
| ∗The dot plots of a searched regulon are shown for all cell subpopulations in each disease state of each tissue based on the regulon specific score inferred using pySCENIC and by calculating the average expression. |
| Page: 1 |
Top |
Somatic mutation of malignant transformation related genes |
| Annotation of somatic variants for genes involved in malignant transformation |
| Hugo Symbol | Variant Class | Variant Classification | dbSNP RS | HGVSc | HGVSp | HGVSp Short | SWISSPROT | BIOTYPE | SIFT | PolyPhen | Tumor Sample Barcode | Tissue | Histology | Sex | Age | Stage | Therapy Types | Drugs | Outcome |
| BRD4 | SNV | Missense_Mutation | novel | c.2808N>T | p.Gln936His | p.Q936H | O60885 | protein_coding | tolerated(0.08) | benign(0) | TCGA-A2-A4RY-01 | Breast | breast invasive carcinoma | Female | <65 | III/IV | Chemotherapy | taxotere | CR |
| BRD4 | SNV | Missense_Mutation | rs761158744 | c.1638N>C | p.Lys546Asn | p.K546N | O60885 | protein_coding | tolerated(0.1) | probably_damaging(0.922) | TCGA-A7-A26H-01 | Breast | breast invasive carcinoma | Female | >=65 | I/II | Hormone Therapy | anastrozole | PD |
| BRD4 | SNV | Missense_Mutation | rs369254108 | c.44N>T | p.Pro15Leu | p.P15L | O60885 | protein_coding | deleterious_low_confidence(0.02) | possibly_damaging(0.656) | TCGA-AR-A1AX-01 | Breast | breast invasive carcinoma | Female | <65 | I/II | Chemotherapy | cytoxan | SD |
| BRD4 | SNV | Missense_Mutation | novel | c.1801T>A | p.Ser601Thr | p.S601T | O60885 | protein_coding | deleterious(0.03) | benign(0.262) | TCGA-E9-A1NC-01 | Breast | breast invasive carcinoma | Female | <65 | I/II | Chemotherapy | doxorubicin | CR |
| BRD4 | SNV | Missense_Mutation | c.3219N>C | p.Met1073Ile | p.M1073I | O60885 | protein_coding | tolerated_low_confidence(0.08) | benign(0) | TCGA-EW-A1PB-01 | Breast | breast invasive carcinoma | Female | >=65 | III/IV | Unknown | Unknown | SD | |
| BRD4 | insertion | In_Frame_Ins | novel | c.1798_1799insTCTGGGGCCTCTCTGCACCTTGTTGCCTGCAGCTGTGTTCTA | p.Glu600delinsValTrpGlyLeuSerAlaProCysCysLeuGlnLeuCysSerLys | p.E600delinsVWGLSAPCCLQLCSK | O60885 | protein_coding | TCGA-A8-A095-01 | Breast | breast invasive carcinoma | Female | <65 | I/II | Chemotherapy | 5-fluorouracil | CR | ||
| BRD4 | insertion | Frame_Shift_Ins | novel | c.3504_3505insACCAGTCCCCAGGCTGACTGGGACCCTCT | p.Ala1169ThrfsTer36 | p.A1169Tfs*36 | O60885 | protein_coding | TCGA-A8-A0A4-01 | Breast | breast invasive carcinoma | Female | >=65 | I/II | Hormone Therapy | tamoxiphen | CR | ||
| BRD4 | insertion | Nonsense_Mutation | novel | c.4055_4056insACATAGTTGGCATATCTTTGTTTGAAGTTTGTTGGTGGA | p.Ser1351_Asp1352insGluHisSerTrpHisIlePheValTerSerLeuLeuVal | p.S1351_D1352insEHSWHIFV*SLLV | O60885 | protein_coding | TCGA-B6-A0I8-01 | Breast | breast invasive carcinoma | Female | <65 | I/II | Unknown | Unknown | PD | ||
| BRD4 | insertion | In_Frame_Ins | novel | c.3737_3738insCACAATGGCACTGCTTATCTC | p.Glu1246delinsAspThrMetAlaLeuLeuIleSer | p.E1246delinsDTMALLIS | O60885 | protein_coding | TCGA-BH-A0H7-01 | Breast | breast invasive carcinoma | Female | >=65 | III/IV | Chemotherapy | doxorubicin | SD | ||
| BRD4 | SNV | Missense_Mutation | novel | c.3767N>A | p.Arg1256Gln | p.R1256Q | O60885 | protein_coding | tolerated(0.18) | benign(0.196) | TCGA-2W-A8YY-01 | Cervix | cervical & endocervical cancer | Female | <65 | I/II | Chemotherapy | cisplatin | CR |
| Page: 1 2 3 4 5 6 7 8 9 10 11 12 13 14 |
Top |
Related drugs of malignant transformation related genes |
| Identification of chemicals and drugs interact with genes involved in malignant transfromation |
| (DGIdb 4.0) |
| Entrez ID | Symbol | Category | Interaction Types | Drug Claim Name | Drug Name | PMIDs |
| 23476 | BRD4 | CLINICALLY ACTIONABLE, KINASE, SERINE THREONINE KINASE, ENZYME, DRUGGABLE GENOME | Aminocyclopentenone compound 1 | |||
| 23476 | BRD4 | CLINICALLY ACTIONABLE, KINASE, SERINE THREONINE KINASE, ENZYME, DRUGGABLE GENOME | inhibitor | 178102626 | ||
| 23476 | BRD4 | CLINICALLY ACTIONABLE, KINASE, SERINE THREONINE KINASE, ENZYME, DRUGGABLE GENOME | Aminocyclopentenone compound 6 | |||
| 23476 | BRD4 | CLINICALLY ACTIONABLE, KINASE, SERINE THREONINE KINASE, ENZYME, DRUGGABLE GENOME | inhibitor | 405067321 | ||
| 23476 | BRD4 | CLINICALLY ACTIONABLE, KINASE, SERINE THREONINE KINASE, ENZYME, DRUGGABLE GENOME | BIRABRESIB | BIRABRESIB | 26976114 | |
| 23476 | BRD4 | CLINICALLY ACTIONABLE, KINASE, SERINE THREONINE KINASE, ENZYME, DRUGGABLE GENOME | CPI-0610 | |||
| 23476 | BRD4 | CLINICALLY ACTIONABLE, KINASE, SERINE THREONINE KINASE, ENZYME, DRUGGABLE GENOME | RVX-208 | APABETALONE | ||
| 23476 | BRD4 | CLINICALLY ACTIONABLE, KINASE, SERINE THREONINE KINASE, ENZYME, DRUGGABLE GENOME | ALPRAZOLAM | ALPRAZOLAM | 22137933 | |
| 23476 | BRD4 | CLINICALLY ACTIONABLE, KINASE, SERINE THREONINE KINASE, ENZYME, DRUGGABLE GENOME | inhibitor | 187051820 | ||
| 23476 | BRD4 | CLINICALLY ACTIONABLE, KINASE, SERINE THREONINE KINASE, ENZYME, DRUGGABLE GENOME | inhibitor | 252166516 |
| Page: 1 2 3 4 5 6 7 8 9 |

Copyright 2023-Present -The University of Texas Health Science Center at Houston |