
|
|||||
|
 | |
| |
| |
| |
| |
| |
|
Gene: AXL |
Gene summary for AXL |
| Gene information | Species | Human | Gene symbol | AXL | Gene ID | 558 |
| Gene name | AXL receptor tyrosine kinase | |
| Gene Alias | ARK | |
| Cytomap | 19q13.2 | |
| Gene Type | protein-coding | GO ID | GO:0000003 | UniProtAcc | M0R0W6 |
Top |
Malignant transformation analysis |
| Identification of the aberrant gene expression in precancerous and cancerous lesions by comparing the gene expression of stem-like cells in diseased tissues with normal stem cells |
| Entrez ID | Symbol | Replicates | Species | Organ | Tissue | Adj P-value | Log2FC | Malignancy |
| 558 | AXL | LZE6T | Human | Esophagus | ESCC | 4.24e-02 | 2.95e-01 | 0.0845 |
| 558 | AXL | P2T-E | Human | Esophagus | ESCC | 3.40e-13 | 9.01e-02 | 0.1177 |
| 558 | AXL | P8T-E | Human | Esophagus | ESCC | 1.16e-06 | 1.49e-01 | 0.0889 |
| 558 | AXL | P11T-E | Human | Esophagus | ESCC | 2.83e-05 | 3.59e-01 | 0.1426 |
| 558 | AXL | P12T-E | Human | Esophagus | ESCC | 2.46e-10 | 1.62e-01 | 0.1122 |
| 558 | AXL | P17T-E | Human | Esophagus | ESCC | 9.69e-03 | 2.99e-01 | 0.1278 |
| 558 | AXL | P21T-E | Human | Esophagus | ESCC | 5.53e-08 | 1.06e-01 | 0.1617 |
| 558 | AXL | P24T-E | Human | Esophagus | ESCC | 6.45e-05 | 1.35e-01 | 0.1287 |
| 558 | AXL | P26T-E | Human | Esophagus | ESCC | 5.47e-11 | 1.96e-01 | 0.1276 |
| 558 | AXL | P31T-E | Human | Esophagus | ESCC | 5.43e-04 | 4.54e-02 | 0.1251 |
| 558 | AXL | P32T-E | Human | Esophagus | ESCC | 4.84e-12 | 2.87e-01 | 0.1666 |
| 558 | AXL | P37T-E | Human | Esophagus | ESCC | 9.46e-17 | 3.86e-01 | 0.1371 |
| 558 | AXL | P44T-E | Human | Esophagus | ESCC | 1.70e-10 | 3.28e-01 | 0.1096 |
| 558 | AXL | P61T-E | Human | Esophagus | ESCC | 2.13e-08 | 2.14e-01 | 0.099 |
| 558 | AXL | P74T-E | Human | Esophagus | ESCC | 9.96e-04 | 1.40e-01 | 0.1479 |
| 558 | AXL | P76T-E | Human | Esophagus | ESCC | 7.70e-10 | 2.32e-01 | 0.1207 |
| 558 | AXL | P79T-E | Human | Esophagus | ESCC | 8.26e-10 | 1.98e-01 | 0.1154 |
| 558 | AXL | P82T-E | Human | Esophagus | ESCC | 1.70e-03 | 5.62e-01 | 0.1072 |
| 558 | AXL | P83T-E | Human | Esophagus | ESCC | 5.44e-04 | 2.12e-01 | 0.1738 |
| 558 | AXL | P130T-E | Human | Esophagus | ESCC | 8.78e-22 | 5.29e-01 | 0.1676 |
| Page: 1 2 3 4 |
| Tissue | Expression Dynamics | Abbreviation |
| Esophagus |  | ESCC: Esophageal squamous cell carcinoma |
| HGIN: High-grade intraepithelial neoplasias | ||
| LGIN: Low-grade intraepithelial neoplasias | ||
| Oral Cavity | 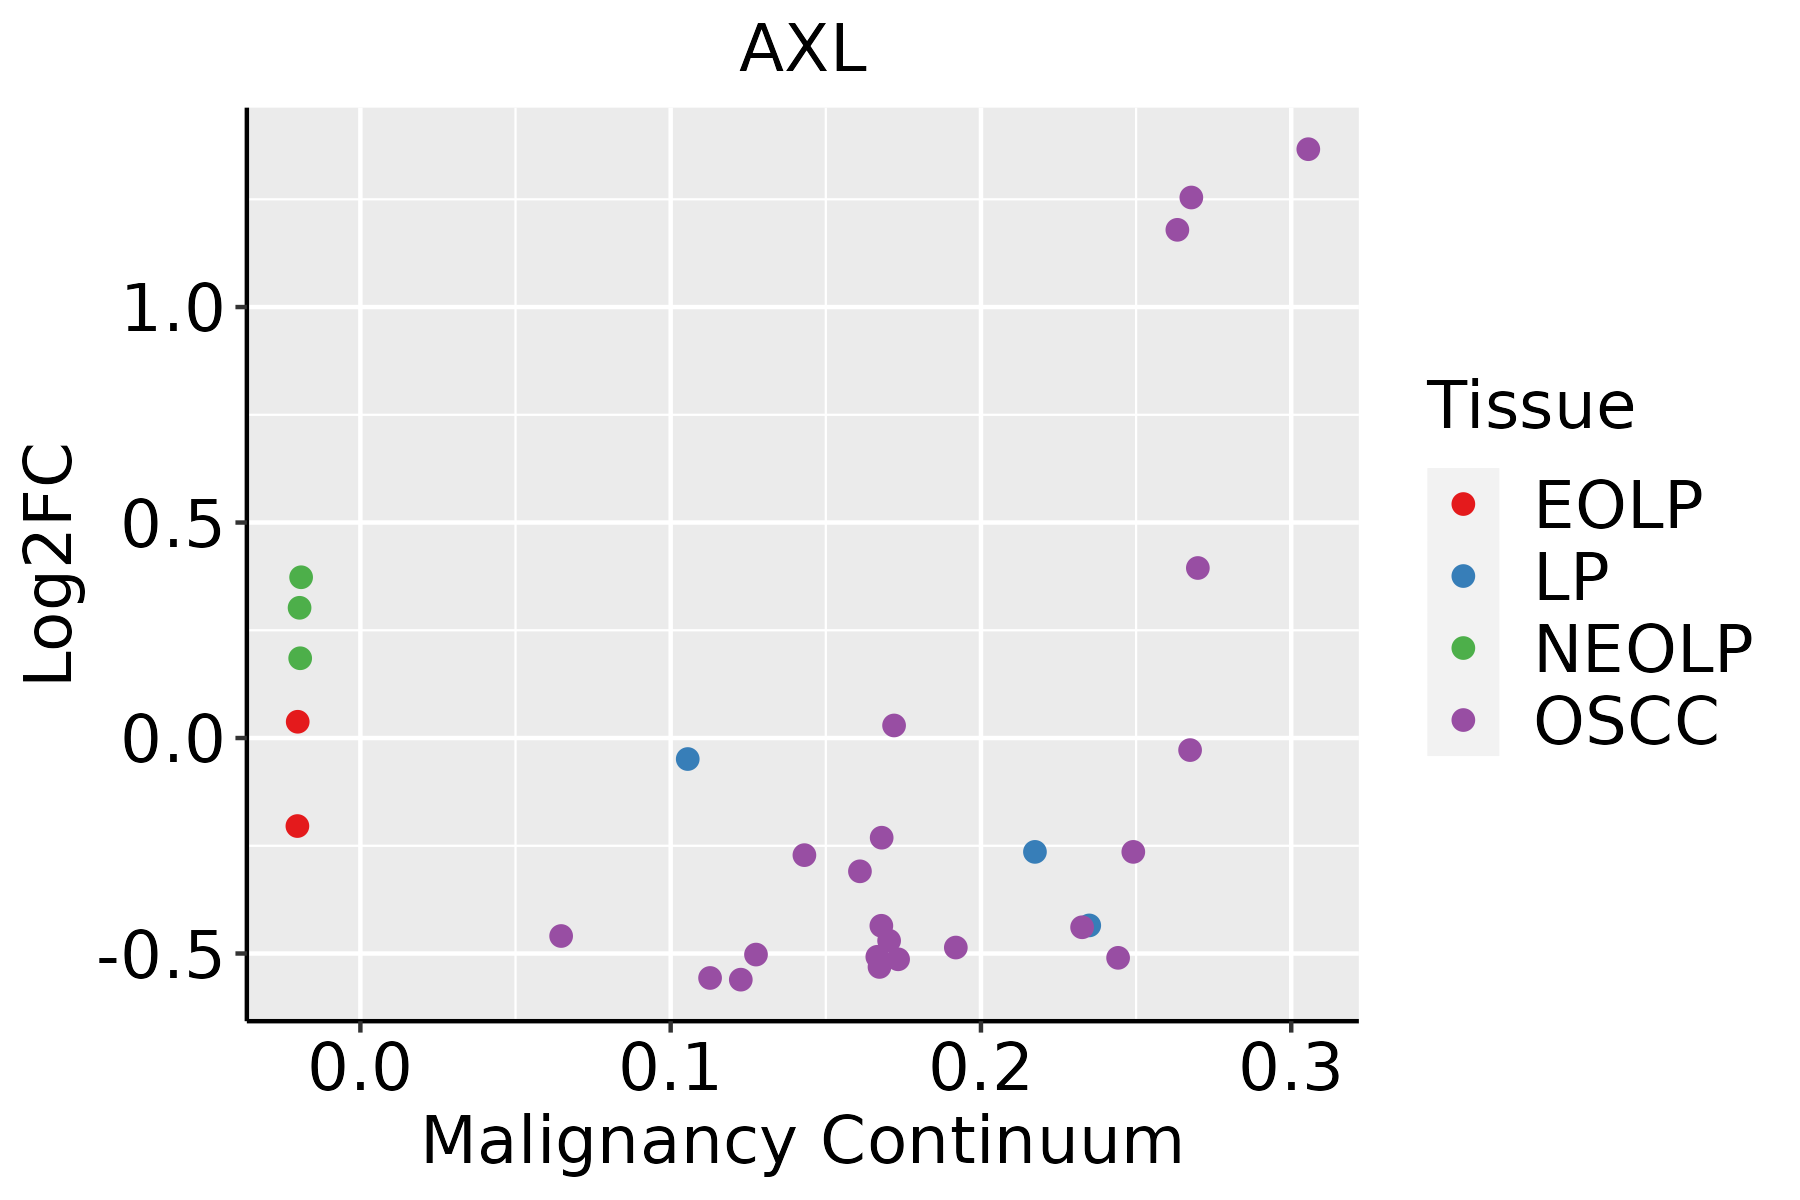 | EOLP: Erosive Oral lichen planus |
| LP: leukoplakia | ||
| NEOLP: Non-erosive oral lichen planus | ||
| OSCC: Oral squamous cell carcinoma | ||
| Prostate | 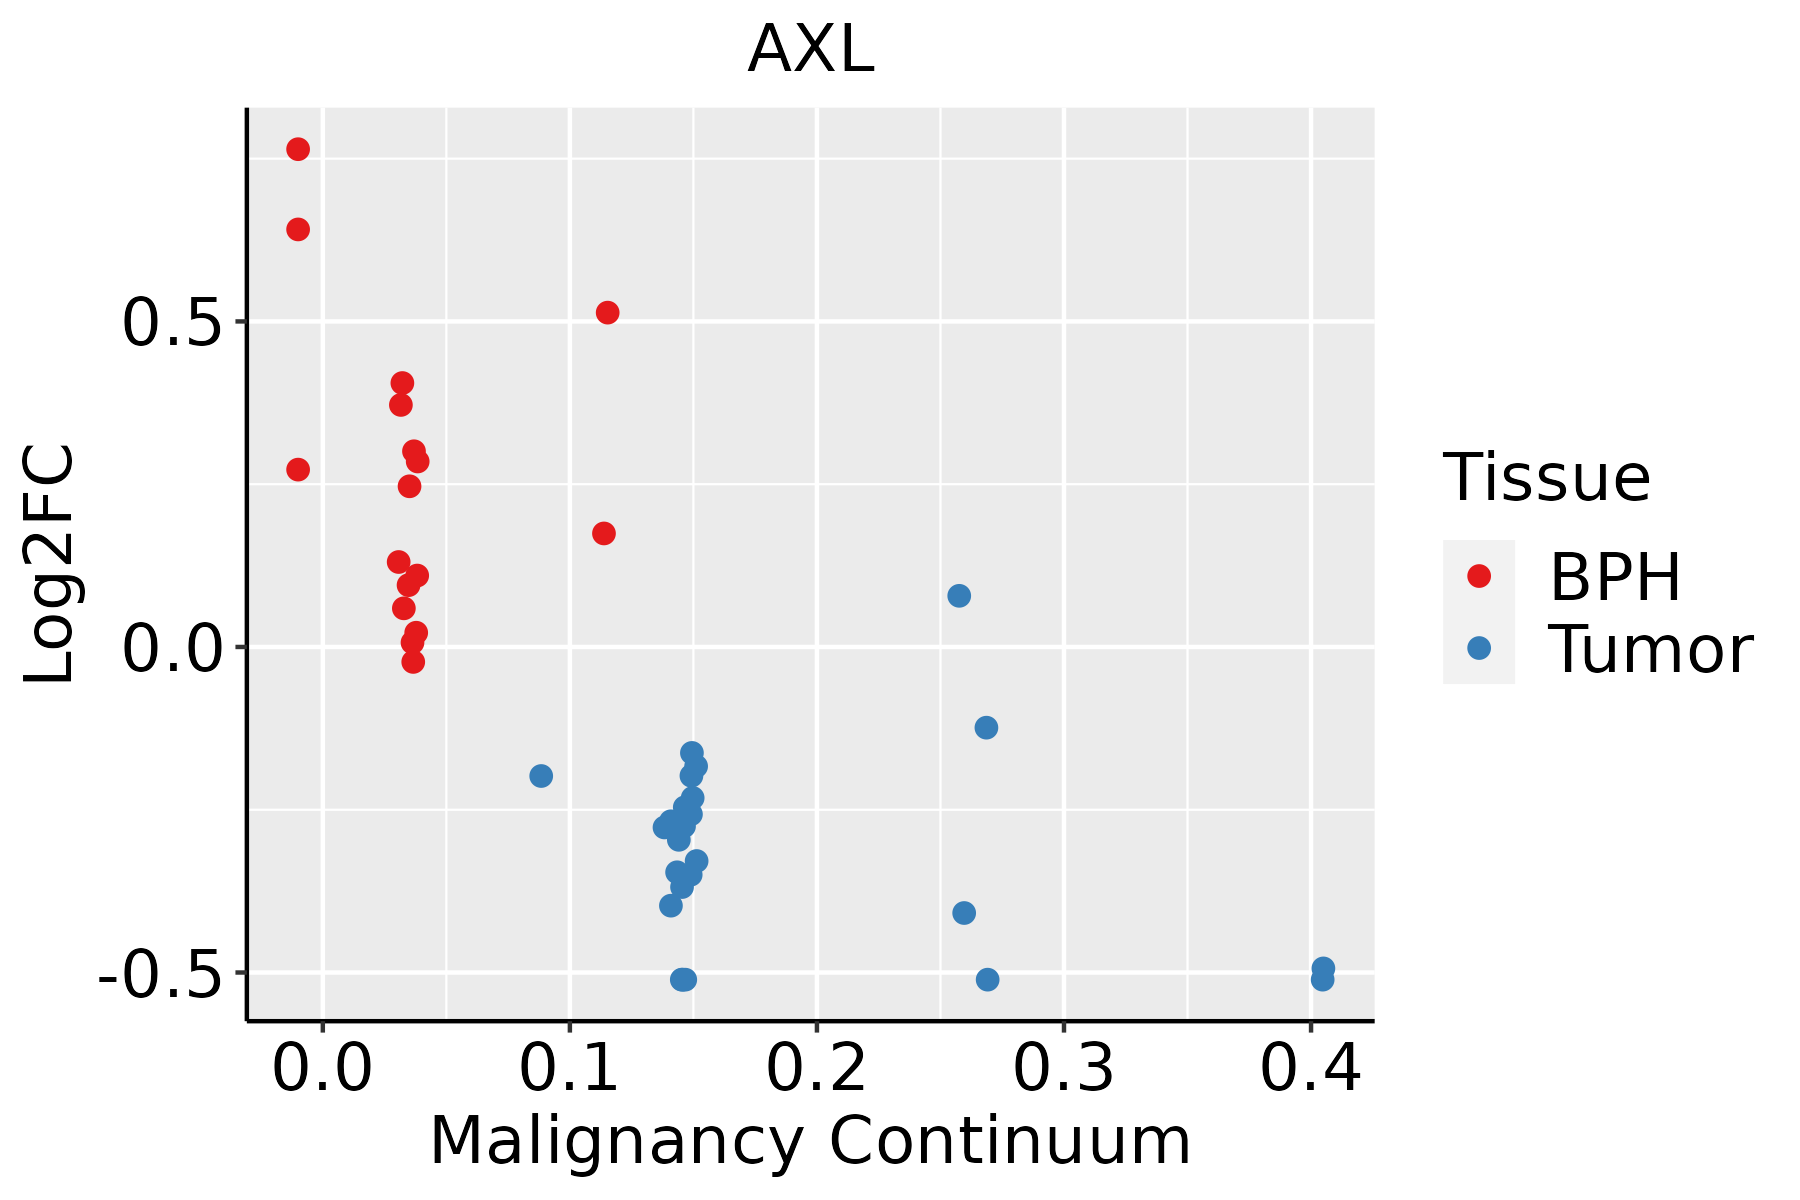 | BPH: Benign Prostatic Hyperplasia |
| Thyroid | 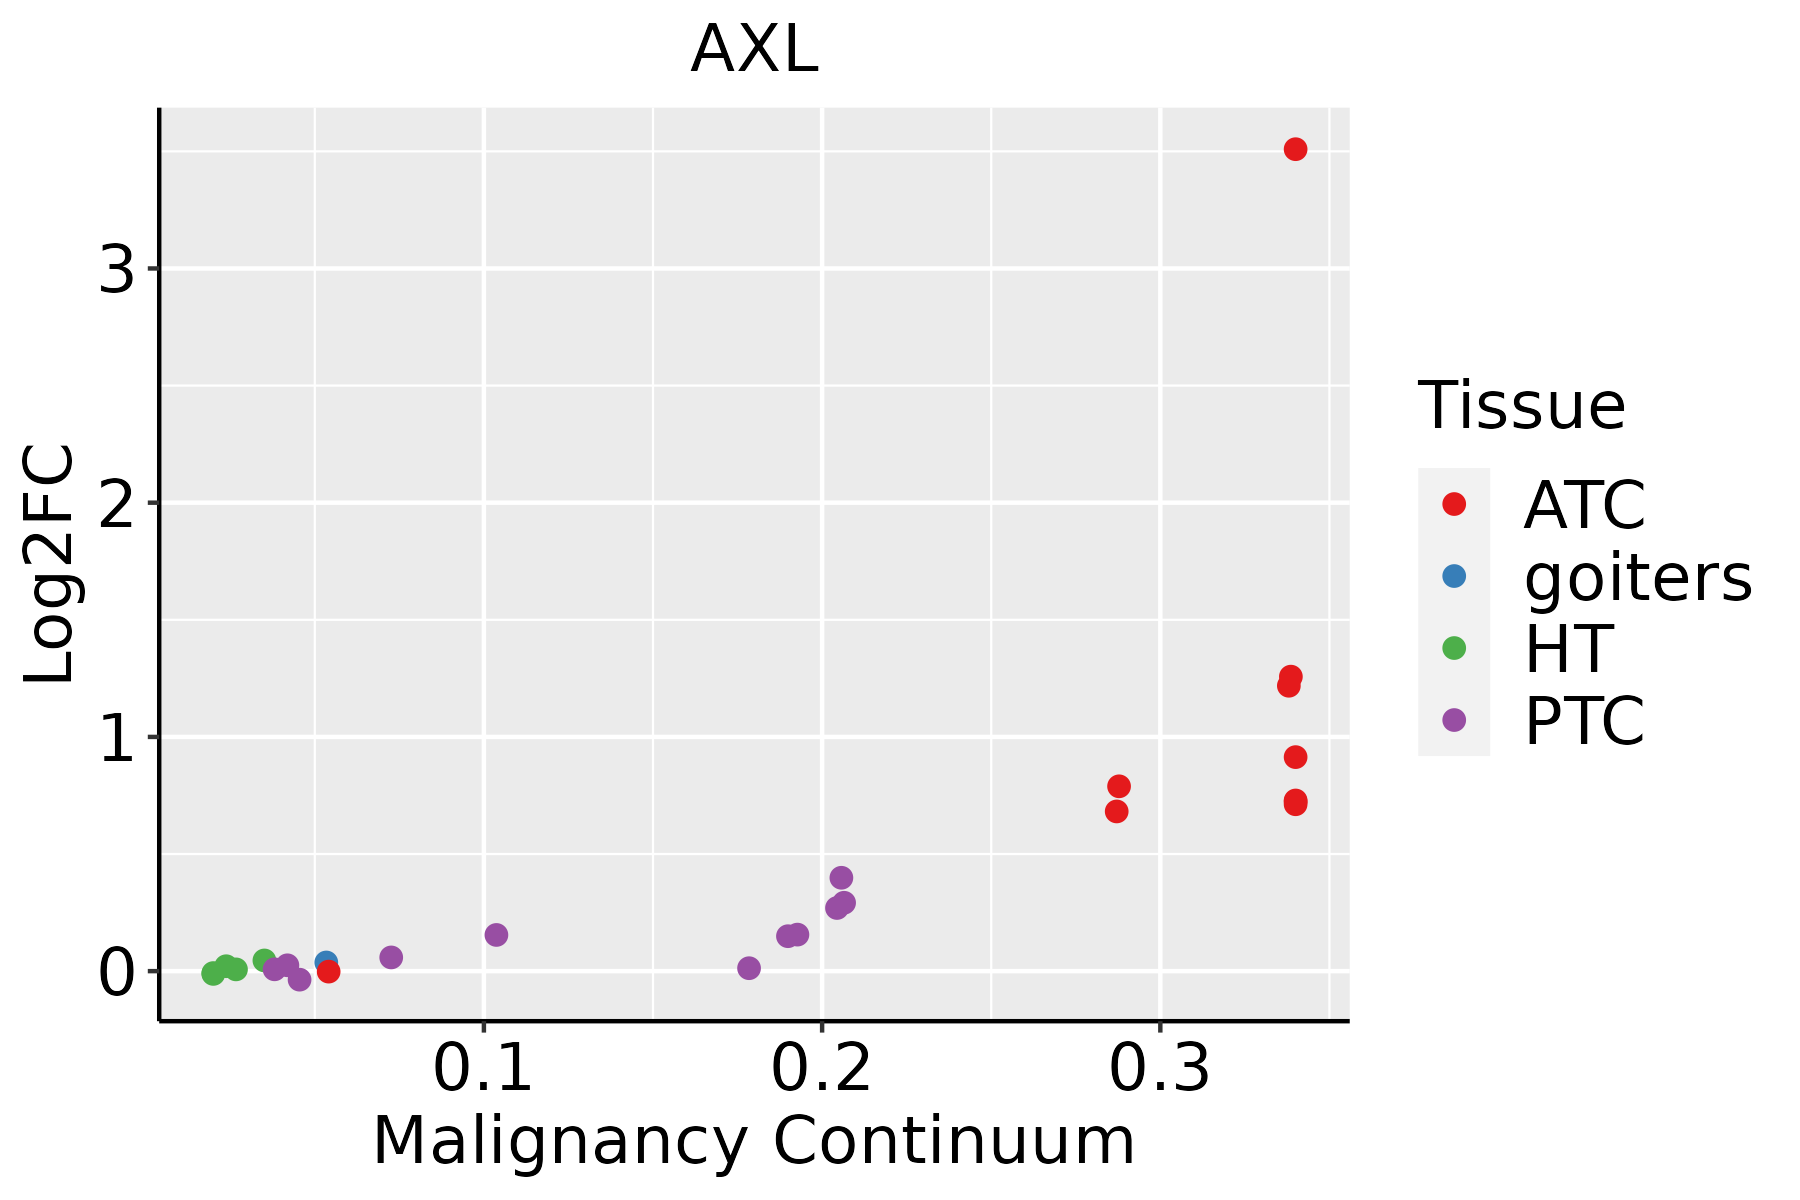 | ATC: Anaplastic thyroid cancer |
| HT: Hashimoto's thyroiditis | ||
| PTC: Papillary thyroid cancer |
| ∗log2FC in expression of this searched gene in stem-like cells from each diseased tissue sample relative to stem-like cells in normal samples in each tissue plotted against the malignancy continuum. Samples are colored based on if they are from different disease stage. |
Top |
Malignant transformation related pathway analysis |
| Find out the enriched GO biological processes and KEGG pathways involved in transition from healthy to precancer to cancer |
| Tissue | Disease Stage | Enriched GO biological Processes |
| Colorectum | AD |  |
| Colorectum | SER |  |
| Colorectum | MSS |  |
| Colorectum | MSI-H |  |
| Colorectum | FAP |  |
| ∗Top 15 enriched GO BP terms are showed in the bar plot of each disease state in each tissue. Each row represents a significant GO biological process which is colored according to the -log10(p.adjust). |
| Page: 1 2 3 4 5 6 7 8 9 |
| GO ID | Tissue | Disease Stage | Description | Gene Ratio | Bg Ratio | pvalue | p.adjust | Count |
| GO:006219734 | Thyroid | ATC | cellular response to chemical stress | 188/6293 | 337/18723 | 3.16e-17 | 3.07e-15 | 188 |
| GO:003158928 | Thyroid | ATC | cell-substrate adhesion | 195/6293 | 363/18723 | 1.58e-15 | 1.17e-13 | 195 |
| GO:001905835 | Thyroid | ATC | viral life cycle | 173/6293 | 317/18723 | 9.22e-15 | 5.50e-13 | 173 |
| GO:003459934 | Thyroid | ATC | cellular response to oxidative stress | 158/6293 | 288/18723 | 7.35e-14 | 3.94e-12 | 158 |
| GO:000030234 | Thyroid | ATC | response to reactive oxygen species | 128/6293 | 222/18723 | 1.38e-13 | 7.00e-12 | 128 |
| GO:004254233 | Thyroid | ATC | response to hydrogen peroxide | 92/6293 | 146/18723 | 3.12e-13 | 1.46e-11 | 92 |
| GO:004206034 | Thyroid | ATC | wound healing | 210/6293 | 422/18723 | 3.33e-12 | 1.37e-10 | 210 |
| GO:004440334 | Thyroid | ATC | biological process involved in symbiotic interaction | 153/6293 | 290/18723 | 1.12e-11 | 4.12e-10 | 153 |
| GO:0071496210 | Thyroid | ATC | cellular response to external stimulus | 165/6293 | 320/18723 | 2.01e-11 | 7.23e-10 | 165 |
| GO:005170134 | Thyroid | ATC | biological process involved in interaction with host | 112/6293 | 203/18723 | 1.93e-10 | 5.76e-09 | 112 |
| GO:0070997210 | Thyroid | ATC | neuron death | 176/6293 | 361/18723 | 1.43e-09 | 3.57e-08 | 176 |
| GO:0030100111 | Thyroid | ATC | regulation of endocytosis | 113/6293 | 211/18723 | 1.71e-09 | 4.22e-08 | 113 |
| GO:003461433 | Thyroid | ATC | cellular response to reactive oxygen species | 87/6293 | 155/18723 | 6.54e-09 | 1.43e-07 | 87 |
| GO:190121428 | Thyroid | ATC | regulation of neuron death | 156/6293 | 319/18723 | 9.30e-09 | 1.96e-07 | 156 |
| GO:005079228 | Thyroid | ATC | regulation of viral process | 90/6293 | 164/18723 | 1.61e-08 | 3.23e-07 | 90 |
| GO:003166827 | Thyroid | ATC | cellular response to extracellular stimulus | 125/6293 | 246/18723 | 1.65e-08 | 3.31e-07 | 125 |
| GO:0045807111 | Thyroid | ATC | positive regulation of endocytosis | 61/6293 | 100/18723 | 1.80e-08 | 3.59e-07 | 61 |
| GO:004852424 | Thyroid | ATC | positive regulation of viral process | 44/6293 | 65/18723 | 2.00e-08 | 3.93e-07 | 44 |
| GO:0048872210 | Thyroid | ATC | homeostasis of number of cells | 135/6293 | 272/18723 | 2.92e-08 | 5.50e-07 | 135 |
| GO:005212633 | Thyroid | ATC | movement in host environment | 94/6293 | 175/18723 | 3.20e-08 | 6.00e-07 | 94 |
| Page: 1 2 3 4 5 6 7 8 9 10 11 12 13 14 15 16 17 18 19 20 21 22 23 24 25 26 |
| Pathway ID | Tissue | Disease Stage | Description | Gene Ratio | Bg Ratio | pvalue | p.adjust | qvalue | Count |
| hsa0152110 | Esophagus | ESCC | EGFR tyrosine kinase inhibitor resistance | 55/4205 | 79/8465 | 2.44e-04 | 8.78e-04 | 4.50e-04 | 55 |
| hsa0152115 | Esophagus | ESCC | EGFR tyrosine kinase inhibitor resistance | 55/4205 | 79/8465 | 2.44e-04 | 8.78e-04 | 4.50e-04 | 55 |
| hsa015219 | Oral cavity | OSCC | EGFR tyrosine kinase inhibitor resistance | 54/3704 | 79/8465 | 8.11e-06 | 3.72e-05 | 1.89e-05 | 54 |
| hsa0152114 | Oral cavity | OSCC | EGFR tyrosine kinase inhibitor resistance | 54/3704 | 79/8465 | 8.11e-06 | 3.72e-05 | 1.89e-05 | 54 |
| hsa0152142 | Oral cavity | NEOLP | EGFR tyrosine kinase inhibitor resistance | 20/1112 | 79/8465 | 2.47e-03 | 1.03e-02 | 6.49e-03 | 20 |
| hsa0152152 | Oral cavity | NEOLP | EGFR tyrosine kinase inhibitor resistance | 20/1112 | 79/8465 | 2.47e-03 | 1.03e-02 | 6.49e-03 | 20 |
| hsa015218 | Prostate | BPH | EGFR tyrosine kinase inhibitor resistance | 30/1718 | 79/8465 | 2.10e-04 | 1.13e-03 | 6.98e-04 | 30 |
| hsa0152113 | Prostate | BPH | EGFR tyrosine kinase inhibitor resistance | 30/1718 | 79/8465 | 2.10e-04 | 1.13e-03 | 6.98e-04 | 30 |
| Page: 1 |
Top |
Cell-cell communication analysis |
| Identification of potential cell-cell interactions between two cell types and their ligand-receptor pairs for different disease states |
| Ligand | Receptor | LRpair | Pathway | Tissue | Disease Stage |
| GAS6 | AXL | GAS6_AXL | GAS | Breast | ADJ |
| PROS1 | AXL | PROS1_AXL | PROS | Breast | ADJ |
| GAS6 | AXL | GAS6_AXL | GAS | Breast | DCIS |
| PROS1 | AXL | PROS1_AXL | PROS | Breast | DCIS |
| GAS6 | AXL | GAS6_AXL | GAS | Breast | Healthy |
| PROS1 | AXL | PROS1_AXL | PROS | Breast | Healthy |
| GAS6 | AXL | GAS6_AXL | GAS | Breast | IDC |
| GAS6 | AXL | GAS6_AXL | GAS | Breast | Precancer |
| GAS6 | AXL | GAS6_AXL | GAS | Cervix | ADJ |
| PROS1 | AXL | PROS1_AXL | PROS | Cervix | ADJ |
| GAS6 | AXL | GAS6_AXL | GAS | Cervix | CC |
| PROS1 | AXL | PROS1_AXL | PROS | Cervix | CC |
| GAS6 | AXL | GAS6_AXL | GAS | Cervix | Healthy |
| PROS1 | AXL | PROS1_AXL | PROS | Cervix | Healthy |
| GAS6 | AXL | GAS6_AXL | GAS | Cervix | Precancer |
| GAS6 | AXL | GAS6_AXL | GAS | CRC | AD |
| GAS6 | AXL | GAS6_AXL | GAS | CRC | ADJ |
| GAS6 | AXL | GAS6_AXL | GAS | CRC | CRC |
| GAS6 | AXL | GAS6_AXL | GAS | CRC | MSI-H |
| GAS6 | AXL | GAS6_AXL | GAS | CRC | MSS |
| Page: 1 |
Top |
Single-cell gene regulatory network inference analysis |
| Find out the significant the regulons (TFs) and the target genes of each regulon across cell types for different disease states |
| TF | Cell Type | Tissue | Disease Stage | Target Gene | RSS | Regulon Activity |
| ∗The dot plots of a searched regulon are shown for all cell subpopulations in each disease state of each tissue based on the regulon specific score inferred using pySCENIC and by calculating the average expression. |
| Page: 1 |
Top |
Somatic mutation of malignant transformation related genes |
| Annotation of somatic variants for genes involved in malignant transformation |
| Hugo Symbol | Variant Class | Variant Classification | dbSNP RS | HGVSc | HGVSp | HGVSp Short | SWISSPROT | BIOTYPE | SIFT | PolyPhen | Tumor Sample Barcode | Tissue | Histology | Sex | Age | Stage | Therapy Types | Drugs | Outcome |
| AXL | SNV | Missense_Mutation | rs144824336 | c.1498N>A | p.Val500Met | p.V500M | P30530 | protein_coding | deleterious(0) | possibly_damaging(0.835) | TCGA-A7-A4SE-01 | Breast | breast invasive carcinoma | Female | <65 | I/II | Chemotherapy | adriamycin | CR |
| AXL | SNV | Missense_Mutation | rs756510536 | c.1906N>T | p.Arg636Trp | p.R636W | P30530 | protein_coding | deleterious(0.02) | benign(0.098) | TCGA-AC-A8OQ-01 | Breast | breast invasive carcinoma | Female | >=65 | I/II | Unknown | Unknown | SD |
| AXL | SNV | Missense_Mutation | novel | c.1100N>G | p.Tyr367Cys | p.Y367C | P30530 | protein_coding | deleterious(0) | probably_damaging(0.978) | TCGA-AN-A0AK-01 | Breast | breast invasive carcinoma | Female | >=65 | I/II | Unknown | Unknown | SD |
| AXL | SNV | Missense_Mutation | rs374699228 | c.818N>T | p.Ala273Val | p.A273V | P30530 | protein_coding | tolerated(0.27) | benign(0.005) | TCGA-AR-A0U2-01 | Breast | breast invasive carcinoma | Female | <65 | III/IV | Hormone Therapy | tamoxiphen | PD |
| AXL | SNV | Missense_Mutation | rs751738506 | c.883N>T | p.Arg295Trp | p.R295W | P30530 | protein_coding | tolerated(0.17) | possibly_damaging(0.88) | TCGA-D8-A27R-01 | Breast | breast invasive carcinoma | Female | <65 | III/IV | Chemotherapy | adriamycin+cyclophosphamide | SD |
| AXL | SNV | Missense_Mutation | c.598A>G | p.Thr200Ala | p.T200A | P30530 | protein_coding | tolerated(0.13) | benign(0.054) | TCGA-E9-A22E-01 | Breast | breast invasive carcinoma | Female | <65 | III/IV | Chemotherapy | cyclophosphane | SD | |
| AXL | insertion | Frame_Shift_Ins | rs778012871 | c.867_868insC | p.His292ProfsTer47 | p.H292Pfs*47 | P30530 | protein_coding | TCGA-BH-A1FD-01 | Breast | breast invasive carcinoma | Female | >=65 | I/II | Unknown | Unknown | PD | ||
| AXL | insertion | Frame_Shift_Ins | rs778012871 | c.867_868insC | p.His292ProfsTer47 | p.H292Pfs*47 | P30530 | protein_coding | TCGA-E9-A1NI-01 | Breast | breast invasive carcinoma | Female | <65 | I/II | Chemotherapy | doxorubicin | CR | ||
| AXL | SNV | Missense_Mutation | novel | c.226N>A | p.Leu76Met | p.L76M | P30530 | protein_coding | deleterious(0.02) | possibly_damaging(0.744) | TCGA-DS-A1OB-01 | Cervix | cervical & endocervical cancer | Female | <65 | I/II | Chemotherapy | carboplatin | PD |
| AXL | SNV | Missense_Mutation | c.1279N>T | p.Arg427Cys | p.R427C | P30530 | protein_coding | tolerated(0.06) | possibly_damaging(0.66) | TCGA-FU-A3HZ-01 | Cervix | cervical & endocervical cancer | Female | <65 | I/II | Chemotherapy | cisplatin | CR |
| Page: 1 2 3 4 5 6 7 8 9 10 11 12 |
Top |
Related drugs of malignant transformation related genes |
| Identification of chemicals and drugs interact with genes involved in malignant transfromation |
| (DGIdb 4.0) |
| Entrez ID | Symbol | Category | Interaction Types | Drug Claim Name | Drug Name | PMIDs |
| 558 | AXL | CLINICALLY ACTIONABLE, DRUGGABLE GENOME, ENZYME, KINASE, TYROSINE KINASE, CELL SURFACE | DASATINIB | DASATINIB | ||
| 558 | AXL | CLINICALLY ACTIONABLE, DRUGGABLE GENOME, ENZYME, KINASE, TYROSINE KINASE, CELL SURFACE | PF-562271 | PF-00562271 | ||
| 558 | AXL | CLINICALLY ACTIONABLE, DRUGGABLE GENOME, ENZYME, KINASE, TYROSINE KINASE, CELL SURFACE | inhibitor | 363894214 | SITRAVATINIB | |
| 558 | AXL | CLINICALLY ACTIONABLE, DRUGGABLE GENOME, ENZYME, KINASE, TYROSINE KINASE, CELL SURFACE | inhibitor | 404859021 | ||
| 558 | AXL | CLINICALLY ACTIONABLE, DRUGGABLE GENOME, ENZYME, KINASE, TYROSINE KINASE, CELL SURFACE | inhibitor | HESPERADIN | HESPERADIN | 19035792 |
| 558 | AXL | CLINICALLY ACTIONABLE, DRUGGABLE GENOME, ENZYME, KINASE, TYROSINE KINASE, CELL SURFACE | inhibitor | 363894135 | MERESTINIB | |
| 558 | AXL | CLINICALLY ACTIONABLE, DRUGGABLE GENOME, ENZYME, KINASE, TYROSINE KINASE, CELL SURFACE | XL999 | |||
| 558 | AXL | CLINICALLY ACTIONABLE, DRUGGABLE GENOME, ENZYME, KINASE, TYROSINE KINASE, CELL SURFACE | Gilteritinib | GILTERITINIB | ||
| 558 | AXL | CLINICALLY ACTIONABLE, DRUGGABLE GENOME, ENZYME, KINASE, TYROSINE KINASE, CELL SURFACE | inhibitor | 252827520 | DUBERMATINIB | |
| 558 | AXL | CLINICALLY ACTIONABLE, DRUGGABLE GENOME, ENZYME, KINASE, TYROSINE KINASE, CELL SURFACE | BI-505 | BI-505 |
| Page: 1 2 3 4 5 |

Copyright 2023-Present -The University of Texas Health Science Center at Houston |