| Tissue | Expression Dynamics | Abbreviation |
| Cervix | 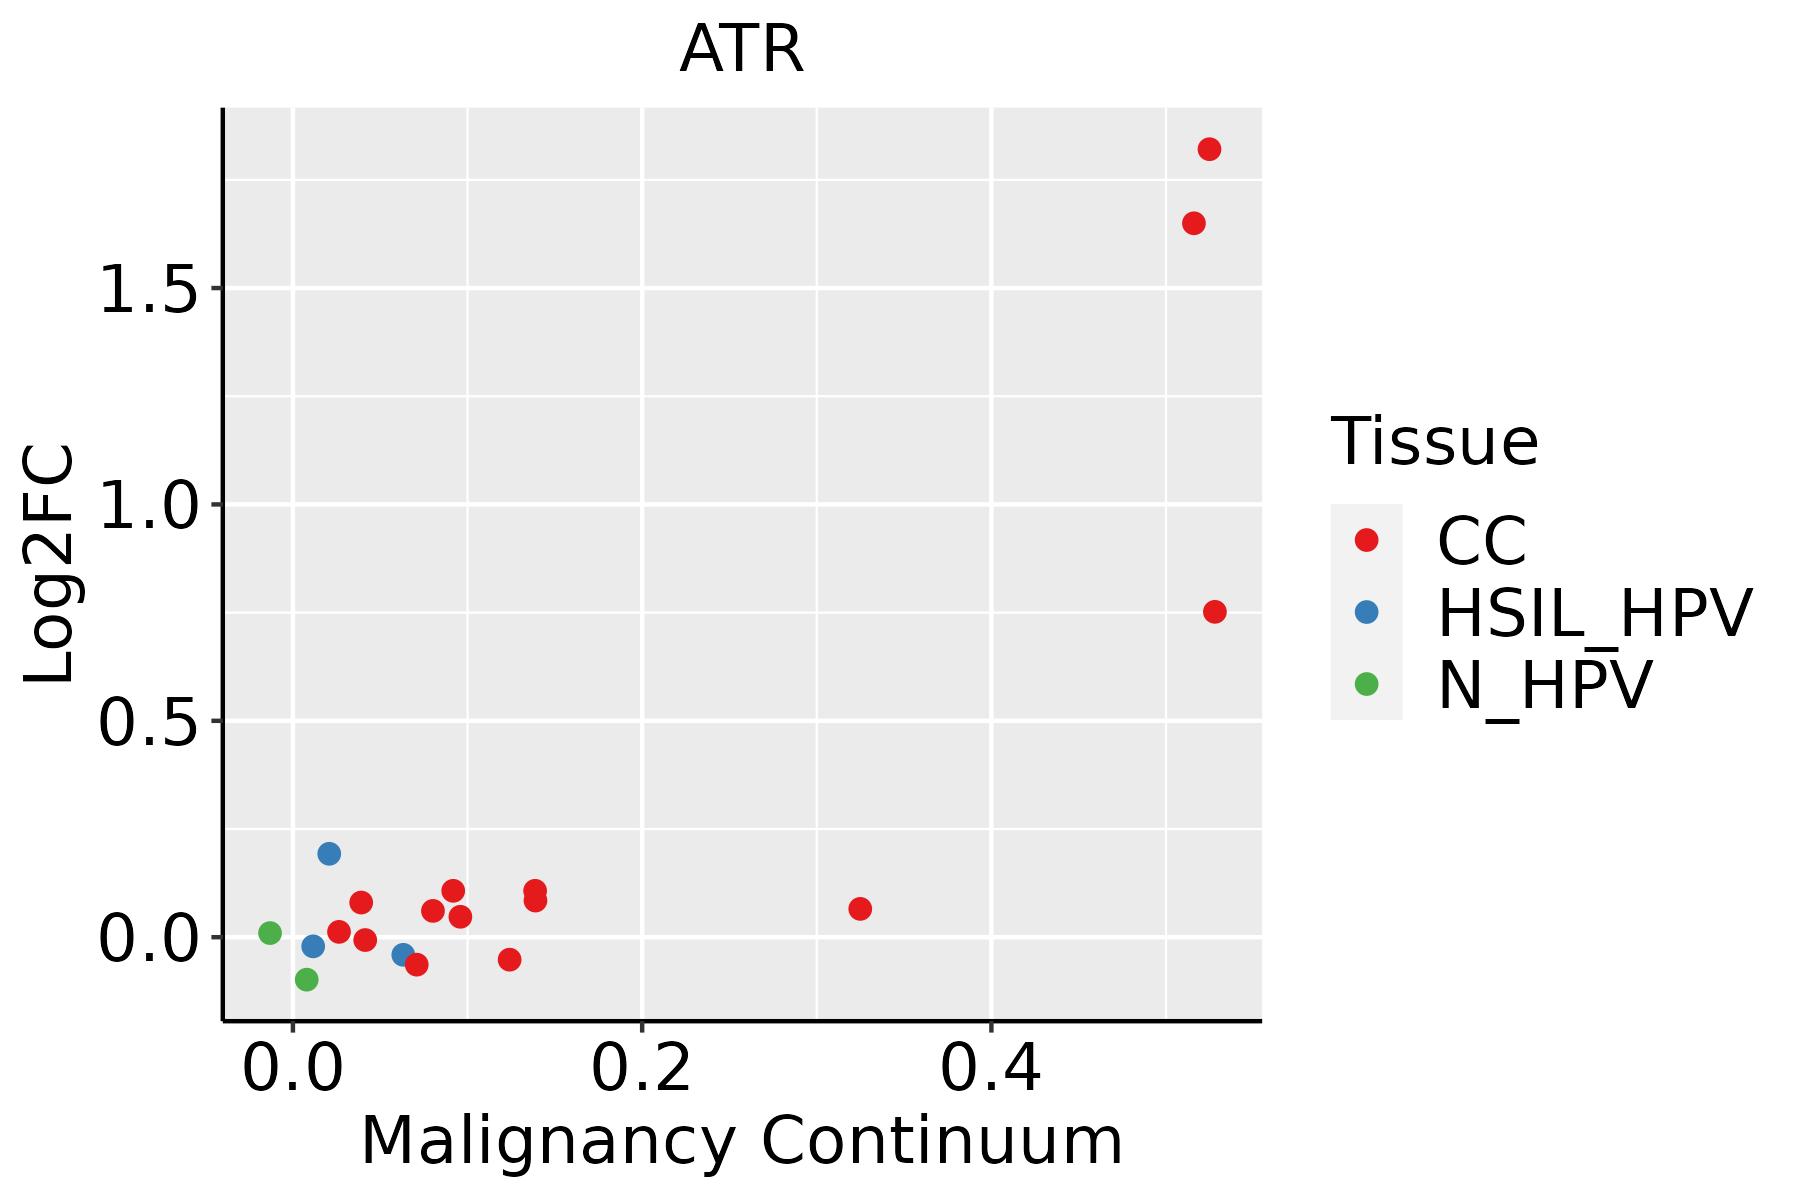 | CC: Cervix cancer |
| HSIL_HPV: HPV-infected high-grade squamous intraepithelial lesions |
| N_HPV: HPV-infected normal cervix |
| Colorectum (GSE201348) |  | FAP: Familial adenomatous polyposis |
| CRC: Colorectal cancer |
| Colorectum (HTA11) |  | AD: Adenomas |
| SER: Sessile serrated lesions |
| MSI-H: Microsatellite-high colorectal cancer |
| MSS: Microsatellite stable colorectal cancer |
| Esophagus | 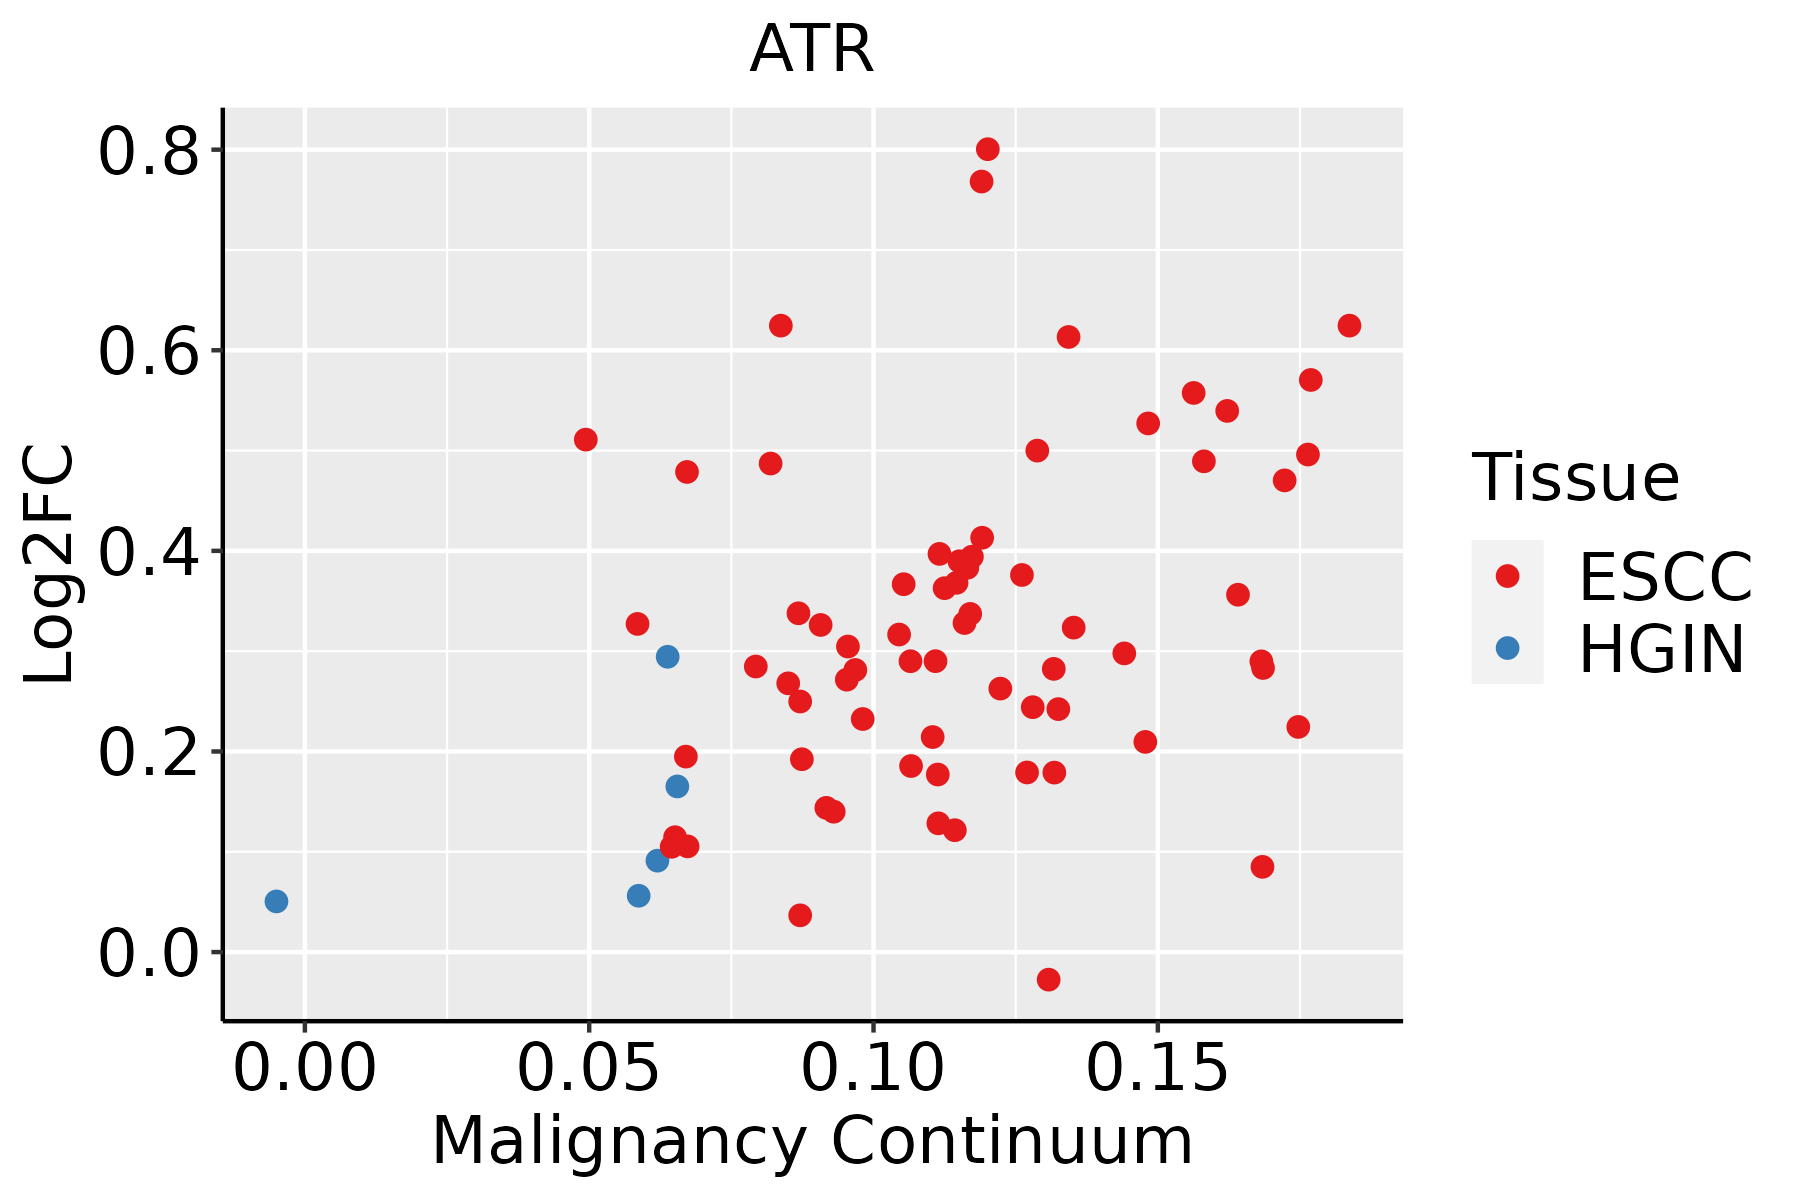 | ESCC: Esophageal squamous cell carcinoma |
| HGIN: High-grade intraepithelial neoplasias |
| LGIN: Low-grade intraepithelial neoplasias |
| Liver | 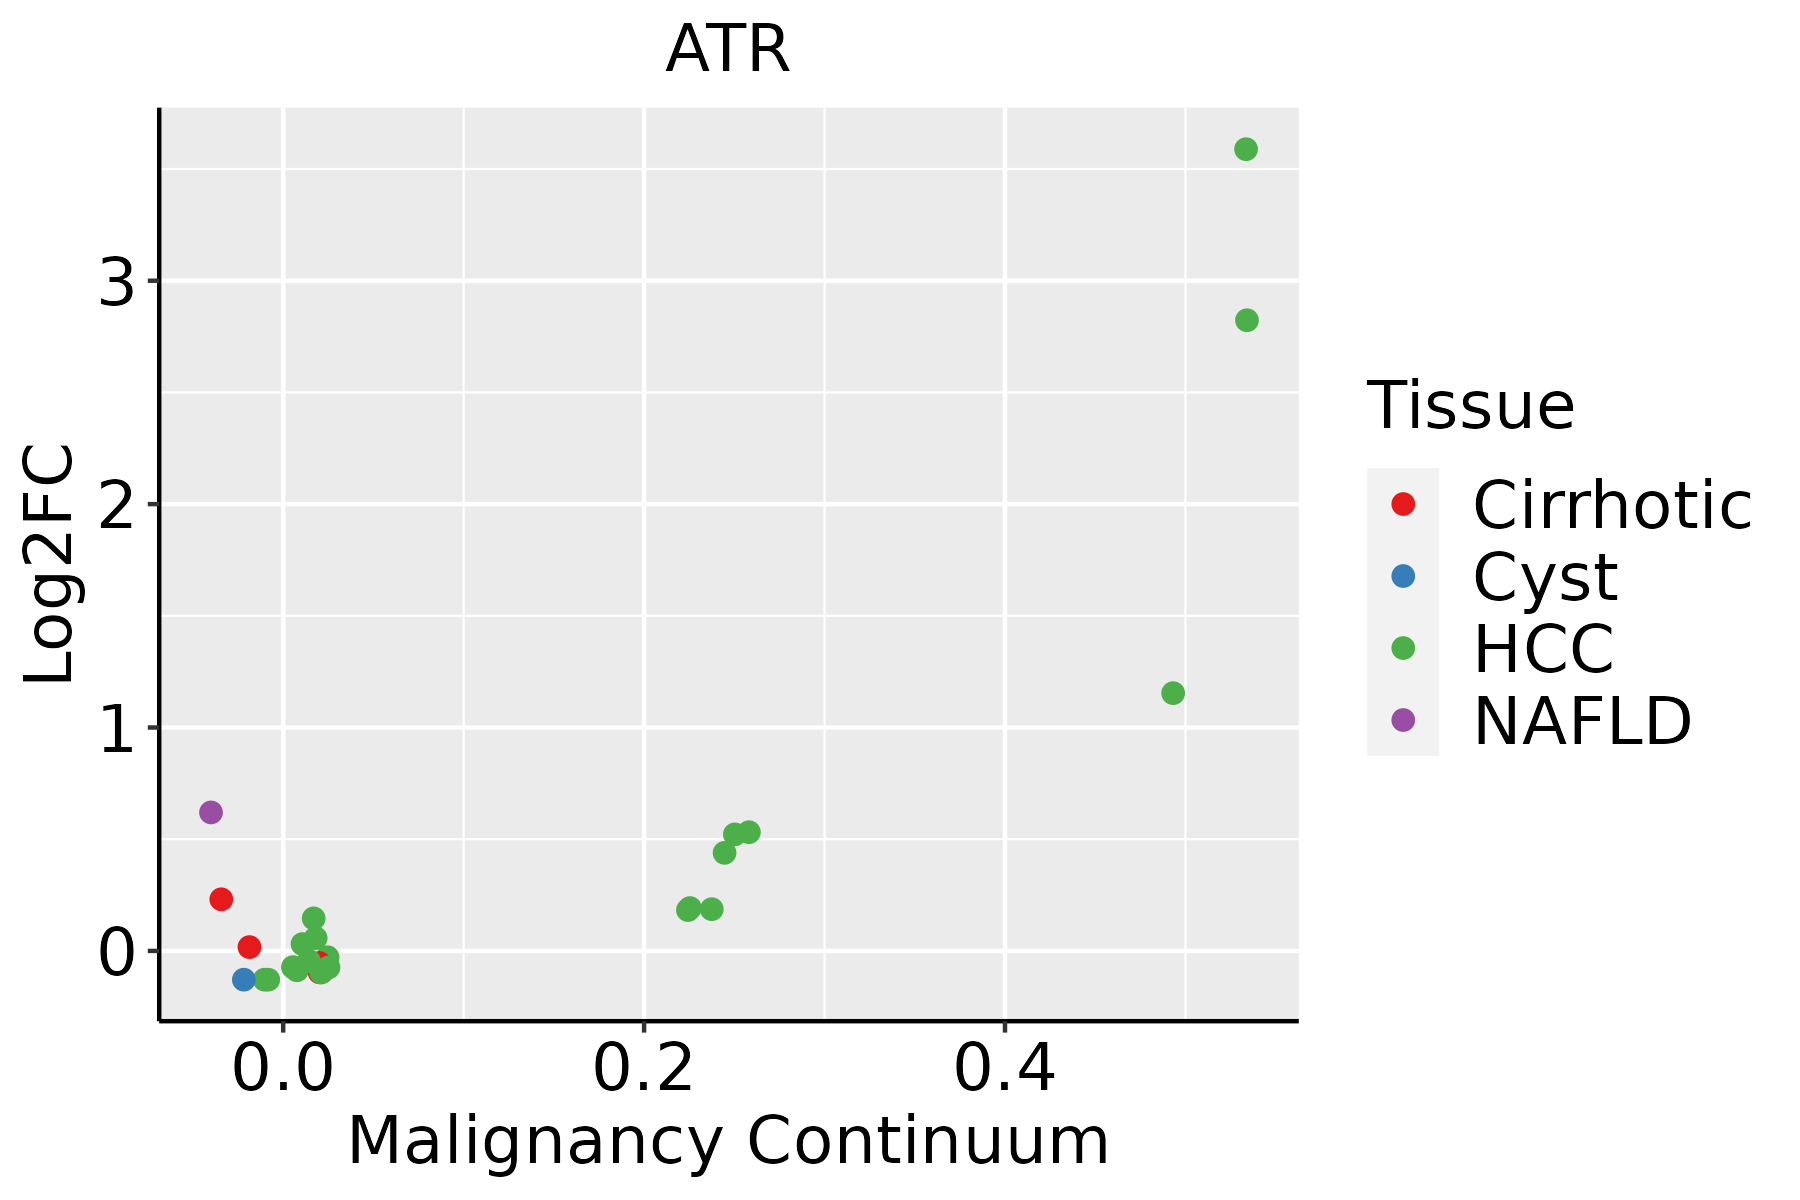 | HCC: Hepatocellular carcinoma |
| NAFLD: Non-alcoholic fatty liver disease |
| Lung |  | AAH: Atypical adenomatous hyperplasia |
| AIS: Adenocarcinoma in situ |
| IAC: Invasive lung adenocarcinoma |
| MIA: Minimally invasive adenocarcinoma |
| GO ID | Tissue | Disease Stage | Description | Gene Ratio | Bg Ratio | pvalue | p.adjust | Count |
| GO:0006364110 | Esophagus | ESCC | rRNA processing | 189/8552 | 225/18723 | 4.88e-33 | 3.87e-30 | 189 |
| GO:003466012 | Esophagus | ESCC | ncRNA metabolic process | 346/8552 | 485/18723 | 4.35e-31 | 2.51e-28 | 346 |
| GO:0006403110 | Esophagus | ESCC | RNA localization | 166/8552 | 201/18723 | 1.95e-27 | 6.18e-25 | 166 |
| GO:001657015 | Esophagus | ESCC | histone modification | 323/8552 | 463/18723 | 2.61e-26 | 7.88e-24 | 323 |
| GO:014001414 | Esophagus | ESCC | mitotic nuclear division | 218/8552 | 287/18723 | 6.17e-26 | 1.78e-23 | 218 |
| GO:0042176111 | Esophagus | ESCC | regulation of protein catabolic process | 280/8552 | 391/18723 | 8.65e-26 | 2.39e-23 | 280 |
| GO:000007011 | Esophagus | ESCC | mitotic sister chromatid segregation | 138/8552 | 168/18723 | 1.37e-22 | 2.63e-20 | 138 |
| GO:0006979111 | Esophagus | ESCC | response to oxidative stress | 303/8552 | 446/18723 | 7.15e-22 | 1.30e-19 | 303 |
| GO:00008194 | Esophagus | ESCC | sister chromatid segregation | 157/8552 | 202/18723 | 8.41e-21 | 1.33e-18 | 157 |
| GO:005123617 | Esophagus | ESCC | establishment of RNA localization | 134/8552 | 166/18723 | 1.23e-20 | 1.81e-18 | 134 |
| GO:001820514 | Esophagus | ESCC | peptidyl-lysine modification | 259/8552 | 376/18723 | 3.90e-20 | 5.26e-18 | 259 |
| GO:1903362111 | Esophagus | ESCC | regulation of cellular protein catabolic process | 188/8552 | 255/18723 | 5.12e-20 | 6.62e-18 | 188 |
| GO:003304416 | Esophagus | ESCC | regulation of chromosome organization | 145/8552 | 187/18723 | 3.80e-19 | 4.31e-17 | 145 |
| GO:000705911 | Esophagus | ESCC | chromosome segregation | 238/8552 | 346/18723 | 1.72e-18 | 1.82e-16 | 238 |
| GO:001619715 | Esophagus | ESCC | endosomal transport | 168/8552 | 230/18723 | 2.28e-17 | 1.93e-15 | 168 |
| GO:0071826111 | Esophagus | ESCC | ribonucleoprotein complex subunit organization | 166/8552 | 227/18723 | 2.94e-17 | 2.42e-15 | 166 |
| GO:0042274111 | Esophagus | ESCC | ribosomal small subunit biogenesis | 67/8552 | 73/18723 | 6.62e-17 | 5.38e-15 | 67 |
| GO:0043254111 | Esophagus | ESCC | regulation of protein-containing complex assembly | 278/8552 | 428/18723 | 3.81e-16 | 2.77e-14 | 278 |
| GO:0022618111 | Esophagus | ESCC | ribonucleoprotein complex assembly | 159/8552 | 220/18723 | 8.19e-16 | 5.71e-14 | 159 |
| GO:000941113 | Esophagus | ESCC | response to UV | 115/8552 | 149/18723 | 3.29e-15 | 1.93e-13 | 115 |
| Pathway ID | Tissue | Disease Stage | Description | Gene Ratio | Bg Ratio | pvalue | p.adjust | qvalue | Count |
| hsa0421810 | Cervix | CC | Cellular senescence | 49/1267 | 156/8465 | 1.30e-07 | 1.63e-06 | 9.61e-07 | 49 |
| hsa0516620 | Cervix | CC | Human T-cell leukemia virus 1 infection | 61/1267 | 222/8465 | 8.13e-07 | 7.98e-06 | 4.72e-06 | 61 |
| hsa0517016 | Cervix | CC | Human immunodeficiency virus 1 infection | 55/1267 | 212/8465 | 1.80e-05 | 1.42e-04 | 8.40e-05 | 55 |
| hsa051657 | Cervix | CC | Human papillomavirus infection | 74/1267 | 331/8465 | 1.70e-04 | 1.02e-03 | 6.03e-04 | 74 |
| hsa041106 | Cervix | CC | Cell cycle | 36/1267 | 157/8465 | 4.94e-03 | 1.67e-02 | 9.86e-03 | 36 |
| hsa0421815 | Cervix | CC | Cellular senescence | 49/1267 | 156/8465 | 1.30e-07 | 1.63e-06 | 9.61e-07 | 49 |
| hsa05166110 | Cervix | CC | Human T-cell leukemia virus 1 infection | 61/1267 | 222/8465 | 8.13e-07 | 7.98e-06 | 4.72e-06 | 61 |
| hsa0517017 | Cervix | CC | Human immunodeficiency virus 1 infection | 55/1267 | 212/8465 | 1.80e-05 | 1.42e-04 | 8.40e-05 | 55 |
| hsa0516512 | Cervix | CC | Human papillomavirus infection | 74/1267 | 331/8465 | 1.70e-04 | 1.02e-03 | 6.03e-04 | 74 |
| hsa0411013 | Cervix | CC | Cell cycle | 36/1267 | 157/8465 | 4.94e-03 | 1.67e-02 | 9.86e-03 | 36 |
| hsa05170 | Colorectum | AD | Human immunodeficiency virus 1 infection | 72/2092 | 212/8465 | 1.40e-03 | 8.46e-03 | 5.39e-03 | 72 |
| hsa05166 | Colorectum | AD | Human T-cell leukemia virus 1 infection | 72/2092 | 222/8465 | 5.24e-03 | 2.44e-02 | 1.55e-02 | 72 |
| hsa051701 | Colorectum | AD | Human immunodeficiency virus 1 infection | 72/2092 | 212/8465 | 1.40e-03 | 8.46e-03 | 5.39e-03 | 72 |
| hsa051661 | Colorectum | AD | Human T-cell leukemia virus 1 infection | 72/2092 | 222/8465 | 5.24e-03 | 2.44e-02 | 1.55e-02 | 72 |
| hsa051702 | Colorectum | SER | Human immunodeficiency virus 1 infection | 58/1580 | 212/8465 | 1.08e-03 | 8.56e-03 | 6.21e-03 | 58 |
| hsa051703 | Colorectum | SER | Human immunodeficiency virus 1 infection | 58/1580 | 212/8465 | 1.08e-03 | 8.56e-03 | 6.21e-03 | 58 |
| hsa051704 | Colorectum | MSS | Human immunodeficiency virus 1 infection | 69/1875 | 212/8465 | 2.66e-04 | 1.98e-03 | 1.21e-03 | 69 |
| hsa042182 | Colorectum | MSS | Cellular senescence | 52/1875 | 156/8465 | 7.87e-04 | 5.07e-03 | 3.11e-03 | 52 |
| hsa051662 | Colorectum | MSS | Human T-cell leukemia virus 1 infection | 68/1875 | 222/8465 | 1.84e-03 | 9.61e-03 | 5.89e-03 | 68 |
| hsa051705 | Colorectum | MSS | Human immunodeficiency virus 1 infection | 69/1875 | 212/8465 | 2.66e-04 | 1.98e-03 | 1.21e-03 | 69 |
| Hugo Symbol | Variant Class | Variant Classification | dbSNP RS | HGVSc | HGVSp | HGVSp Short | SWISSPROT | BIOTYPE | SIFT | PolyPhen | Tumor Sample Barcode | Tissue | Histology | Sex | Age | Stage | Therapy Types | Drugs | Outcome |
| ATR | SNV | Missense_Mutation | novel | c.6307G>A | p.Glu2103Lys | p.E2103K | Q13535 | protein_coding | deleterious(0.01) | benign(0.075) | TCGA-5L-AAT0-01 | Breast | breast invasive carcinoma | Female | <65 | I/II | Hormone Therapy | tamoxiphen | SD |
| ATR | SNV | Missense_Mutation | novel | c.5518G>C | p.Glu1840Gln | p.E1840Q | Q13535 | protein_coding | deleterious(0) | probably_damaging(0.993) | TCGA-5L-AAT0-01 | Breast | breast invasive carcinoma | Female | <65 | I/II | Hormone Therapy | tamoxiphen | SD |
| ATR | SNV | Missense_Mutation | rs762196224 | c.7724N>T | p.Ala2575Val | p.A2575V | Q13535 | protein_coding | tolerated(0.07) | benign(0.304) | TCGA-A2-A04W-01 | Breast | breast invasive carcinoma | Female | <65 | I/II | Chemotherapy | cytoxan | SD |
| ATR | SNV | Missense_Mutation | | c.6400G>T | p.Ala2134Ser | p.A2134S | Q13535 | protein_coding | tolerated(0.12) | benign(0.021) | TCGA-A8-A09Z-01 | Breast | breast invasive carcinoma | Female | >=65 | I/II | Unknown | Unknown | SD |
| ATR | SNV | Missense_Mutation | | c.2246N>G | p.Ser749Cys | p.S749C | Q13535 | protein_coding | tolerated(0.11) | benign(0.001) | TCGA-AC-A23H-01 | Breast | breast invasive carcinoma | Female | >=65 | I/II | Unknown | Unknown | PD |
| ATR | SNV | Missense_Mutation | rs746049210 | c.7219N>T | p.Arg2407Cys | p.R2407C | Q13535 | protein_coding | deleterious(0) | probably_damaging(0.943) | TCGA-AN-A046-01 | Breast | breast invasive carcinoma | Female | >=65 | I/II | Unknown | Unknown | SD |
| ATR | SNV | Missense_Mutation | rs780802796 | c.3548N>A | p.Arg1183Gln | p.R1183Q | Q13535 | protein_coding | tolerated(0.11) | possibly_damaging(0.688) | TCGA-AN-A046-01 | Breast | breast invasive carcinoma | Female | >=65 | I/II | Unknown | Unknown | SD |
| ATR | SNV | Missense_Mutation | rs369309229 | c.6196N>T | p.Arg2066Trp | p.R2066W | Q13535 | protein_coding | tolerated(0.08) | probably_damaging(0.939) | TCGA-AO-A128-01 | Breast | breast invasive carcinoma | Female | <65 | I/II | Chemotherapy | doxorubicin | SD |
| ATR | SNV | Missense_Mutation | | c.226N>C | p.Met76Leu | p.M76L | Q13535 | protein_coding | tolerated_low_confidence(0.05) | benign(0.01) | TCGA-C8-A1HJ-01 | Breast | breast invasive carcinoma | Female | <65 | I/II | Unknown | Unknown | SD |
| ATR | SNV | Missense_Mutation | novel | c.4627N>C | p.Glu1543Gln | p.E1543Q | Q13535 | protein_coding | tolerated(0.11) | possibly_damaging(0.743) | TCGA-C8-A8HP-01 | Breast | breast invasive carcinoma | Female | <65 | III/IV | Chemotherapy | 5-fluorouracil | CR |
| Entrez ID | Symbol | Category | Interaction Types | Drug Claim Name | Drug Name | PMIDs |
| 545 | ATR | SERINE THREONINE KINASE, DNA REPAIR, CLINICALLY ACTIONABLE, ENZYME, KINASE, DRUGGABLE GENOME, PHOSPHATIDYLINOSITOL 3 KINASE | | M4344 | | |
| 545 | ATR | SERINE THREONINE KINASE, DNA REPAIR, CLINICALLY ACTIONABLE, ENZYME, KINASE, DRUGGABLE GENOME, PHOSPHATIDYLINOSITOL 3 KINASE | | E7449 | 2X-121 | |
| 545 | ATR | SERINE THREONINE KINASE, DNA REPAIR, CLINICALLY ACTIONABLE, ENZYME, KINASE, DRUGGABLE GENOME, PHOSPHATIDYLINOSITOL 3 KINASE | inhibitor | 384403635 | | |
| 545 | ATR | SERINE THREONINE KINASE, DNA REPAIR, CLINICALLY ACTIONABLE, ENZYME, KINASE, DRUGGABLE GENOME, PHOSPHATIDYLINOSITOL 3 KINASE | inhibitor | CHEMBL3545178 | CERALASERTIB | |
| 545 | ATR | SERINE THREONINE KINASE, DNA REPAIR, CLINICALLY ACTIONABLE, ENZYME, KINASE, DRUGGABLE GENOME, PHOSPHATIDYLINOSITOL 3 KINASE | inhibitor | 328083492 | CERALASERTIB | |
| 545 | ATR | SERINE THREONINE KINASE, DNA REPAIR, CLINICALLY ACTIONABLE, ENZYME, KINASE, DRUGGABLE GENOME, PHOSPHATIDYLINOSITOL 3 KINASE | inhibitor | 249565722 | | |
| 545 | ATR | SERINE THREONINE KINASE, DNA REPAIR, CLINICALLY ACTIONABLE, ENZYME, KINASE, DRUGGABLE GENOME, PHOSPHATIDYLINOSITOL 3 KINASE | | CISPLATIN | CISPLATIN | 12894503 |
| 545 | ATR | SERINE THREONINE KINASE, DNA REPAIR, CLINICALLY ACTIONABLE, ENZYME, KINASE, DRUGGABLE GENOME, PHOSPHATIDYLINOSITOL 3 KINASE | inhibitor | 249565633 | DACTOLISIB | |
| 545 | ATR | SERINE THREONINE KINASE, DNA REPAIR, CLINICALLY ACTIONABLE, ENZYME, KINASE, DRUGGABLE GENOME, PHOSPHATIDYLINOSITOL 3 KINASE | | BMN673 | | |
| 545 | ATR | SERINE THREONINE KINASE, DNA REPAIR, CLINICALLY ACTIONABLE, ENZYME, KINASE, DRUGGABLE GENOME, PHOSPHATIDYLINOSITOL 3 KINASE | inhibitor | 252166686 | | |


