Schematic overview of the cellular and molecular mechanisms involved in the cancer progression, including the proposed cellular and molecular mechanisms in cancer cells trajectory. AT1: alveolar type 1 cells; AT2: alveolar type 2 cells; AAH: atypical adenomatous hyperplasia; AIS: adenocarcinoma in situ; MIA: minimally invasive adenocarcinoma; IA: invasive adenocarcinoma; EMT: epithelial-mesenchymal transition

Home

Download

Statistics

Help

Contact

Center for Computational Systems Medicine
leaf

Gene summary

leaf

Malignant transformation analysis

leaf

Malignant transformation related pathway analysis

leaf

Cell-cell communication analysis

leaf

Single-cell gene regulatory network inference analysis

leaf

Somatic mutation of malignant transformation related genes

leaf

Related drugs of malignant transformation related genes

Gene: TRIOBP

Gene summary for TRIOBP

check button Gene summary.

Gene informationSpeciesHuman
Gene symbol

TRIOBP

Gene ID

11078

Gene nameTRIO and F-actin binding protein
Gene AliasDFNB28
Cytomap22q13.1
Gene Typeprotein-coding
GO ID

GO:0000902

UniProtAcc

Q9H2D6


Top

Malignant transformation analysis

check button Identification of the aberrant gene expression in precancerous and cancerous lesions by comparing the gene expression of stem-like cells in diseased tissues with normal stem cells
check button Malignant transformation involving gene list.
Entrez IDSymbolReplicatesSpeciesOrganTissueAdj P-valueLog2FCMalignancy
11078TRIOBPHTA11_3410_2000001011HumanColorectumAD9.02e-093.30e-010.0155
11078TRIOBPHTA11_2487_2000001011HumanColorectumSER5.42e-217.92e-01-0.1808
11078TRIOBPHTA11_1938_2000001011HumanColorectumAD3.11e-258.70e-01-0.0811
11078TRIOBPHTA11_78_2000001011HumanColorectumAD2.03e-177.52e-01-0.1088
11078TRIOBPHTA11_347_2000001011HumanColorectumAD4.50e-257.48e-01-0.1954
11078TRIOBPHTA11_411_2000001011HumanColorectumSER8.01e-071.13e+00-0.2602
11078TRIOBPHTA11_2112_2000001011HumanColorectumSER7.38e-077.27e-01-0.2196
11078TRIOBPHTA11_3361_2000001011HumanColorectumAD4.63e-085.49e-01-0.1207
11078TRIOBPHTA11_83_2000001011HumanColorectumSER1.57e-137.05e-01-0.1526
11078TRIOBPHTA11_696_2000001011HumanColorectumAD9.41e-298.14e-01-0.1464
11078TRIOBPHTA11_866_2000001011HumanColorectumAD2.31e-298.13e-01-0.1001
11078TRIOBPHTA11_1391_2000001011HumanColorectumAD3.51e-198.10e-01-0.059
11078TRIOBPHTA11_5212_2000001011HumanColorectumAD3.67e-086.77e-01-0.2061
11078TRIOBPHTA11_546_2000001011HumanColorectumAD1.98e-107.76e-01-0.0842
11078TRIOBPHTA11_866_3004761011HumanColorectumAD6.54e-216.20e-010.096
11078TRIOBPHTA11_4255_2000001011HumanColorectumSER1.97e-035.83e-010.0446
11078TRIOBPHTA11_8622_2000001021HumanColorectumSER1.06e-045.89e-010.0528
11078TRIOBPHTA11_7663_2000001011HumanColorectumSER2.05e-058.94e-010.0131
11078TRIOBPHTA11_10623_2000001011HumanColorectumAD3.63e-127.97e-01-0.0177
11078TRIOBPHTA11_10711_2000001011HumanColorectumAD4.94e-158.09e-010.0338
Page: 1 2 3 4 5 6 7 

check button Transcriptomic changes along malignancy continuum.
TissueExpression DynamicsAbbreviation
Colorectum (GSE201348)The image shows the transcriptomic changes along malignancy continuum.log2FC in expression of this searched gene in stem-like cells from each diseased tissue sample relative to stem-like cells in normal samples in each tissue plotted against the malignancy continuum. Samples are colored based on if they are from different disease stage.FAP: Familial adenomatous polyposis
CRC: Colorectal cancer
Colorectum (HTA11)The image shows the transcriptomic changes along malignancy continuum.log2FC in expression of this searched gene in stem-like cells from each diseased tissue sample relative to stem-like cells in normal samples in each tissue plotted against the malignancy continuum. Samples are colored based on if they are from different disease stage.AD: Adenomas
SER: Sessile serrated lesions
MSI-H: Microsatellite-high colorectal cancer
MSS: Microsatellite stable colorectal cancer
EsophagusThe image shows the transcriptomic changes along malignancy continuum.log2FC in expression of this searched gene in stem-like cells from each diseased tissue sample relative to stem-like cells in normal samples in each tissue plotted against the malignancy continuum. Samples are colored based on if they are from different disease stage.
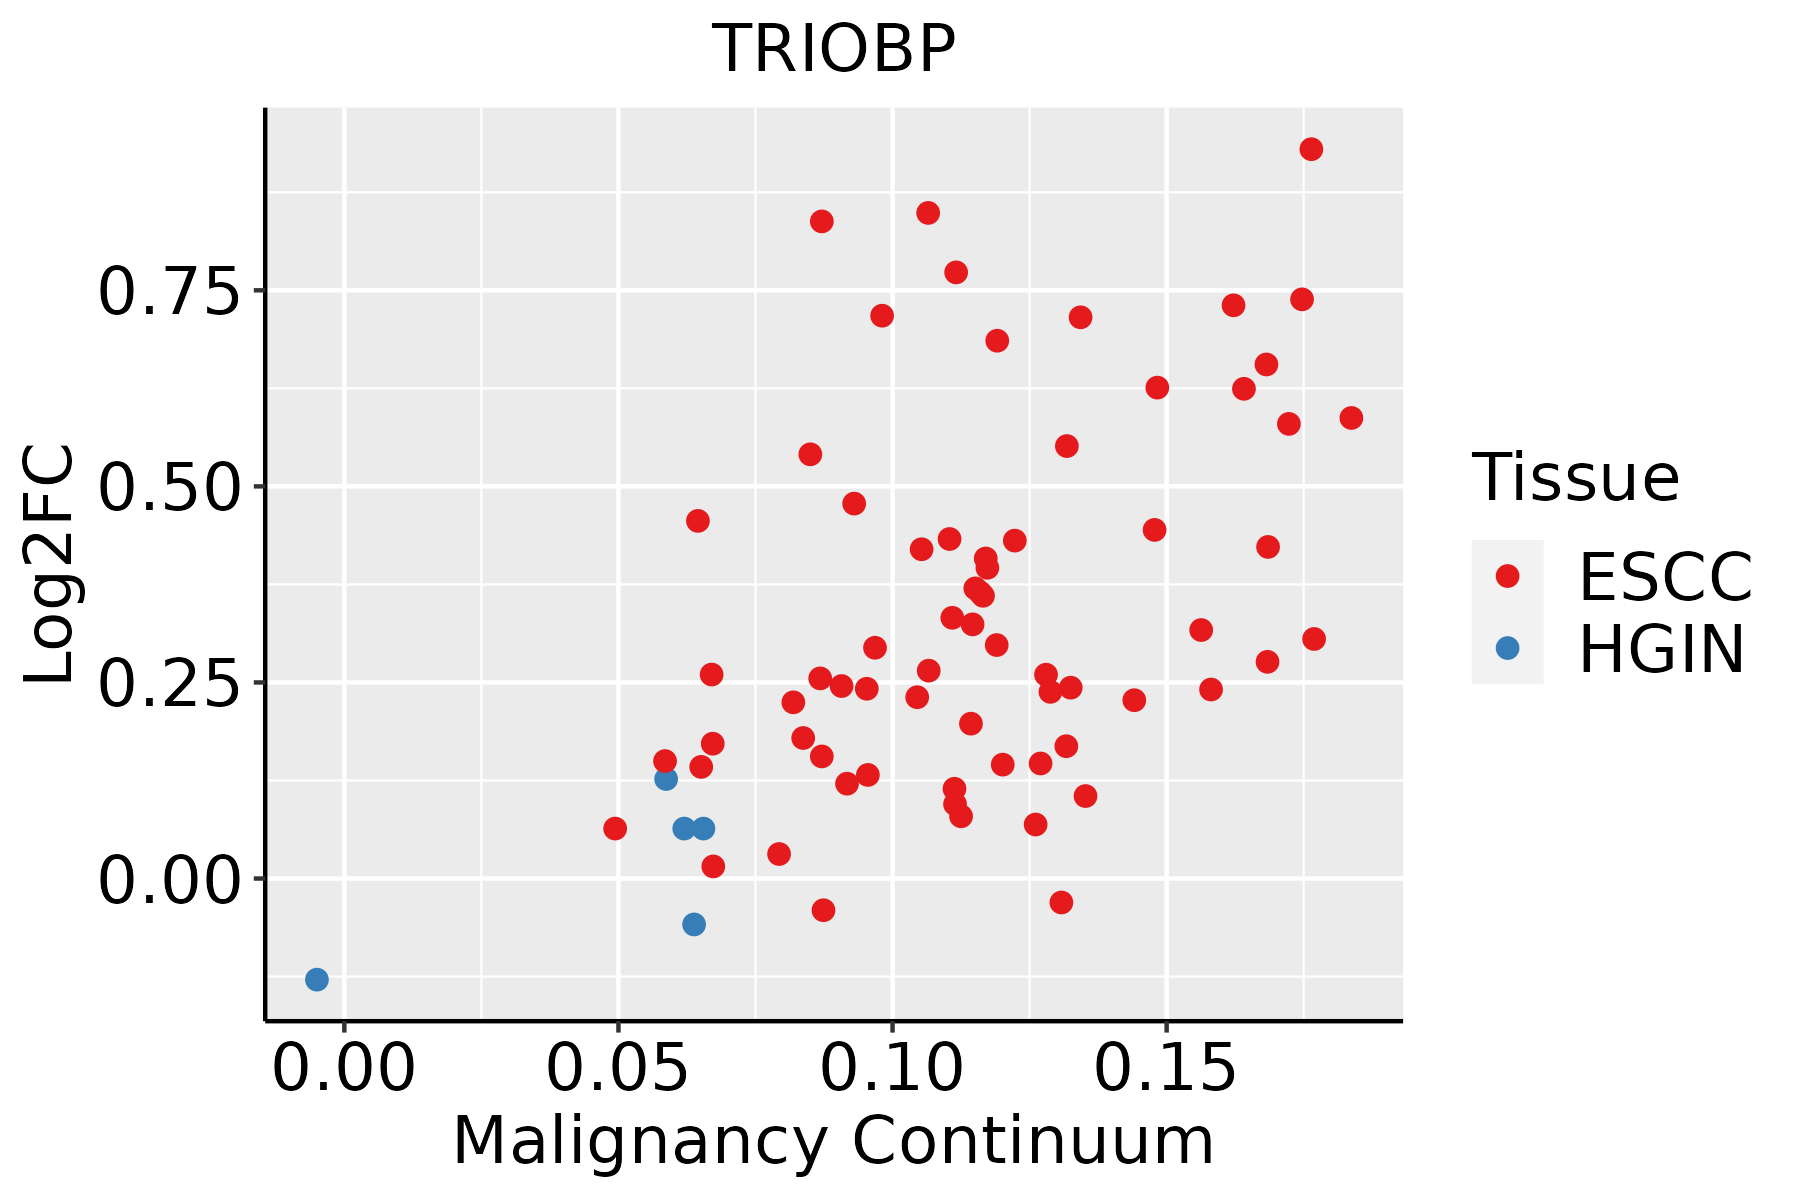
ESCC: Esophageal squamous cell carcinoma
HGIN: High-grade intraepithelial neoplasias
LGIN: Low-grade intraepithelial neoplasias
LiverThe image shows the transcriptomic changes along malignancy continuum.log2FC in expression of this searched gene in stem-like cells from each diseased tissue sample relative to stem-like cells in normal samples in each tissue plotted against the malignancy continuum. Samples are colored based on if they are from different disease stage.HCC: Hepatocellular carcinoma
NAFLD: Non-alcoholic fatty liver disease
Oral CavityThe image shows the transcriptomic changes along malignancy continuum.log2FC in expression of this searched gene in stem-like cells from each diseased tissue sample relative to stem-like cells in normal samples in each tissue plotted against the malignancy continuum. Samples are colored based on if they are from different disease stage.
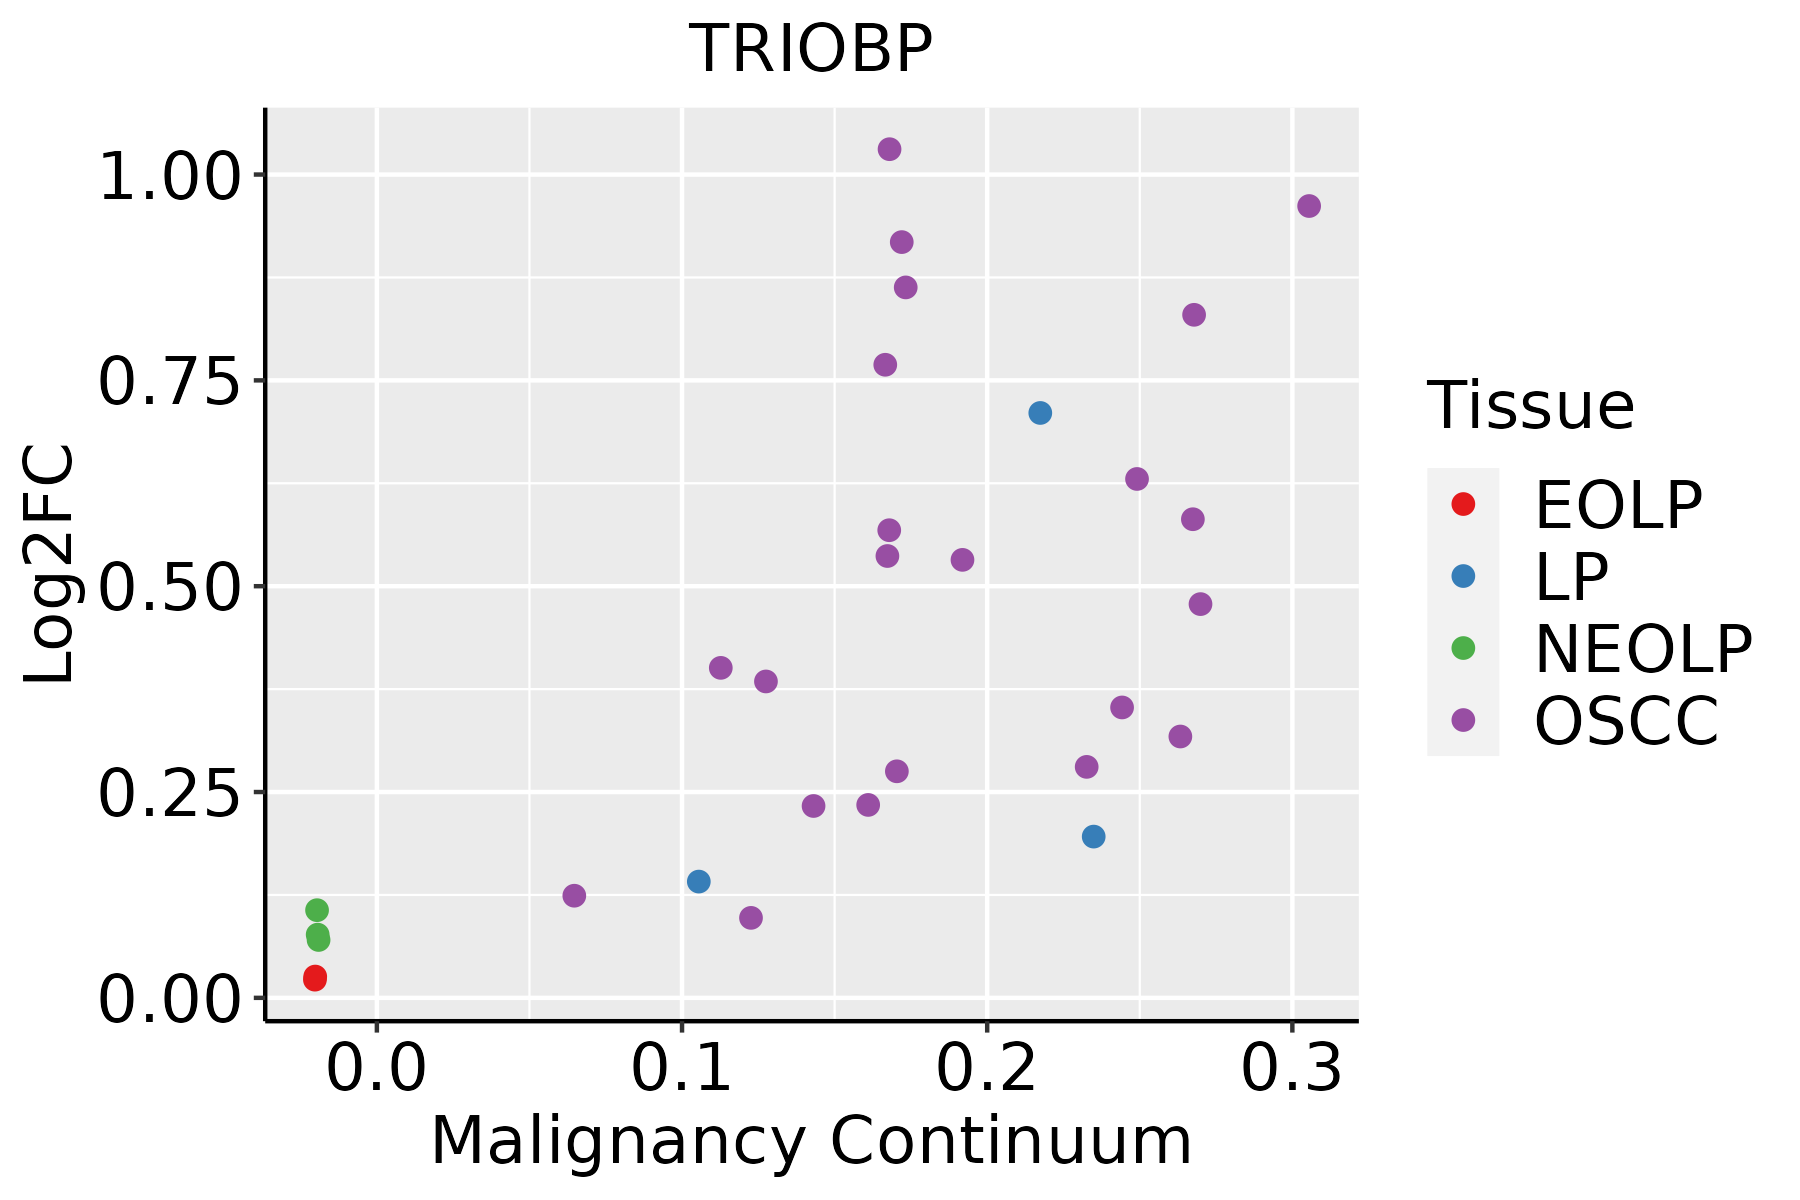
EOLP: Erosive Oral lichen planus
LP: leukoplakia
NEOLP: Non-erosive oral lichen planus
OSCC: Oral squamous cell carcinoma
ThyroidThe image shows the transcriptomic changes along malignancy continuum.log2FC in expression of this searched gene in stem-like cells from each diseased tissue sample relative to stem-like cells in normal samples in each tissue plotted against the malignancy continuum. Samples are colored based on if they are from different disease stage.ATC: Anaplastic thyroid cancer
HT: Hashimoto's thyroiditis
PTC: Papillary thyroid cancer
∗log2FC in expression of this searched gene in stem-like cells from each diseased tissue sample relative to stem-like cells in normal samples in each tissue plotted against the malignancy continuum. Samples are colored based on if they are from different disease stage.

Top

Malignant transformation related pathway analysis

check buttonFind out the enriched GO biological processes and KEGG pathways involved in transition from healthy to precancer to cancer
check button Figure of enriched GO biological processes.
TissueDisease StageEnriched GO biological Processes
ColorectumADGO analysis - Figure of enriched GO biological processes: Top 15 enriched GO BP terms are showed in the bar plot of each disease state in each tissue. Each row represents a significant GO biological process which is colored according to the -log10(p.adjust).
ColorectumSERGO analysis - Figure of enriched GO biological processes: Top 15 enriched GO BP terms are showed in the bar plot of each disease state in each tissue. Each row represents a significant GO biological process which is colored according to the -log10(p.adjust).
ColorectumMSSGO analysis - Figure of enriched GO biological processes: Top 15 enriched GO BP terms are showed in the bar plot of each disease state in each tissue. Each row represents a significant GO biological process which is colored according to the -log10(p.adjust).
ColorectumMSI-HGO analysis - Figure of enriched GO biological processes: Top 15 enriched GO BP terms are showed in the bar plot of each disease state in each tissue. Each row represents a significant GO biological process which is colored according to the -log10(p.adjust).
ColorectumFAPGO analysis - Figure of enriched GO biological processes: Top 15 enriched GO BP terms are showed in the bar plot of each disease state in each tissue. Each row represents a significant GO biological process which is colored according to the -log10(p.adjust).
∗Top 15 enriched GO BP terms are showed in the bar plot of each disease state in each tissue. Each row represents a significant GO biological process which is colored according to the -log10(p.adjust).
Page: 1 2 3 4 5 6 7 8 9 

check button Enriched GO biological processes.
GO IDTissueDisease StageDescriptionGene RatioBg Ratiopvaluep.adjustCount
GO:001063926ThyroidATCnegative regulation of organelle organization179/6293348/187233.74e-121.50e-10179
GO:003253526ThyroidATCregulation of cellular component size191/6293383/187232.51e-118.69e-10191
GO:003227129ThyroidATCregulation of protein polymerization127/6293233/187233.64e-111.20e-09127
GO:0008154111ThyroidATCactin polymerization or depolymerization119/6293218/187231.32e-104.08e-09119
GO:003298422ThyroidATCprotein-containing complex disassembly121/6293224/187232.25e-106.59e-09121
GO:0010811210ThyroidATCpositive regulation of cell-substrate adhesion73/6293123/187234.12e-099.37e-0873
GO:0008064111ThyroidATCregulation of actin polymerization or depolymerization101/6293188/187239.88e-092.05e-07101
GO:0030832111ThyroidATCregulation of actin filament length101/6293189/187231.43e-082.92e-07101
GO:001076927ThyroidATCregulation of cell morphogenesis involved in differentiation59/629396/187232.08e-084.05e-0759
GO:001072022ThyroidATCpositive regulation of cell development146/6293298/187232.36e-084.56e-07146
GO:0030041111ThyroidATCactin filament polymerization101/6293191/187232.91e-085.50e-07101
GO:003444634ThyroidATCsubstrate adhesion-dependent cell spreading64/6293108/187233.98e-087.31e-0764
GO:190002427ThyroidATCregulation of substrate adhesion-dependent cell spreading39/629357/187238.16e-081.41e-0639
GO:0030833110ThyroidATCregulation of actin filament polymerization91/6293172/187231.34e-072.20e-0691
GO:0045785210ThyroidATCpositive regulation of cell adhesion194/6293437/187231.40e-061.75e-05194
GO:001077023ThyroidATCpositive regulation of cell morphogenesis involved in differentiation46/629379/187236.09e-066.38e-0546
GO:190290426ThyroidATCnegative regulation of supramolecular fiber organization82/6293167/187232.35e-052.06e-0482
GO:004362412ThyroidATCcellular protein complex disassembly69/6293136/187232.66e-052.28e-0469
GO:003133333ThyroidATCnegative regulation of protein-containing complex assembly71/6293141/187232.83e-052.38e-0471
GO:000206428ThyroidATCepithelial cell development103/6293220/187233.06e-052.55e-04103
Page: 1 2 3 4 5 6 7 8 9 10 11 12 13 14 15 16 17 18 19 20 21 22 23 24 

check button Enriched KEGG pathways.
Pathway IDTissueDisease StageDescriptionGene RatioBg Ratiopvaluep.adjustqvalueCount
Page: 1 

Top

Cell-cell communication analysis

check buttonIdentification of potential cell-cell interactions between two cell types and their ligand-receptor pairs for different disease states
LigandReceptorLRpairPathwayTissueDisease Stage
Page: 1 

Top

Single-cell gene regulatory network inference analysis

check buttonFind out the significant the regulons (TFs) and the target genes of each regulon across cell types for different disease states
TFCell TypeTissueDisease StageTarget GeneRSSRegulon Activity
∗The dot plots of a searched regulon are shown for all cell subpopulations in each disease state of each tissue based on the regulon specific score inferred using pySCENIC and by calculating the average expression.
Page: 1 

Top

Somatic mutation of malignant transformation related genes

check buttonAnnotation of somatic variants for genes involved in malignant transformation
Hugo SymbolVariant ClassVariant ClassificationdbSNP RSHGVScHGVSpHGVSp ShortSWISSPROTBIOTYPESIFTPolyPhenTumor Sample BarcodeTissueHistologySexAgeStageTherapy TypesDrugsOutcome
TRIOBPSNVMissense_Mutationc.3142N>Cp.Glu1048Glnp.E1048QQ9H2D6protein_codingdeleterious_low_confidence(0)probably_damaging(0.994)TCGA-AC-A23H-01Breastbreast invasive carcinomaFemale>=65I/IIUnknownUnknownPD
TRIOBPSNVMissense_Mutationc.2179C>Tp.Arg727Trpp.R727WQ9H2D6protein_codingdeleterious_low_confidence(0.01)benign(0.005)TCGA-AR-A0TW-01Breastbreast invasive carcinomaFemale<65III/IVChemotherapydoxorubicinPD
TRIOBPSNVMissense_Mutationc.2252N>Ap.Arg751Glnp.R751QQ9H2D6protein_codingtolerated_low_confidence(0.11)benign(0.003)TCGA-B6-A0RL-01Breastbreast invasive carcinomaFemale<65I/IIUnknownUnknownSD
TRIOBPSNVMissense_Mutationrs560619122c.3755N>Tp.Ser1252Phep.S1252FQ9H2D6protein_codingdeleterious_low_confidence(0)benign(0.117)TCGA-BH-A0B6-01Breastbreast invasive carcinomaFemale<65I/IIUnknownUnknownSD
TRIOBPSNVMissense_Mutationc.1982N>Ap.Ser661Tyrp.S661YQ9H2D6protein_codingdeleterious_low_confidence(0)benign(0.246)TCGA-C8-A135-01Breastbreast invasive carcinomaFemale<65I/IIChemotherapy5-fluorouracilCR
TRIOBPSNVMissense_Mutationrs572969683c.3218C>Tp.Ala1073Valp.A1073VQ9H2D6protein_codingdeleterious_low_confidence(0)possibly_damaging(0.861)TCGA-E2-A153-01Breastbreast invasive carcinomaFemale<65I/IIChemotherapydoxorubicinSD
TRIOBPSNVMissense_Mutationnovelc.1067C>Ap.Thr356Asnp.T356NQ9H2D6protein_codingtolerated_low_confidence(0.23)benign(0.367)TCGA-LD-A74U-01Breastbreast invasive carcinomaFemale>=65III/IVChemotherapytaxotereSD
TRIOBPSNVMissense_Mutationnovelc.2785C>Gp.Gln929Glup.Q929EQ9H2D6protein_codingdeleterious_low_confidence(0)benign(0.173)TCGA-LL-A6FR-01Breastbreast invasive carcinomaFemale<65I/IIChemotherapyadriamycinSD
TRIOBPSNVMissense_Mutationnovelc.4398N>Gp.Ser1466Argp.S1466RQ9H2D6protein_codingtolerated_low_confidence(0.1)benign(0)TCGA-OL-A66P-01Breastbreast invasive carcinomaFemale>=65I/IIChemotherapycytoxanCR
TRIOBPinsertionNonsense_Mutationnovelc.939_940insGGGTAGGAACATTTGGATACAAAAAACAGGGGCTTTCp.Ser314GlyfsTer2p.S314Gfs*2Q9H2D6protein_codingTCGA-B6-A0RI-01Breastbreast invasive carcinomaFemale<65III/IVUnknownUnknownPD
Page: 1 2 3 4 5 6 7 8 9 10 11 12 13 14 15 16 17 18 19 20 21 22 23 24 25 26 

Top

Related drugs of malignant transformation related genes

check buttonIdentification of chemicals and drugs interact with genes involved in malignant transfromation
(DGIdb 4.0)
Entrez IDSymbolCategoryInteraction TypesDrug Claim NameDrug NamePMIDs
Page: 1