| Tissue | Expression Dynamics | Abbreviation |
| Cervix | 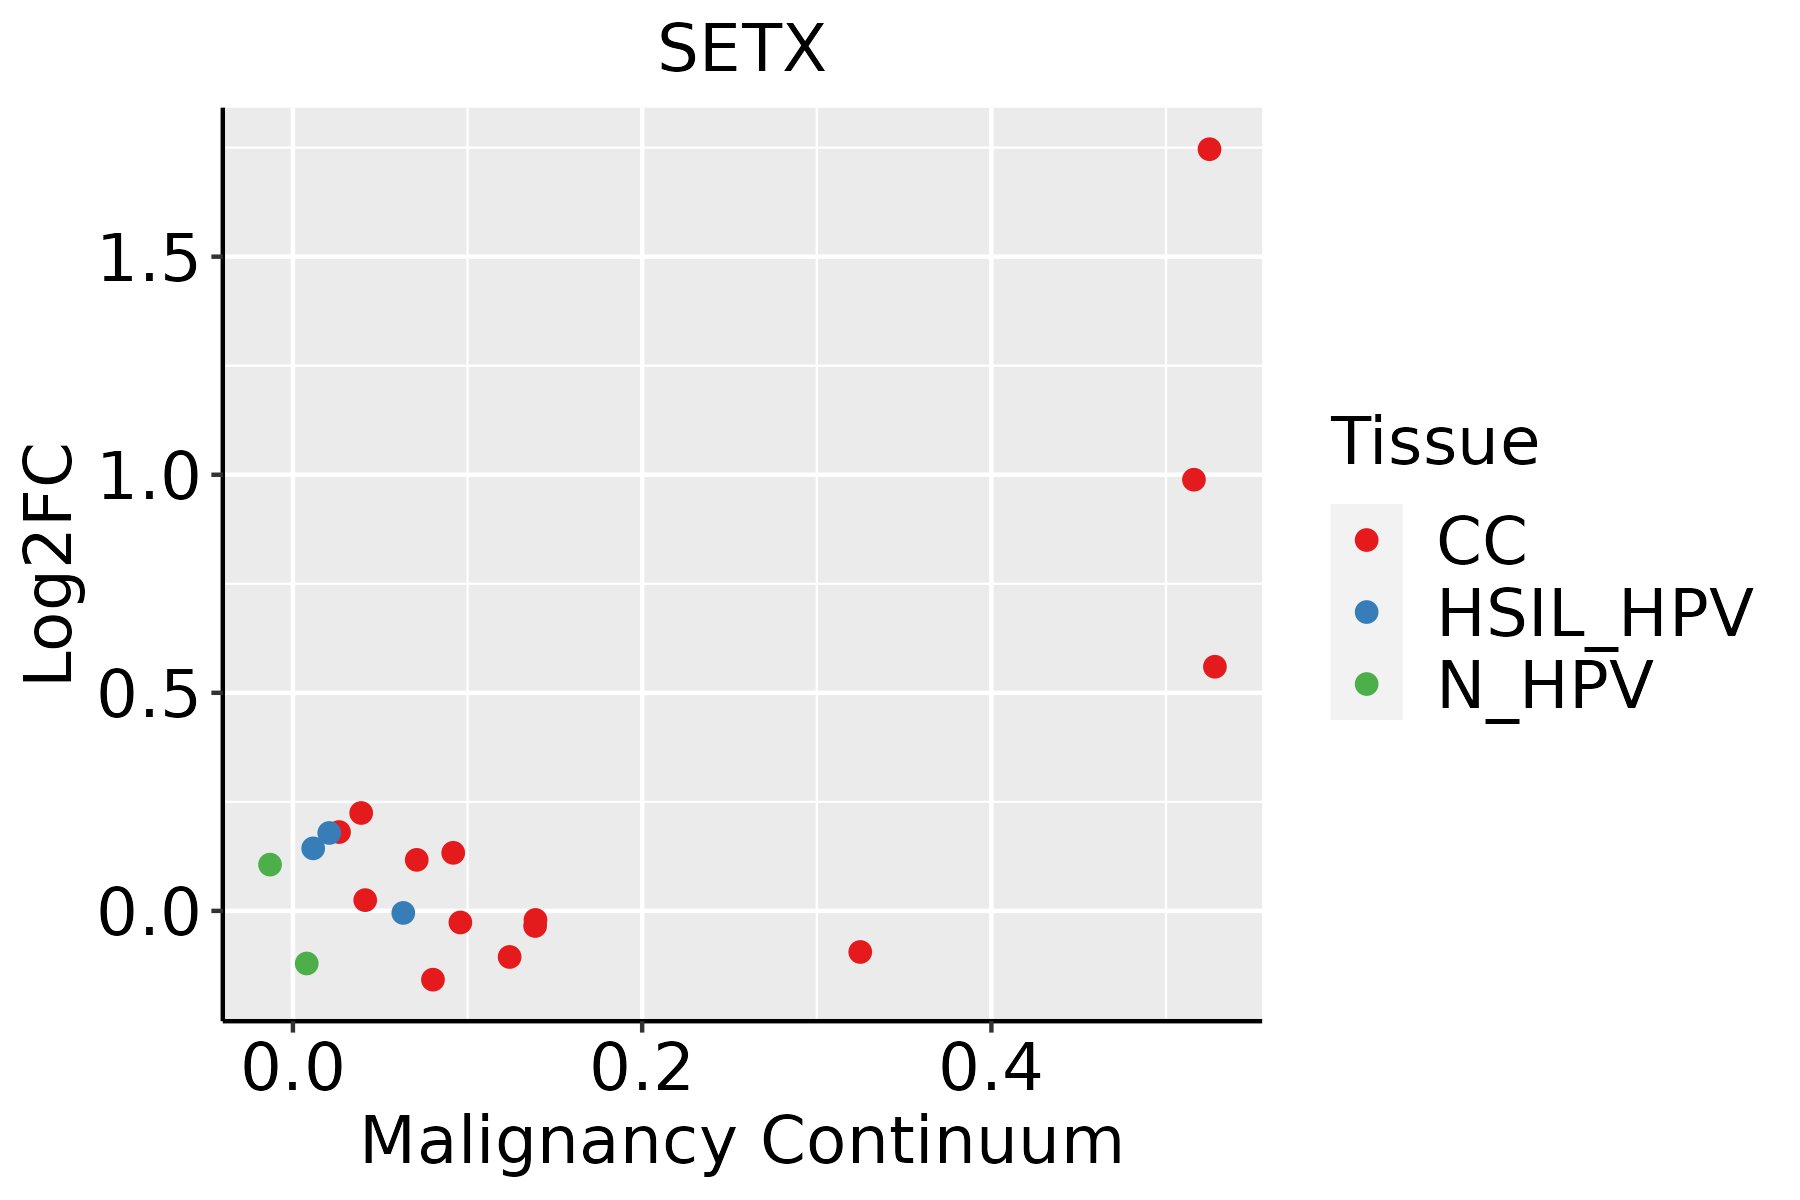 | CC: Cervix cancer |
| HSIL_HPV: HPV-infected high-grade squamous intraepithelial lesions |
| N_HPV: HPV-infected normal cervix |
| Colorectum (GSE201348) |  | FAP: Familial adenomatous polyposis |
| CRC: Colorectal cancer |
| Colorectum (HTA11) |  | AD: Adenomas |
| SER: Sessile serrated lesions |
| MSI-H: Microsatellite-high colorectal cancer |
| MSS: Microsatellite stable colorectal cancer |
| Esophagus | 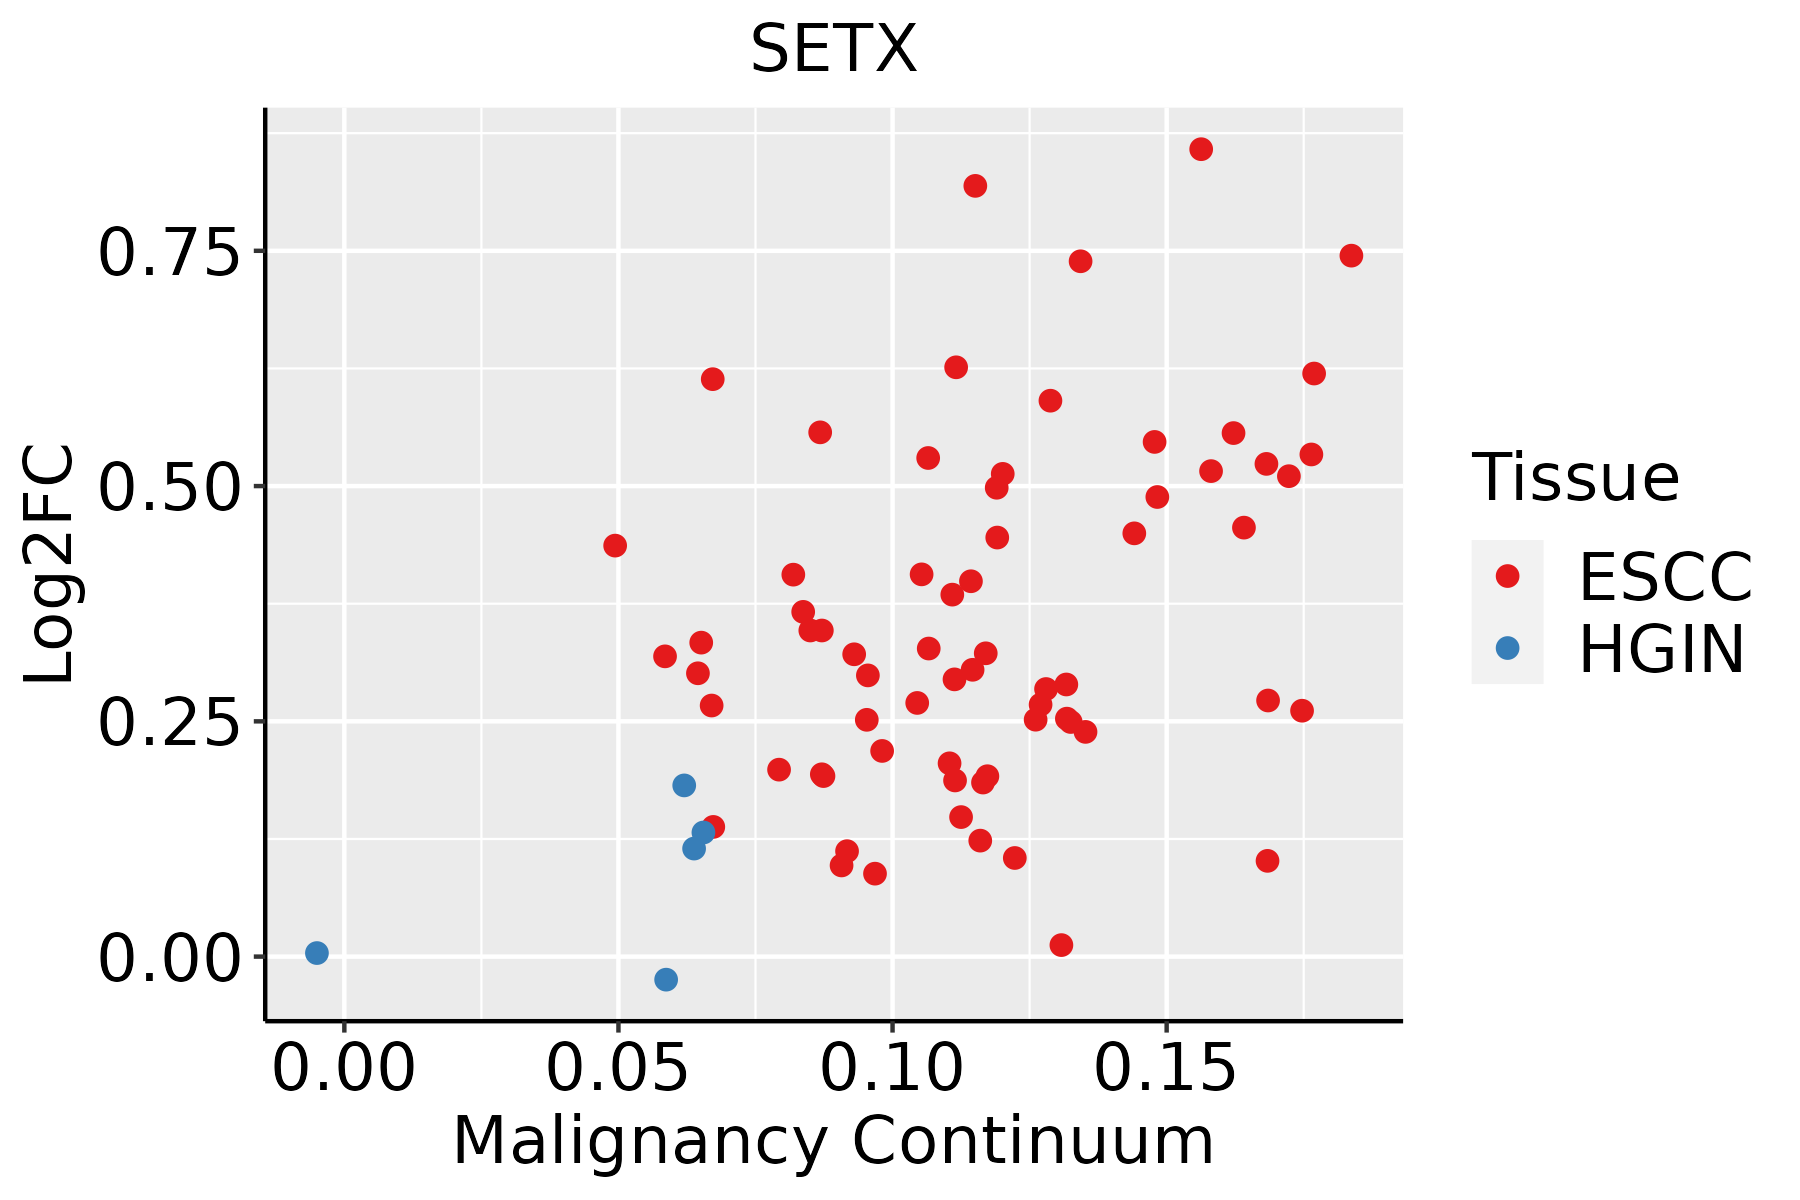 | ESCC: Esophageal squamous cell carcinoma |
| HGIN: High-grade intraepithelial neoplasias |
| LGIN: Low-grade intraepithelial neoplasias |
| Liver |  | HCC: Hepatocellular carcinoma |
| NAFLD: Non-alcoholic fatty liver disease |
| Lung | 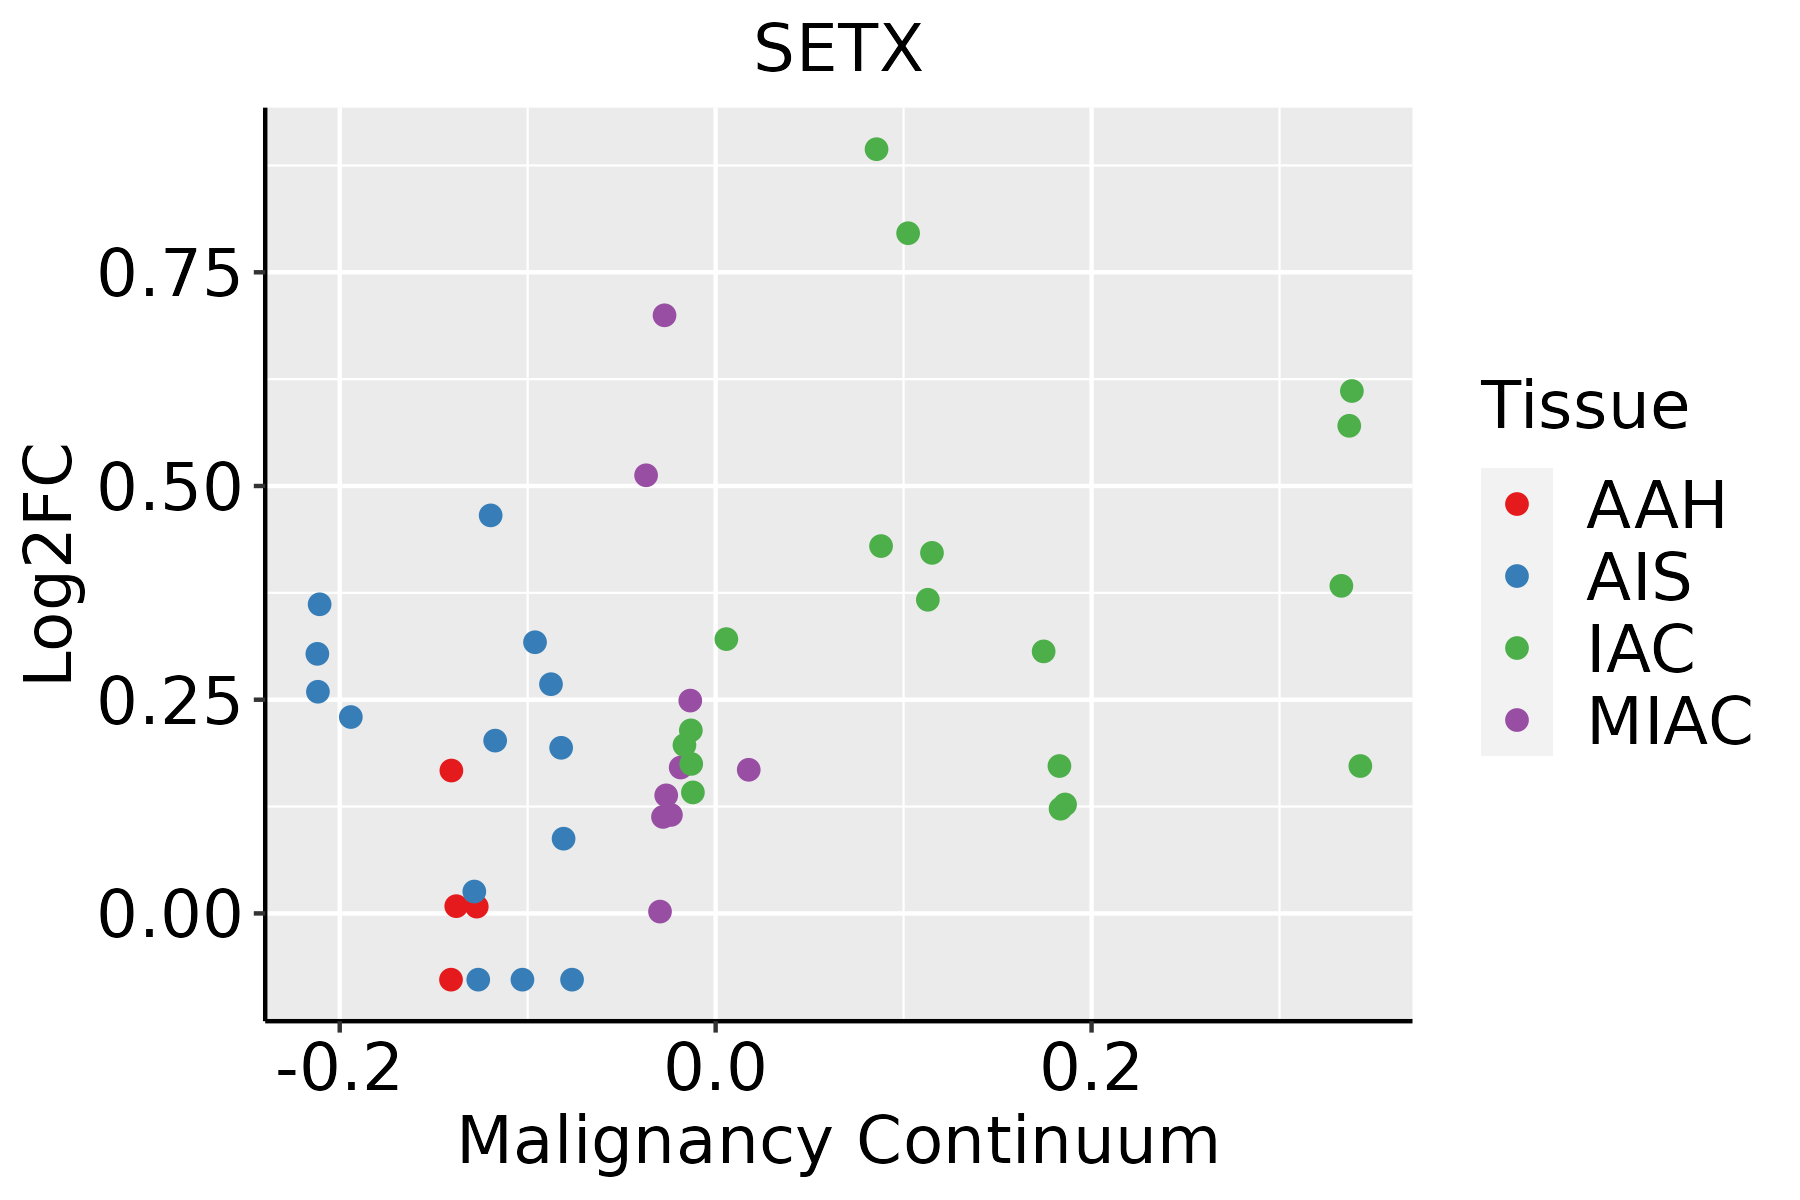 | AAH: Atypical adenomatous hyperplasia |
| AIS: Adenocarcinoma in situ |
| IAC: Invasive lung adenocarcinoma |
| MIA: Minimally invasive adenocarcinoma |
| Oral Cavity | 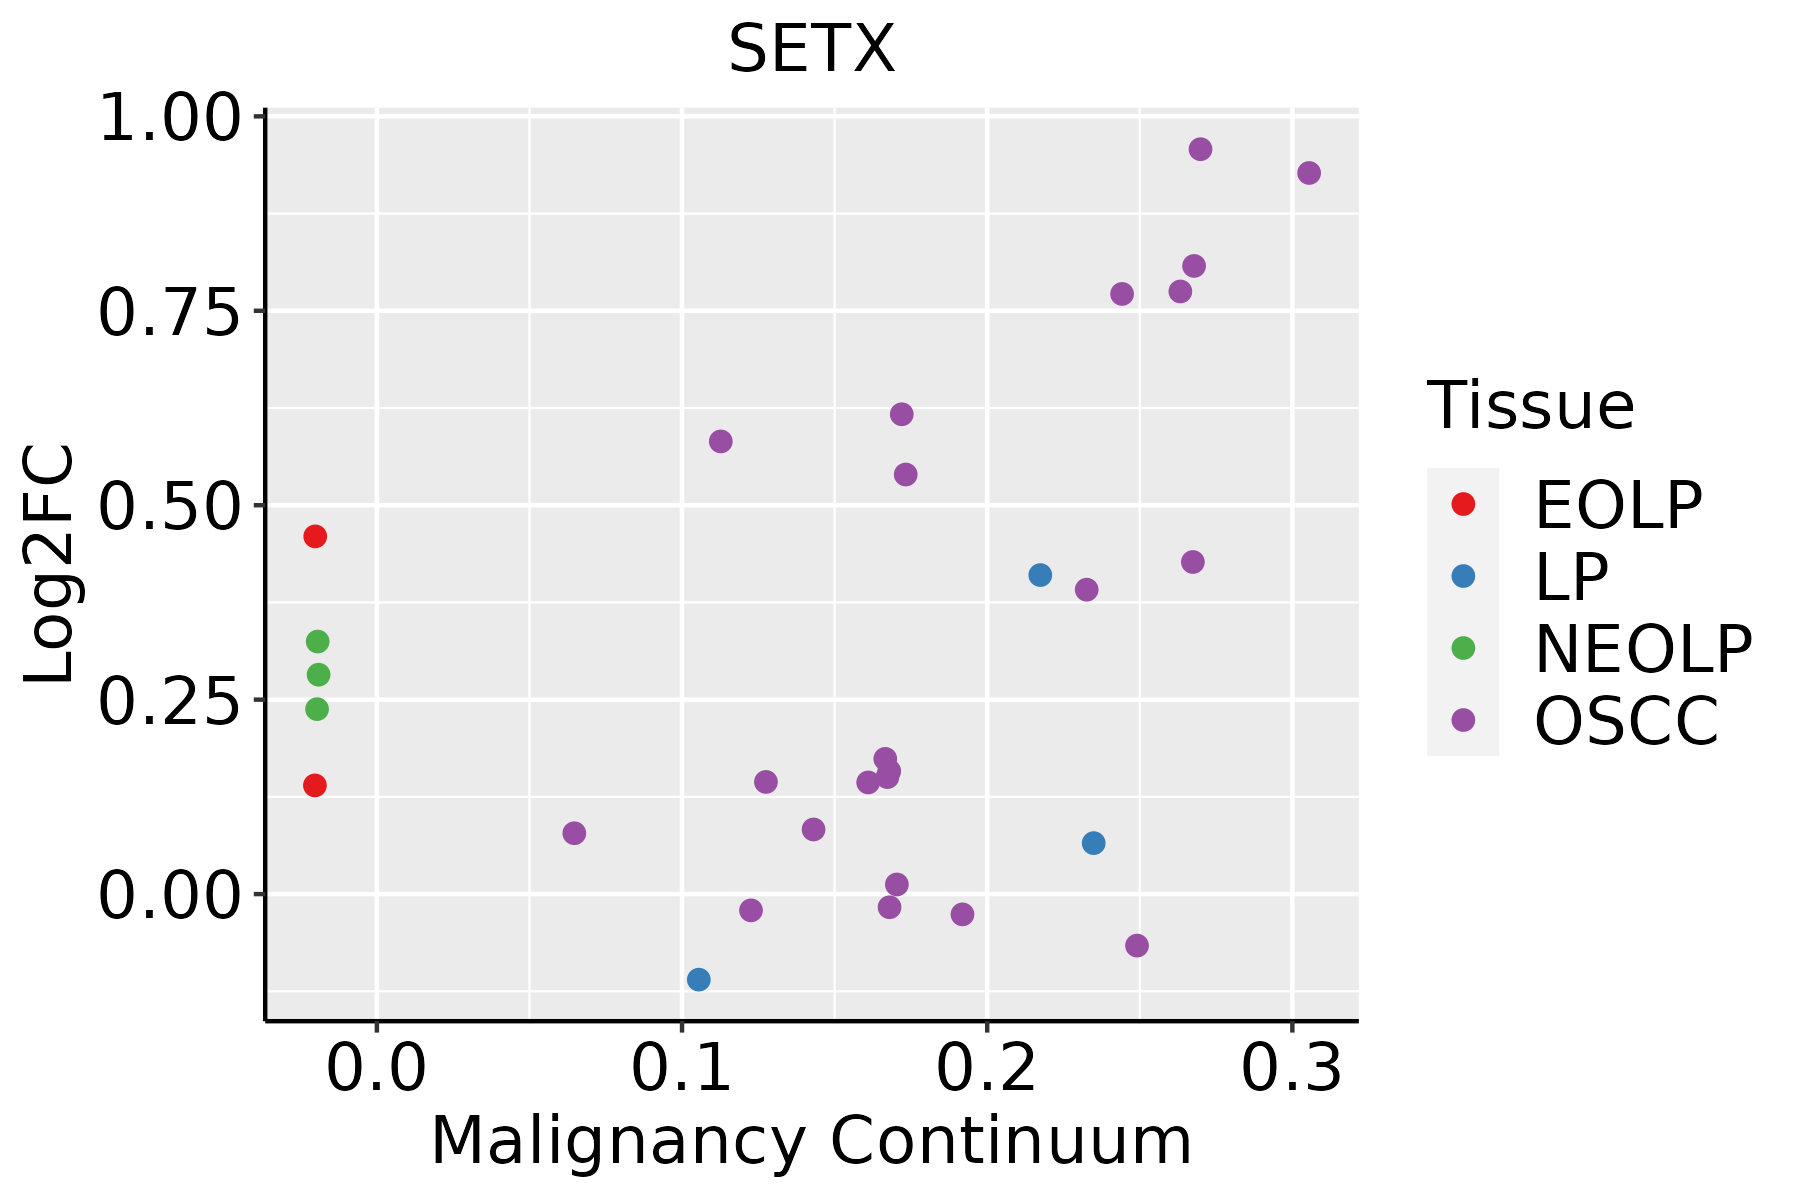 | EOLP: Erosive Oral lichen planus |
| LP: leukoplakia |
| NEOLP: Non-erosive oral lichen planus |
| OSCC: Oral squamous cell carcinoma |
| Prostate | 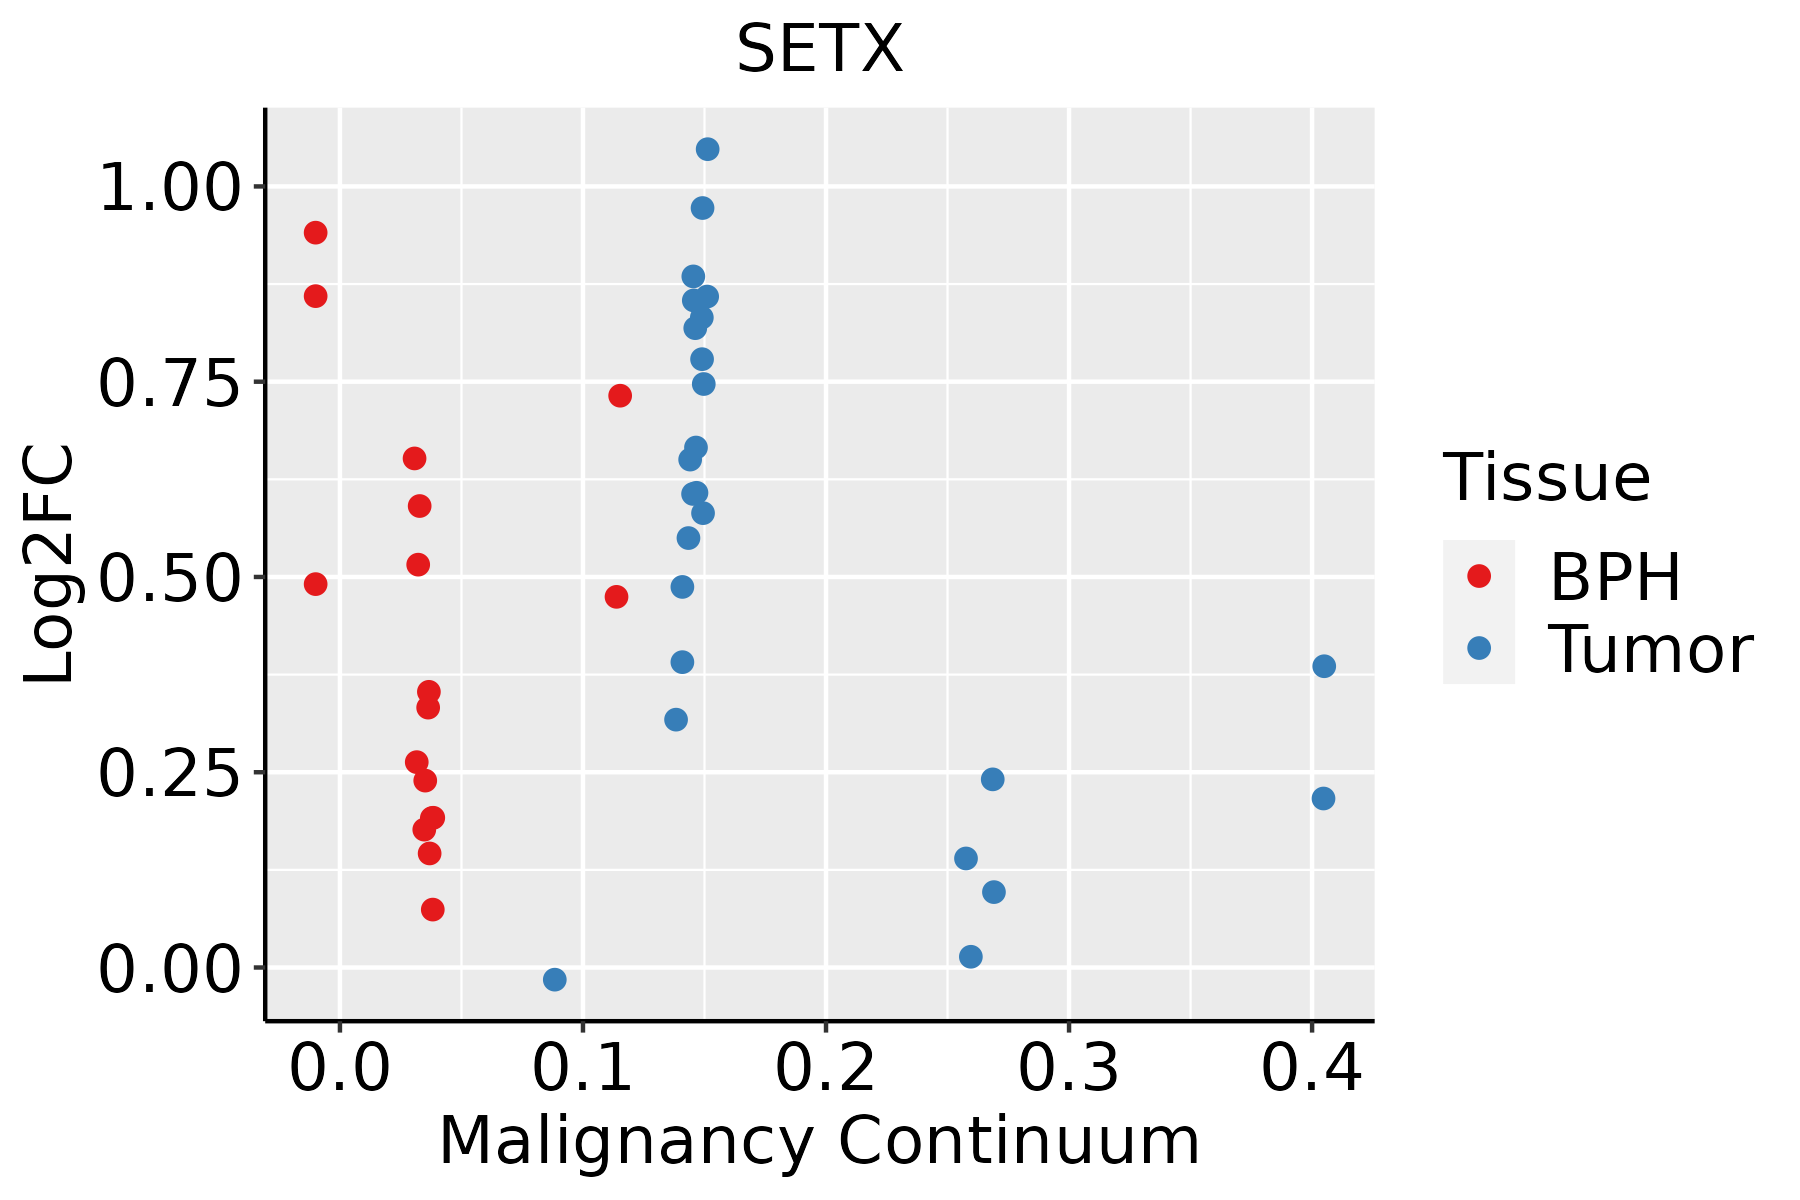 | BPH: Benign Prostatic Hyperplasia |
| Skin | 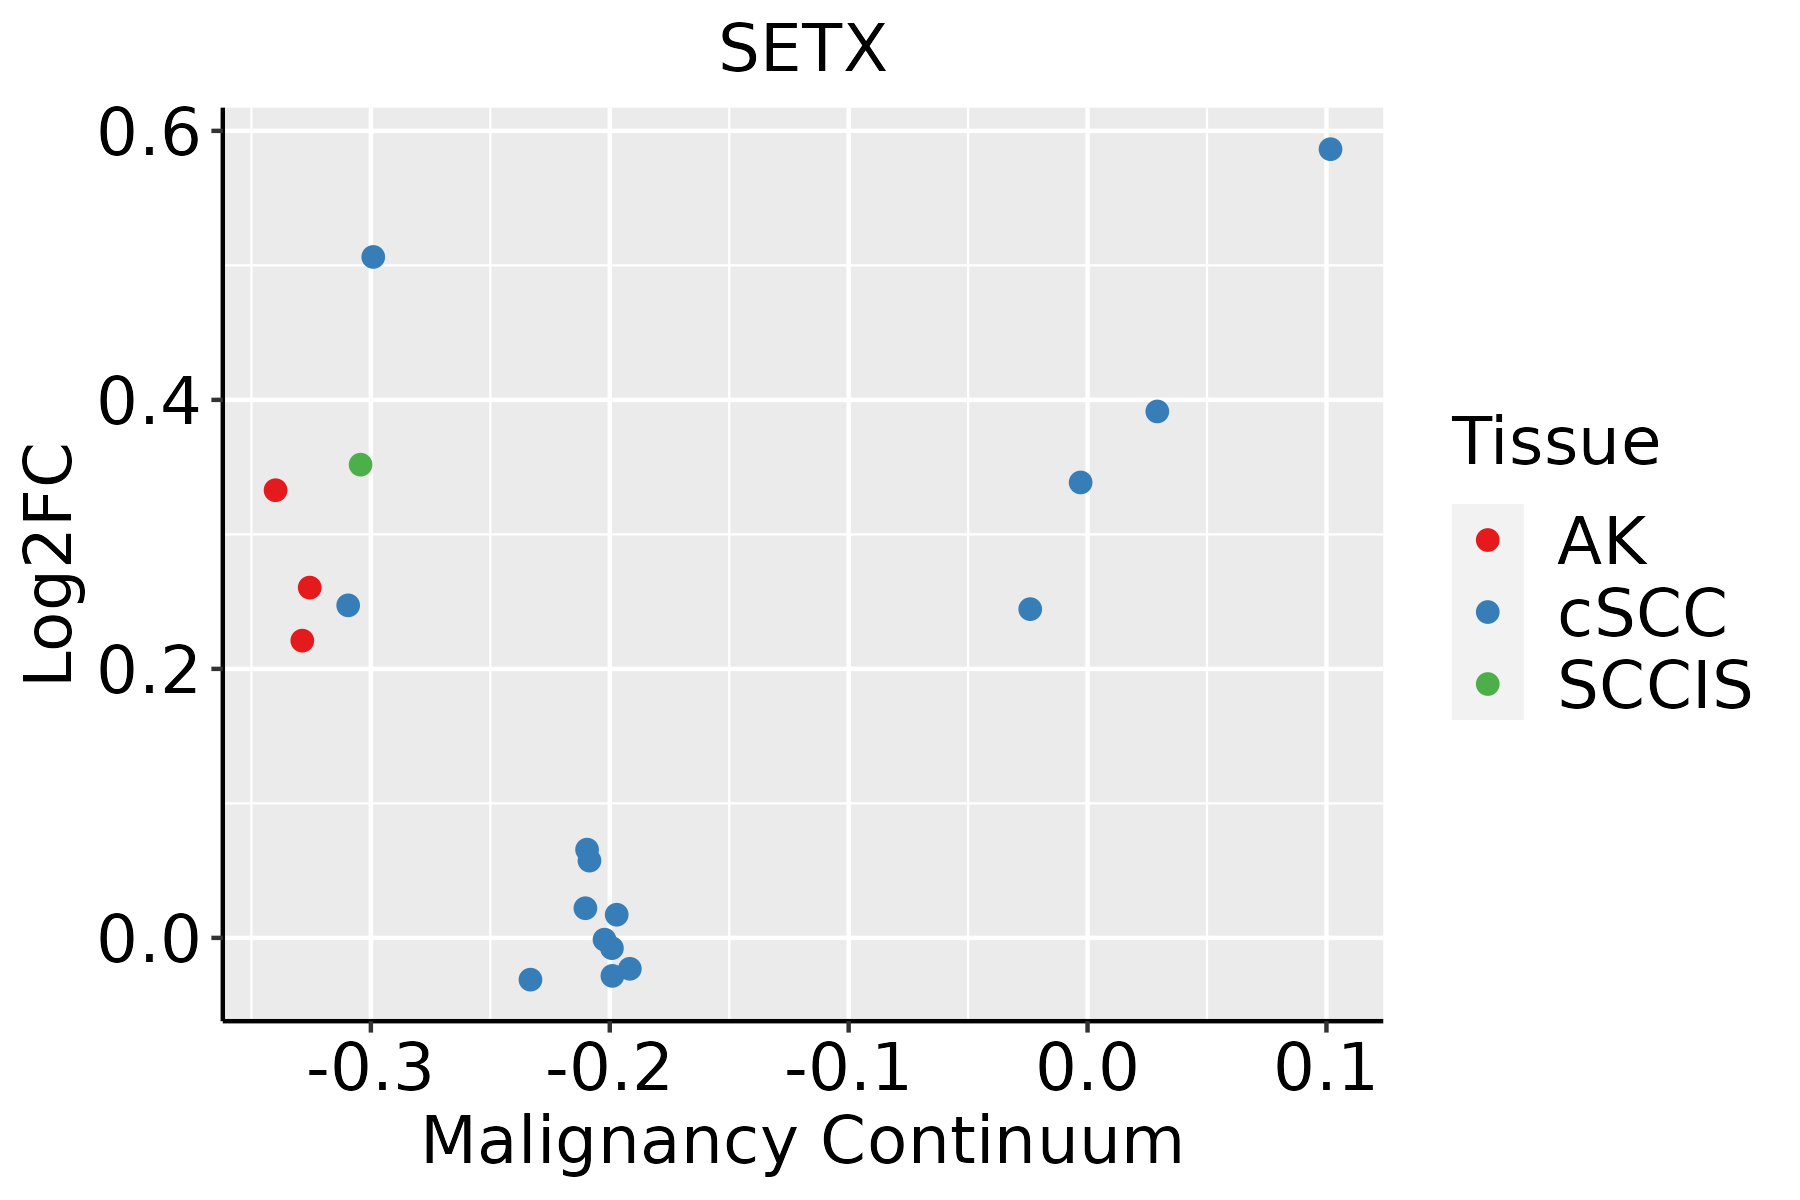 | AK: Actinic keratosis |
| cSCC: Cutaneous squamous cell carcinoma |
| SCCIS:squamous cell carcinoma in situ |
| Thyroid | 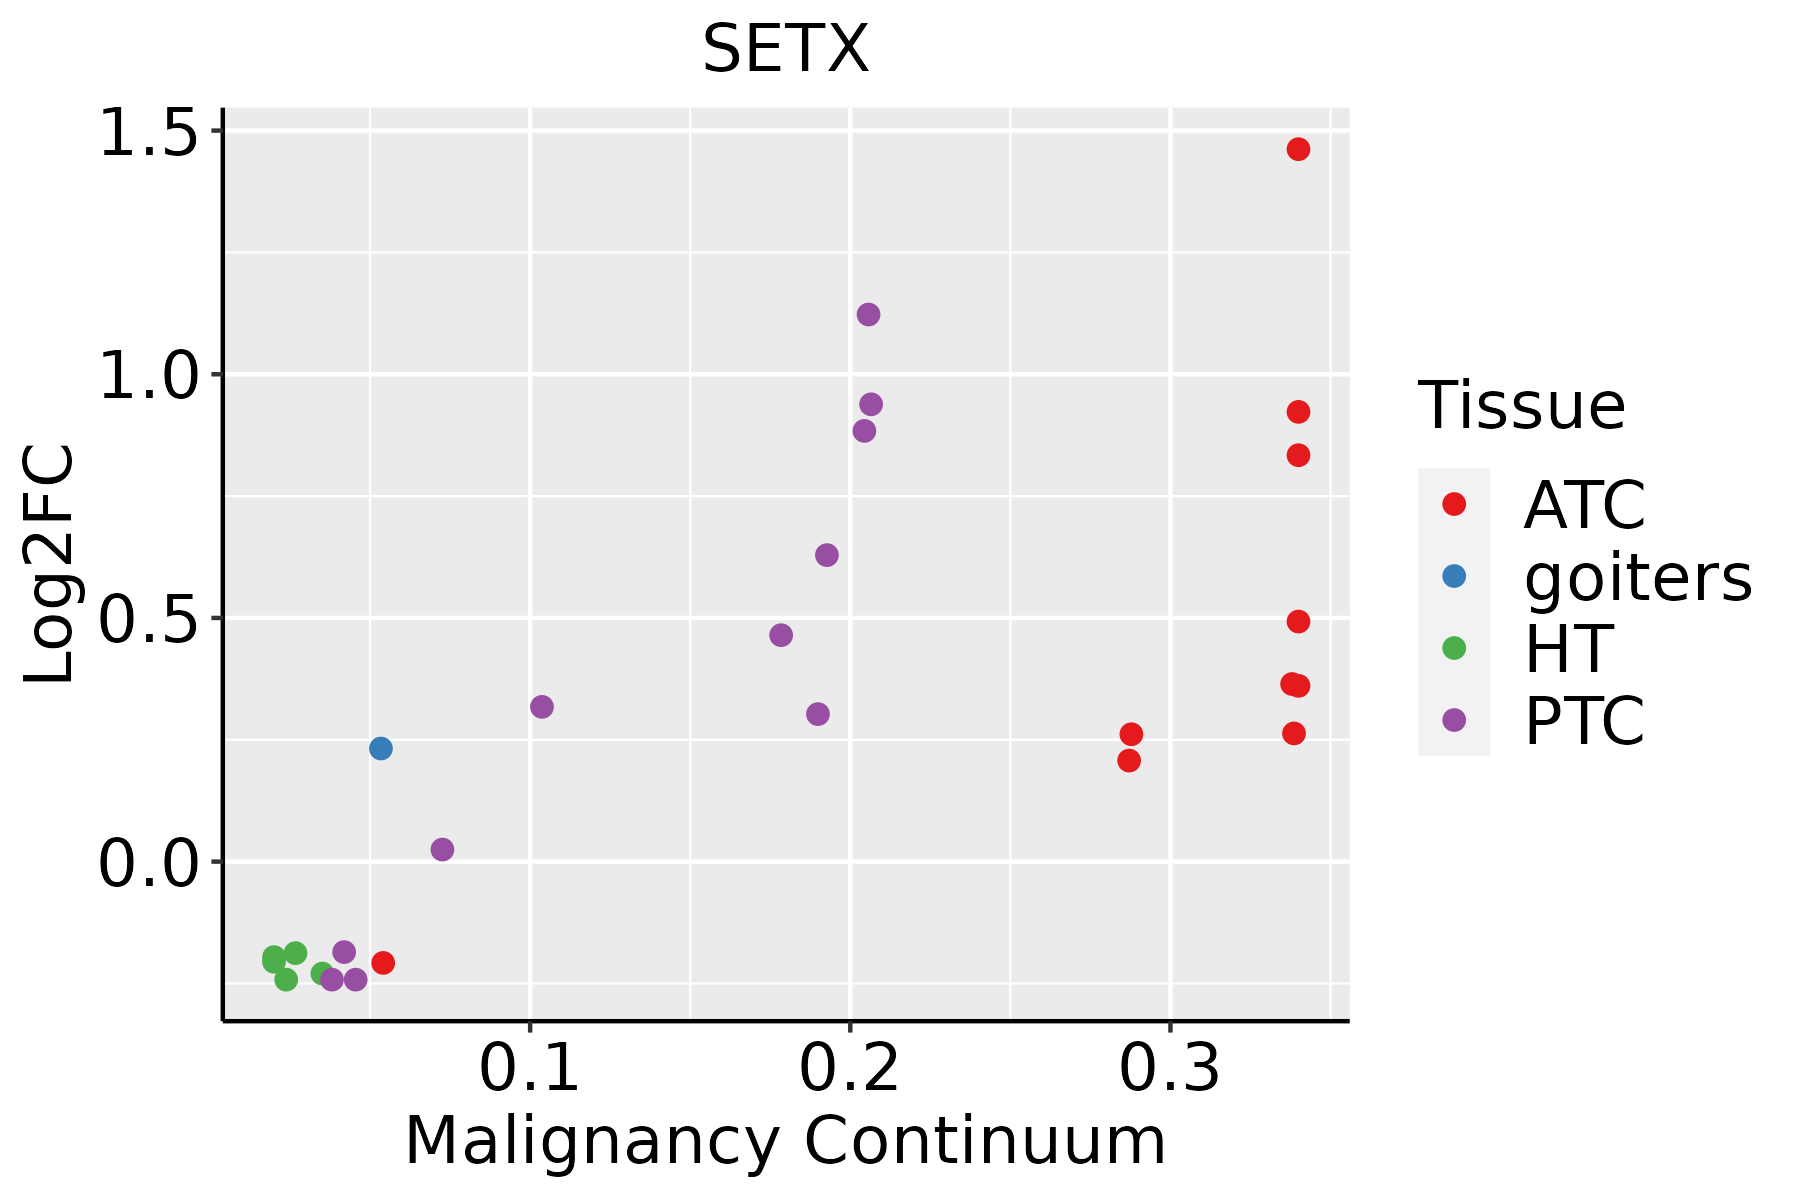 | ATC: Anaplastic thyroid cancer |
| HT: Hashimoto's thyroiditis |
| PTC: Papillary thyroid cancer |
| GO ID | Tissue | Disease Stage | Description | Gene Ratio | Bg Ratio | pvalue | p.adjust | Count |
| GO:003461425 | Skin | AK | cellular response to reactive oxygen species | 28/1910 | 155/18723 | 1.95e-03 | 1.32e-02 | 28 |
| GO:00063524 | Skin | AK | DNA-templated transcription, initiation | 23/1910 | 130/18723 | 6.10e-03 | 3.29e-02 | 23 |
| GO:00109765 | Skin | AK | positive regulation of neuron projection development | 27/1910 | 163/18723 | 7.82e-03 | 3.97e-02 | 27 |
| GO:0000302112 | Skin | SCCIS | response to reactive oxygen species | 29/919 | 222/18723 | 1.50e-06 | 8.89e-05 | 29 |
| GO:0048511110 | Skin | SCCIS | rhythmic process | 35/919 | 298/18723 | 1.63e-06 | 9.13e-05 | 35 |
| GO:0006979112 | Skin | SCCIS | response to oxidative stress | 45/919 | 446/18723 | 3.89e-06 | 1.76e-04 | 45 |
| GO:0007623110 | Skin | SCCIS | circadian rhythm | 27/919 | 210/18723 | 4.64e-06 | 1.94e-04 | 27 |
| GO:004349115 | Skin | SCCIS | protein kinase B signaling | 27/919 | 211/18723 | 5.07e-06 | 2.09e-04 | 27 |
| GO:001097518 | Skin | SCCIS | regulation of neuron projection development | 44/919 | 445/18723 | 8.33e-06 | 3.03e-04 | 44 |
| GO:0022618112 | Skin | SCCIS | ribonucleoprotein complex assembly | 27/919 | 220/18723 | 1.11e-05 | 3.87e-04 | 27 |
| GO:0071826112 | Skin | SCCIS | ribonucleoprotein complex subunit organization | 27/919 | 227/18723 | 1.96e-05 | 5.92e-04 | 27 |
| GO:0022613112 | Skin | SCCIS | ribonucleoprotein complex biogenesis | 44/919 | 463/18723 | 2.23e-05 | 6.50e-04 | 44 |
| GO:0042542112 | Skin | SCCIS | response to hydrogen peroxide | 19/919 | 146/18723 | 9.81e-05 | 2.13e-03 | 19 |
| GO:0043484112 | Skin | SCCIS | regulation of RNA splicing | 19/919 | 148/18723 | 1.18e-04 | 2.48e-03 | 19 |
| GO:0062197112 | Skin | SCCIS | cellular response to chemical stress | 31/919 | 337/18723 | 6.10e-04 | 9.06e-03 | 31 |
| GO:003252611 | Skin | SCCIS | response to retinoic acid | 13/919 | 107/18723 | 2.23e-03 | 2.24e-02 | 13 |
| GO:003134618 | Skin | SCCIS | positive regulation of cell projection organization | 30/919 | 353/18723 | 2.54e-03 | 2.44e-02 | 30 |
| GO:0034599112 | Skin | SCCIS | cellular response to oxidative stress | 25/919 | 288/18723 | 4.24e-03 | 3.57e-02 | 25 |
| GO:002261329 | Skin | cSCC | ribonucleoprotein complex biogenesis | 302/4864 | 463/18723 | 5.13e-72 | 3.22e-68 | 302 |
| GO:0008380112 | Skin | cSCC | RNA splicing | 263/4864 | 434/18723 | 2.45e-53 | 5.13e-50 | 263 |
| Pathway ID | Tissue | Disease Stage | Description | Gene Ratio | Bg Ratio | pvalue | p.adjust | qvalue | Count |
| hsa0501418 | Cervix | CC | Amyotrophic lateral sclerosis | 103/1267 | 364/8465 | 1.79e-11 | 4.47e-10 | 2.64e-10 | 103 |
| hsa0501419 | Cervix | CC | Amyotrophic lateral sclerosis | 103/1267 | 364/8465 | 1.79e-11 | 4.47e-10 | 2.64e-10 | 103 |
| hsa05014 | Colorectum | AD | Amyotrophic lateral sclerosis | 164/2092 | 364/8465 | 4.28e-18 | 1.27e-16 | 8.09e-17 | 164 |
| hsa050141 | Colorectum | AD | Amyotrophic lateral sclerosis | 164/2092 | 364/8465 | 4.28e-18 | 1.27e-16 | 8.09e-17 | 164 |
| hsa050148 | Colorectum | FAP | Amyotrophic lateral sclerosis | 91/1404 | 364/8465 | 1.84e-05 | 2.36e-04 | 1.44e-04 | 91 |
| hsa050149 | Colorectum | FAP | Amyotrophic lateral sclerosis | 91/1404 | 364/8465 | 1.84e-05 | 2.36e-04 | 1.44e-04 | 91 |
| hsa0501430 | Esophagus | HGIN | Amyotrophic lateral sclerosis | 140/1383 | 364/8465 | 2.13e-25 | 1.16e-23 | 9.19e-24 | 140 |
| hsa05014113 | Esophagus | HGIN | Amyotrophic lateral sclerosis | 140/1383 | 364/8465 | 2.13e-25 | 1.16e-23 | 9.19e-24 | 140 |
| hsa05014210 | Esophagus | ESCC | Amyotrophic lateral sclerosis | 266/4205 | 364/8465 | 1.31e-20 | 2.20e-18 | 1.13e-18 | 266 |
| hsa0501438 | Esophagus | ESCC | Amyotrophic lateral sclerosis | 266/4205 | 364/8465 | 1.31e-20 | 2.20e-18 | 1.13e-18 | 266 |
| hsa0501422 | Liver | HCC | Amyotrophic lateral sclerosis | 252/4020 | 364/8465 | 8.85e-18 | 7.41e-16 | 4.12e-16 | 252 |
| hsa0501432 | Liver | HCC | Amyotrophic lateral sclerosis | 252/4020 | 364/8465 | 8.85e-18 | 7.41e-16 | 4.12e-16 | 252 |
| hsa0501428 | Oral cavity | OSCC | Amyotrophic lateral sclerosis | 246/3704 | 364/8465 | 6.65e-21 | 1.11e-18 | 5.67e-19 | 246 |
| hsa05014112 | Oral cavity | OSCC | Amyotrophic lateral sclerosis | 246/3704 | 364/8465 | 6.65e-21 | 1.11e-18 | 5.67e-19 | 246 |
| hsa0501445 | Oral cavity | EOLP | Amyotrophic lateral sclerosis | 93/1218 | 364/8465 | 7.07e-09 | 1.14e-07 | 6.74e-08 | 93 |
| hsa0501455 | Oral cavity | EOLP | Amyotrophic lateral sclerosis | 93/1218 | 364/8465 | 7.07e-09 | 1.14e-07 | 6.74e-08 | 93 |
| hsa0501462 | Oral cavity | NEOLP | Amyotrophic lateral sclerosis | 95/1112 | 364/8465 | 8.76e-12 | 3.98e-10 | 2.50e-10 | 95 |
| hsa0501472 | Oral cavity | NEOLP | Amyotrophic lateral sclerosis | 95/1112 | 364/8465 | 8.76e-12 | 3.98e-10 | 2.50e-10 | 95 |
| hsa0501426 | Prostate | BPH | Amyotrophic lateral sclerosis | 151/1718 | 364/8465 | 3.37e-21 | 1.01e-19 | 6.25e-20 | 151 |
| hsa05014111 | Prostate | BPH | Amyotrophic lateral sclerosis | 151/1718 | 364/8465 | 3.37e-21 | 1.01e-19 | 6.25e-20 | 151 |
| Hugo Symbol | Variant Class | Variant Classification | dbSNP RS | HGVSc | HGVSp | HGVSp Short | SWISSPROT | BIOTYPE | SIFT | PolyPhen | Tumor Sample Barcode | Tissue | Histology | Sex | Age | Stage | Therapy Types | Drugs | Outcome |
| SETX | SNV | Missense_Mutation | rs757652780 | c.5566G>A | p.Glu1856Lys | p.E1856K | Q7Z333 | protein_coding | deleterious(0.05) | probably_damaging(0.994) | TCGA-A2-A0EY-01 | Breast | breast invasive carcinoma | Female | <65 | I/II | Chemotherapy | adriamycin | SD |
| SETX | SNV | Missense_Mutation | | c.3961G>A | p.Asp1321Asn | p.D1321N | Q7Z333 | protein_coding | tolerated(0.21) | benign(0.007) | TCGA-A2-A0EY-01 | Breast | breast invasive carcinoma | Female | <65 | I/II | Chemotherapy | adriamycin | SD |
| SETX | SNV | Missense_Mutation | | c.2356G>C | p.Glu786Gln | p.E786Q | Q7Z333 | protein_coding | deleterious_low_confidence(0.04) | possibly_damaging(0.69) | TCGA-A2-A0YK-01 | Breast | breast invasive carcinoma | Female | <65 | I/II | Chemotherapy | cytoxan | SD |
| SETX | SNV | Missense_Mutation | novel | c.7568N>A | p.Thr2523Asn | p.T2523N | Q7Z333 | protein_coding | tolerated(0.16) | benign(0.188) | TCGA-A2-A4S1-01 | Breast | breast invasive carcinoma | Female | >=65 | I/II | Unknown | Unknown | SD |
| SETX | SNV | Missense_Mutation | | c.689N>G | p.Asp230Gly | p.D230G | Q7Z333 | protein_coding | deleterious(0) | probably_damaging(0.914) | TCGA-A8-A07P-01 | Breast | breast invasive carcinoma | Female | >=65 | I/II | Chemotherapy | 5-fluorouracil | SD |
| SETX | SNV | Missense_Mutation | | c.5126N>C | p.Lys1709Thr | p.K1709T | Q7Z333 | protein_coding | tolerated(0.8) | benign(0.123) | TCGA-A8-A094-01 | Breast | breast invasive carcinoma | Female | >=65 | I/II | Unknown | Unknown | SD |
| SETX | SNV | Missense_Mutation | | c.6590N>G | p.His2197Arg | p.H2197R | Q7Z333 | protein_coding | deleterious(0) | probably_damaging(0.956) | TCGA-A8-A09N-01 | Breast | breast invasive carcinoma | Female | <65 | III/IV | Unknown | Unknown | SD |
| SETX | SNV | Missense_Mutation | novel | c.7393N>A | p.Leu2465Ile | p.L2465I | Q7Z333 | protein_coding | tolerated(0.05) | possibly_damaging(0.749) | TCGA-AN-A046-01 | Breast | breast invasive carcinoma | Female | >=65 | I/II | Unknown | Unknown | SD |
| SETX | SNV | Missense_Mutation | novel | c.7034N>C | p.Ile2345Thr | p.I2345T | Q7Z333 | protein_coding | deleterious(0) | probably_damaging(0.998) | TCGA-AN-A046-01 | Breast | breast invasive carcinoma | Female | >=65 | I/II | Unknown | Unknown | SD |
| SETX | SNV | Missense_Mutation | novel | c.6252N>T | p.Lys2084Asn | p.K2084N | Q7Z333 | protein_coding | deleterious(0) | probably_damaging(0.999) | TCGA-AN-A046-01 | Breast | breast invasive carcinoma | Female | >=65 | I/II | Unknown | Unknown | SD |


