
|
|||||
|
 | |
| |
| |
| |
| |
| |
|
Gene: PPIB |
Gene summary for PPIB |
| Gene information | Species | Human | Gene symbol | PPIB | Gene ID | 5479 |
| Gene name | peptidylprolyl isomerase B | |
| Gene Alias | B | |
| Cytomap | 15q22.31 | |
| Gene Type | protein-coding | GO ID | GO:0000413 | UniProtAcc | P23284 |
Top |
Malignant transformation analysis |
| Identification of the aberrant gene expression in precancerous and cancerous lesions by comparing the gene expression of stem-like cells in diseased tissues with normal stem cells |
| Entrez ID | Symbol | Replicates | Species | Organ | Tissue | Adj P-value | Log2FC | Malignancy |
| 5479 | PPIB | GSM4909281 | Human | Breast | IDC | 3.75e-11 | 4.53e-01 | 0.21 |
| 5479 | PPIB | GSM4909282 | Human | Breast | IDC | 3.79e-14 | 4.80e-01 | -0.0288 |
| 5479 | PPIB | GSM4909286 | Human | Breast | IDC | 5.16e-14 | -2.78e-01 | 0.1081 |
| 5479 | PPIB | GSM4909288 | Human | Breast | IDC | 6.96e-03 | -4.54e-02 | 0.0988 |
| 5479 | PPIB | GSM4909292 | Human | Breast | IDC | 6.18e-03 | -7.36e-01 | 0.1236 |
| 5479 | PPIB | GSM4909293 | Human | Breast | IDC | 1.44e-12 | -3.37e-01 | 0.1581 |
| 5479 | PPIB | GSM4909294 | Human | Breast | IDC | 4.51e-18 | -5.32e-01 | 0.2022 |
| 5479 | PPIB | GSM4909296 | Human | Breast | IDC | 3.92e-18 | 2.39e-01 | 0.1524 |
| 5479 | PPIB | GSM4909297 | Human | Breast | IDC | 4.31e-15 | -2.67e-01 | 0.1517 |
| 5479 | PPIB | GSM4909298 | Human | Breast | IDC | 3.10e-14 | -3.63e-01 | 0.1551 |
| 5479 | PPIB | GSM4909301 | Human | Breast | IDC | 1.64e-02 | -2.36e-01 | 0.1577 |
| 5479 | PPIB | GSM4909306 | Human | Breast | IDC | 1.60e-04 | -2.36e-01 | 0.1564 |
| 5479 | PPIB | GSM4909311 | Human | Breast | IDC | 5.15e-44 | -4.15e-01 | 0.1534 |
| 5479 | PPIB | GSM4909312 | Human | Breast | IDC | 6.29e-12 | -2.57e-01 | 0.1552 |
| 5479 | PPIB | GSM4909313 | Human | Breast | IDC | 8.85e-03 | -2.46e-01 | 0.0391 |
| 5479 | PPIB | GSM4909315 | Human | Breast | IDC | 1.57e-11 | -4.86e-01 | 0.21 |
| 5479 | PPIB | GSM4909316 | Human | Breast | IDC | 1.44e-04 | -4.88e-01 | 0.21 |
| 5479 | PPIB | GSM4909319 | Human | Breast | IDC | 2.11e-55 | -4.77e-01 | 0.1563 |
| 5479 | PPIB | GSM4909320 | Human | Breast | IDC | 2.95e-07 | -5.59e-01 | 0.1575 |
| 5479 | PPIB | GSM4909321 | Human | Breast | IDC | 1.42e-11 | -1.51e-01 | 0.1559 |
| Page: 1 2 3 4 5 6 7 8 9 10 11 12 13 14 15 |
| Tissue | Expression Dynamics | Abbreviation |
| Breast | 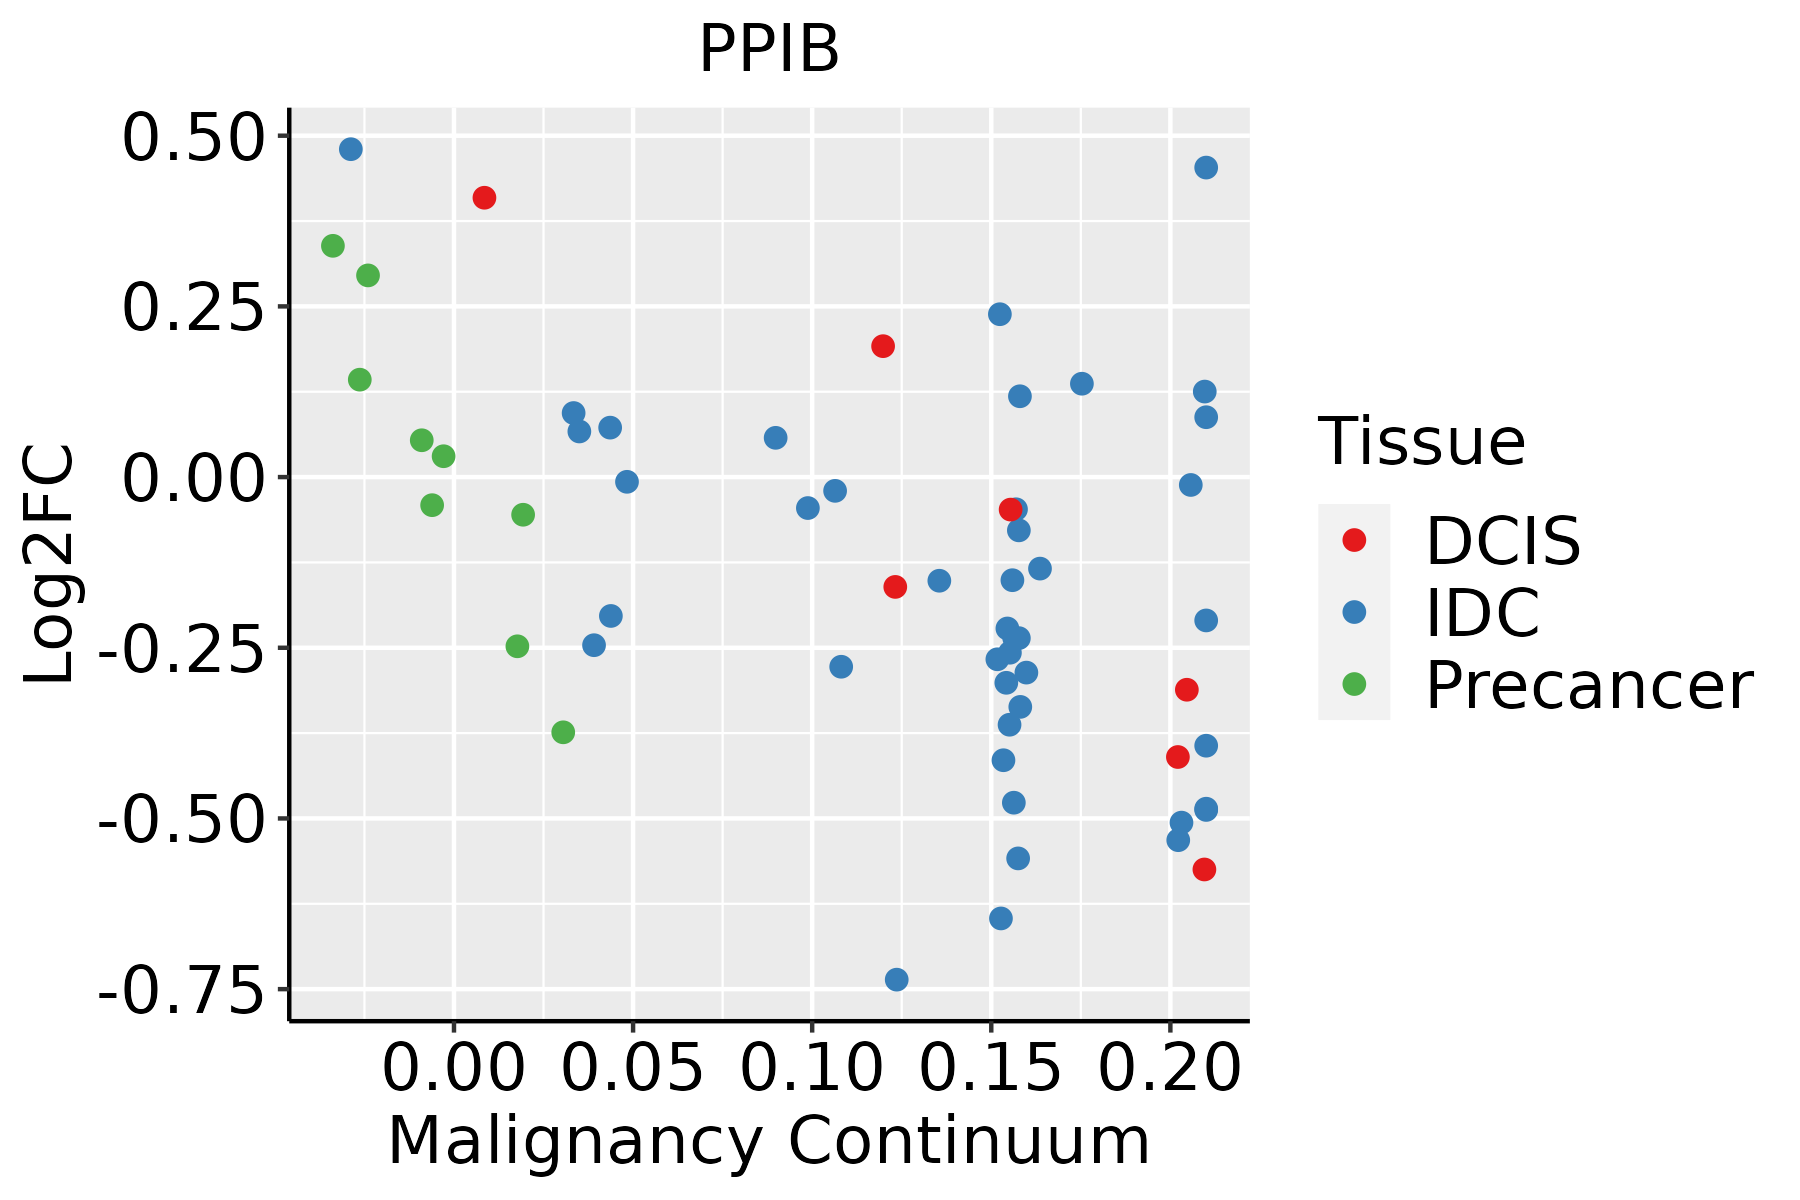 | IDC: Invasive ductal carcinoma |
| DCIS: Ductal carcinoma in situ | ||
| Precancer(BRCA1-mut): Precancerous lesion from BRCA1 mutation carriers | ||
| Cervix |  | CC: Cervix cancer |
| HSIL_HPV: HPV-infected high-grade squamous intraepithelial lesions | ||
| N_HPV: HPV-infected normal cervix | ||
| Endometrium |  | AEH: Atypical endometrial hyperplasia |
| EEC: Endometrioid Cancer | ||
| Esophagus | 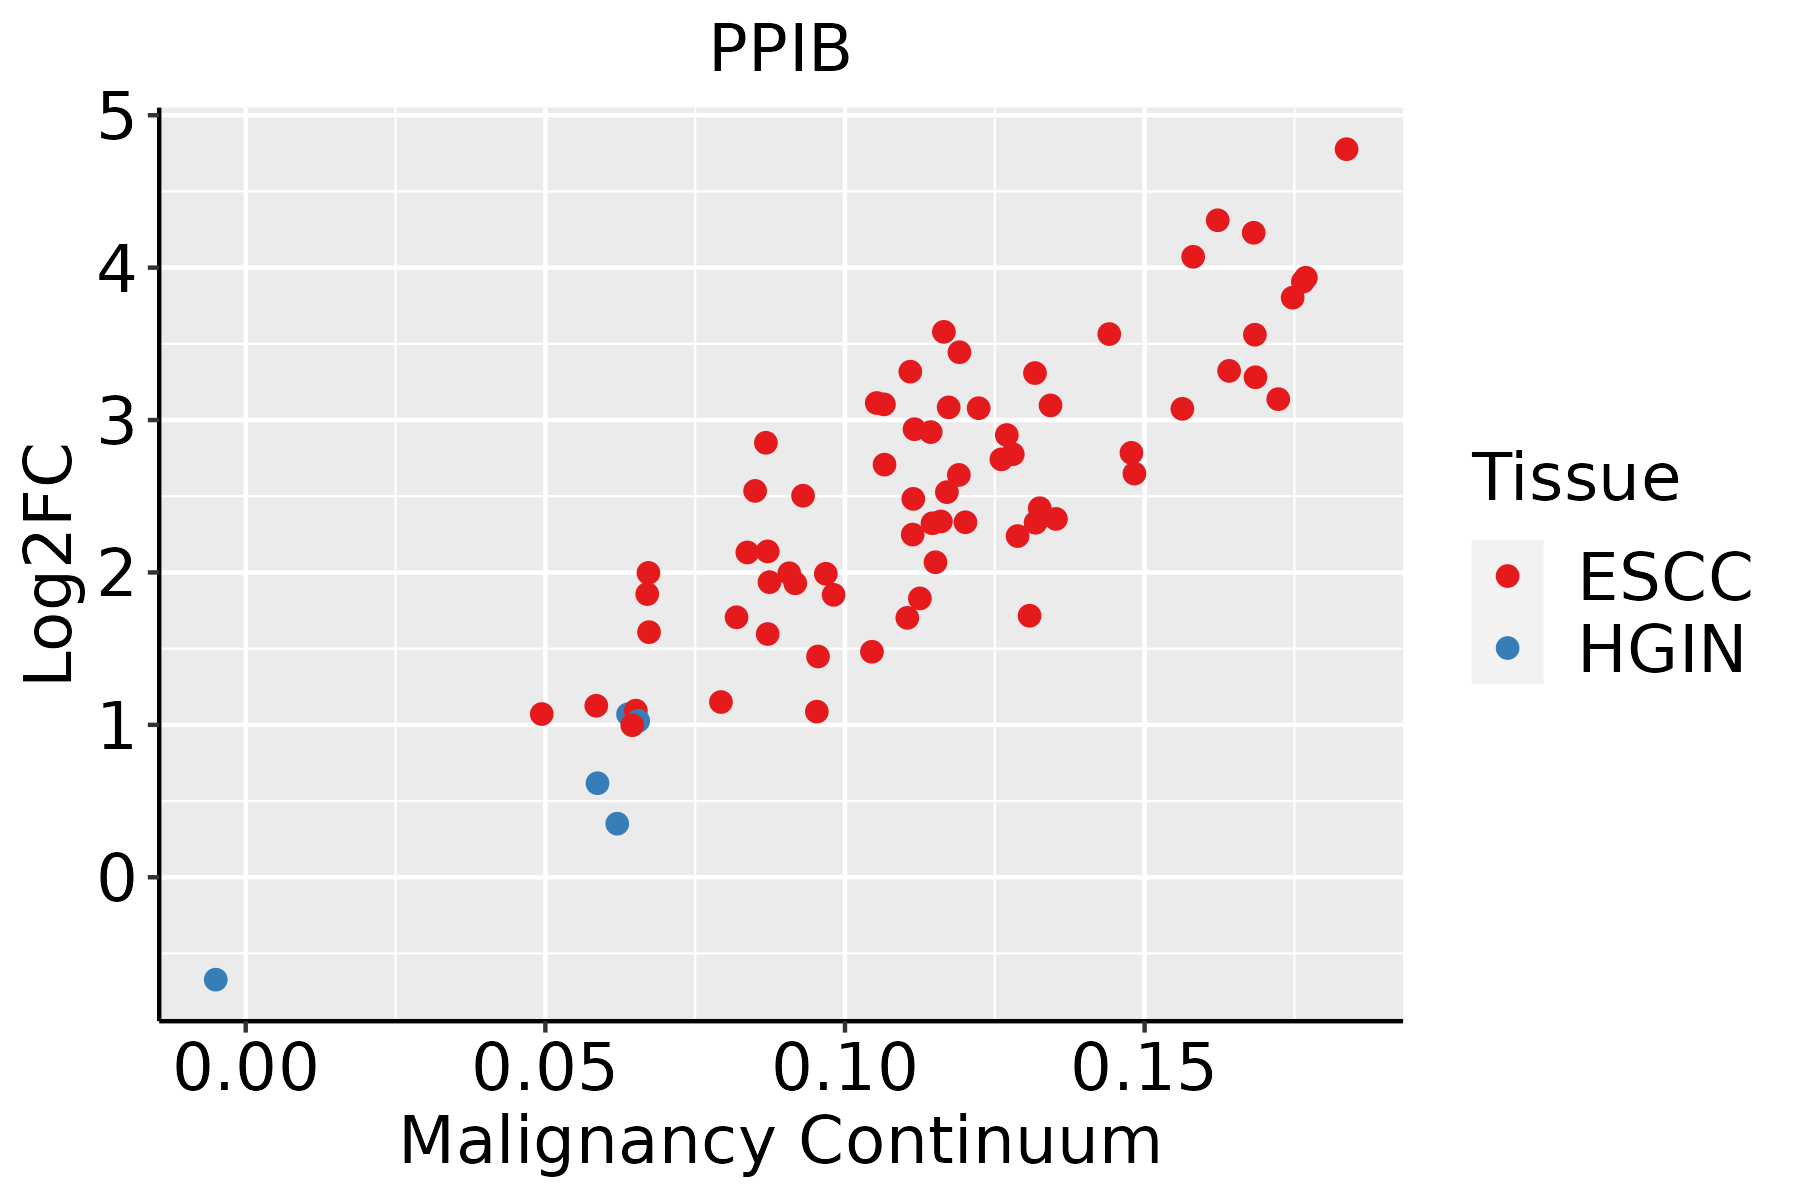 | ESCC: Esophageal squamous cell carcinoma |
| HGIN: High-grade intraepithelial neoplasias | ||
| LGIN: Low-grade intraepithelial neoplasias | ||
| GC | 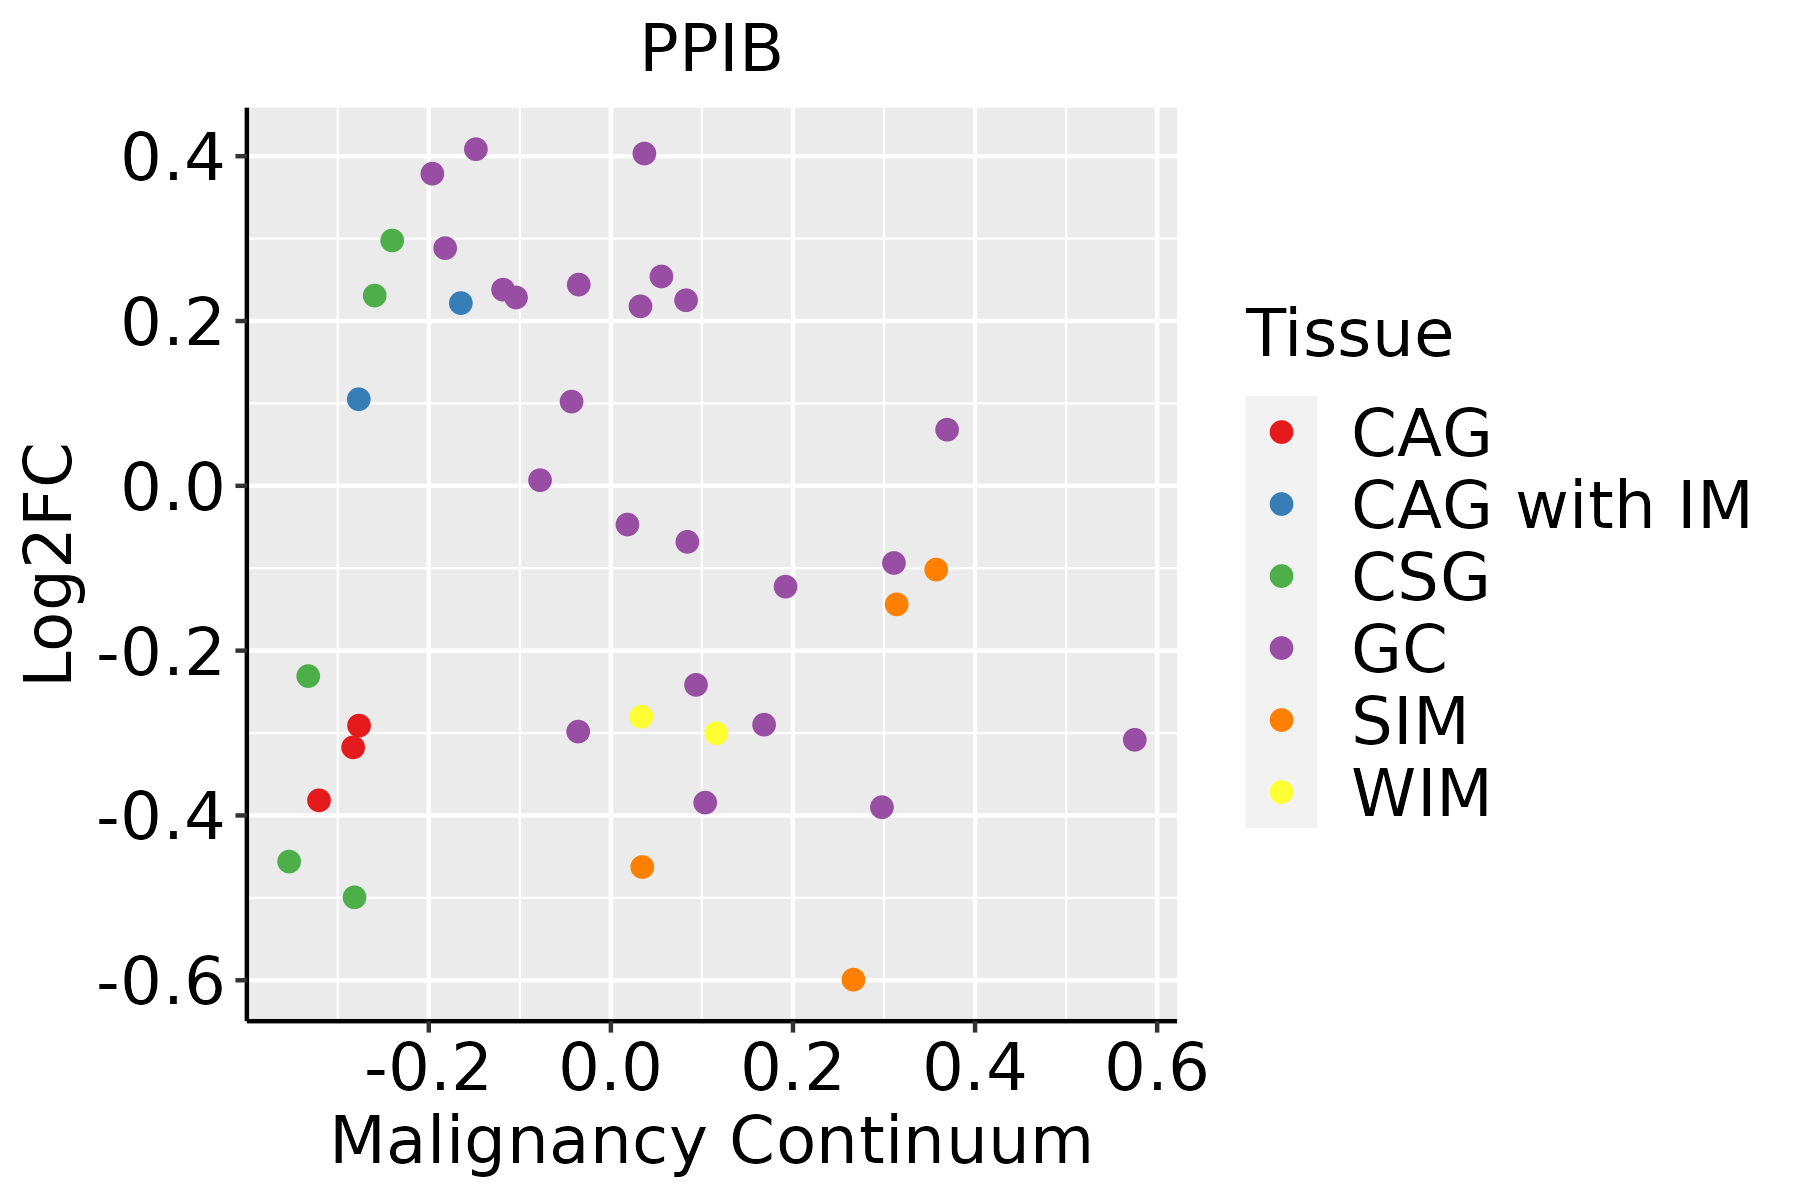 | CAG: Chronic atrophic gastritis |
| CAG with IM: Chronic atrophic gastritis with intestinal metaplasia | ||
| CSG: Chronic superficial gastritis | ||
| GC: Gastric cancer | ||
| SIM: Severe intestinal metaplasia | ||
| WIM: Wild intestinal metaplasia | ||
| Liver | 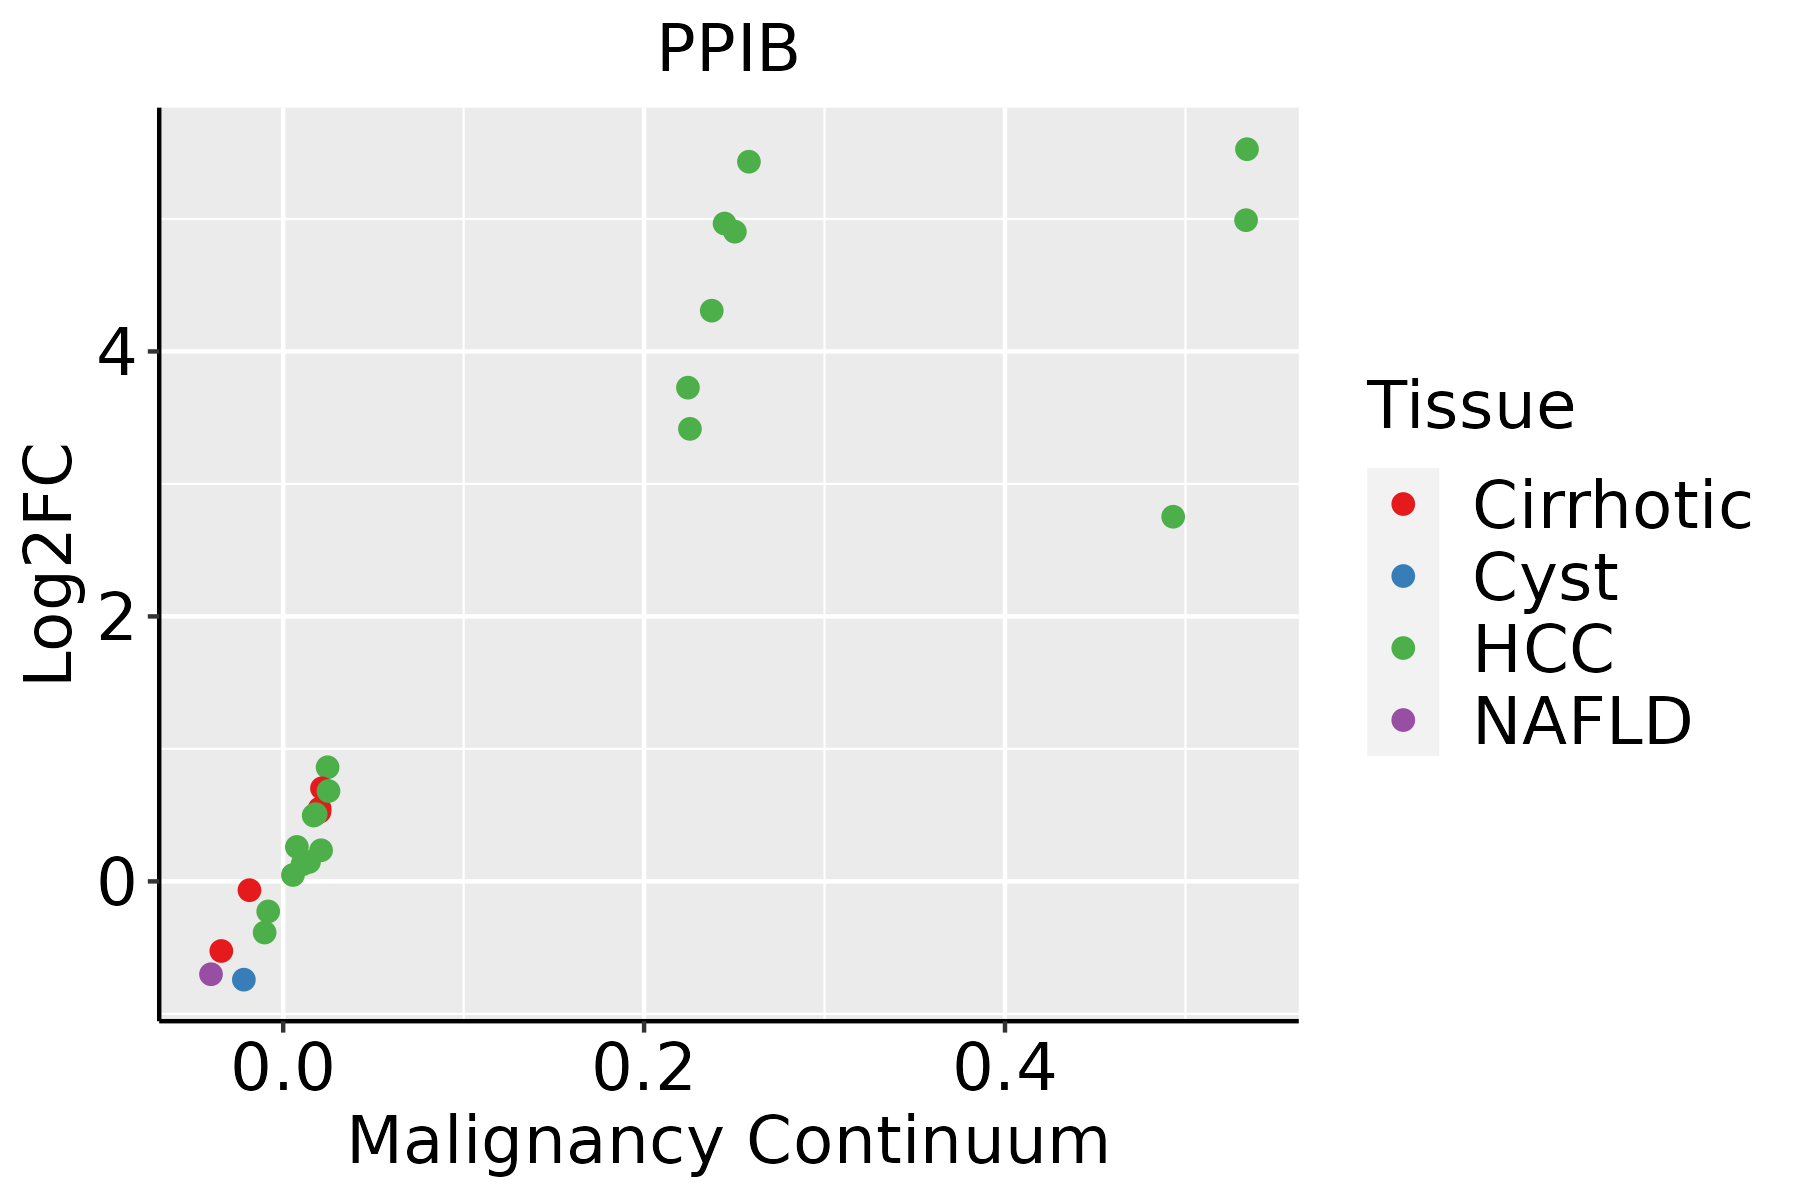 | HCC: Hepatocellular carcinoma |
| NAFLD: Non-alcoholic fatty liver disease | ||
| Lung | 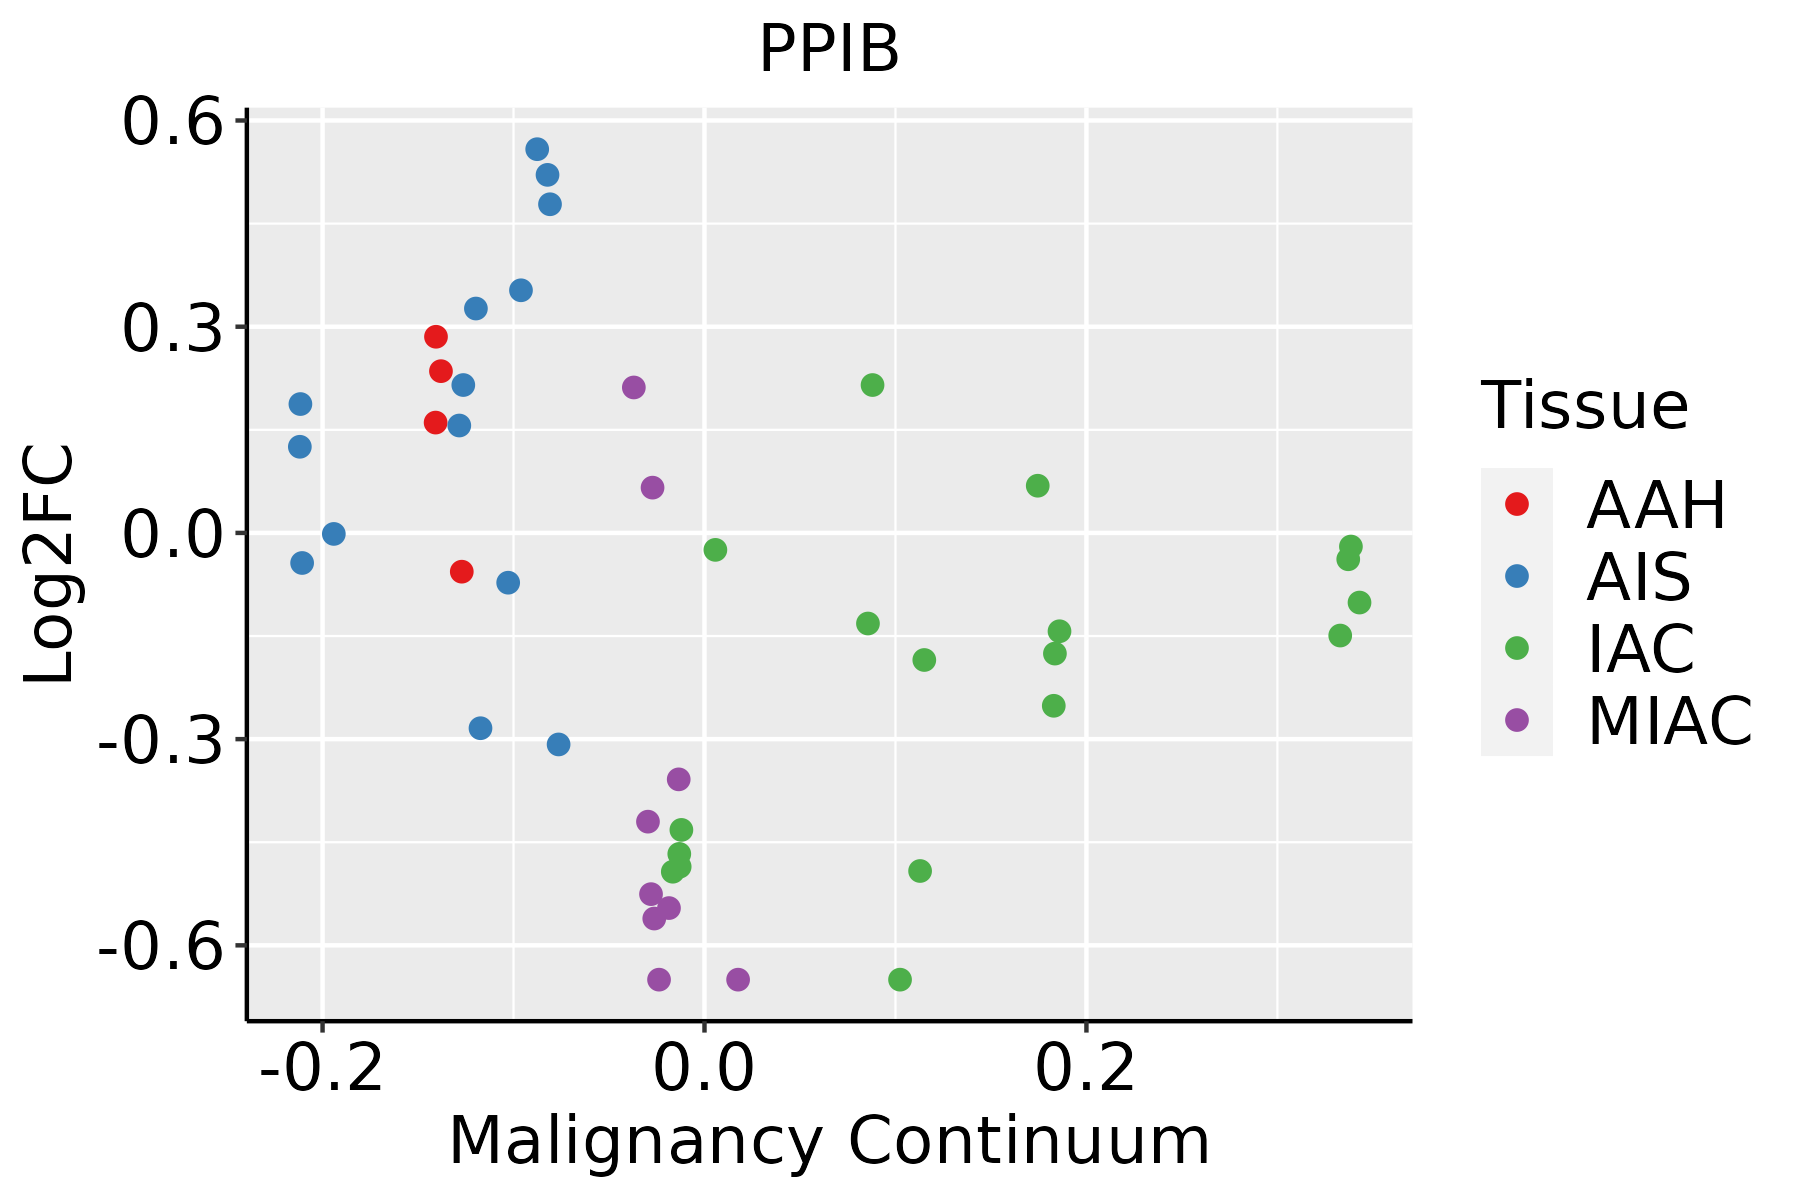 | AAH: Atypical adenomatous hyperplasia |
| AIS: Adenocarcinoma in situ | ||
| IAC: Invasive lung adenocarcinoma | ||
| MIA: Minimally invasive adenocarcinoma | ||
| Oral Cavity | 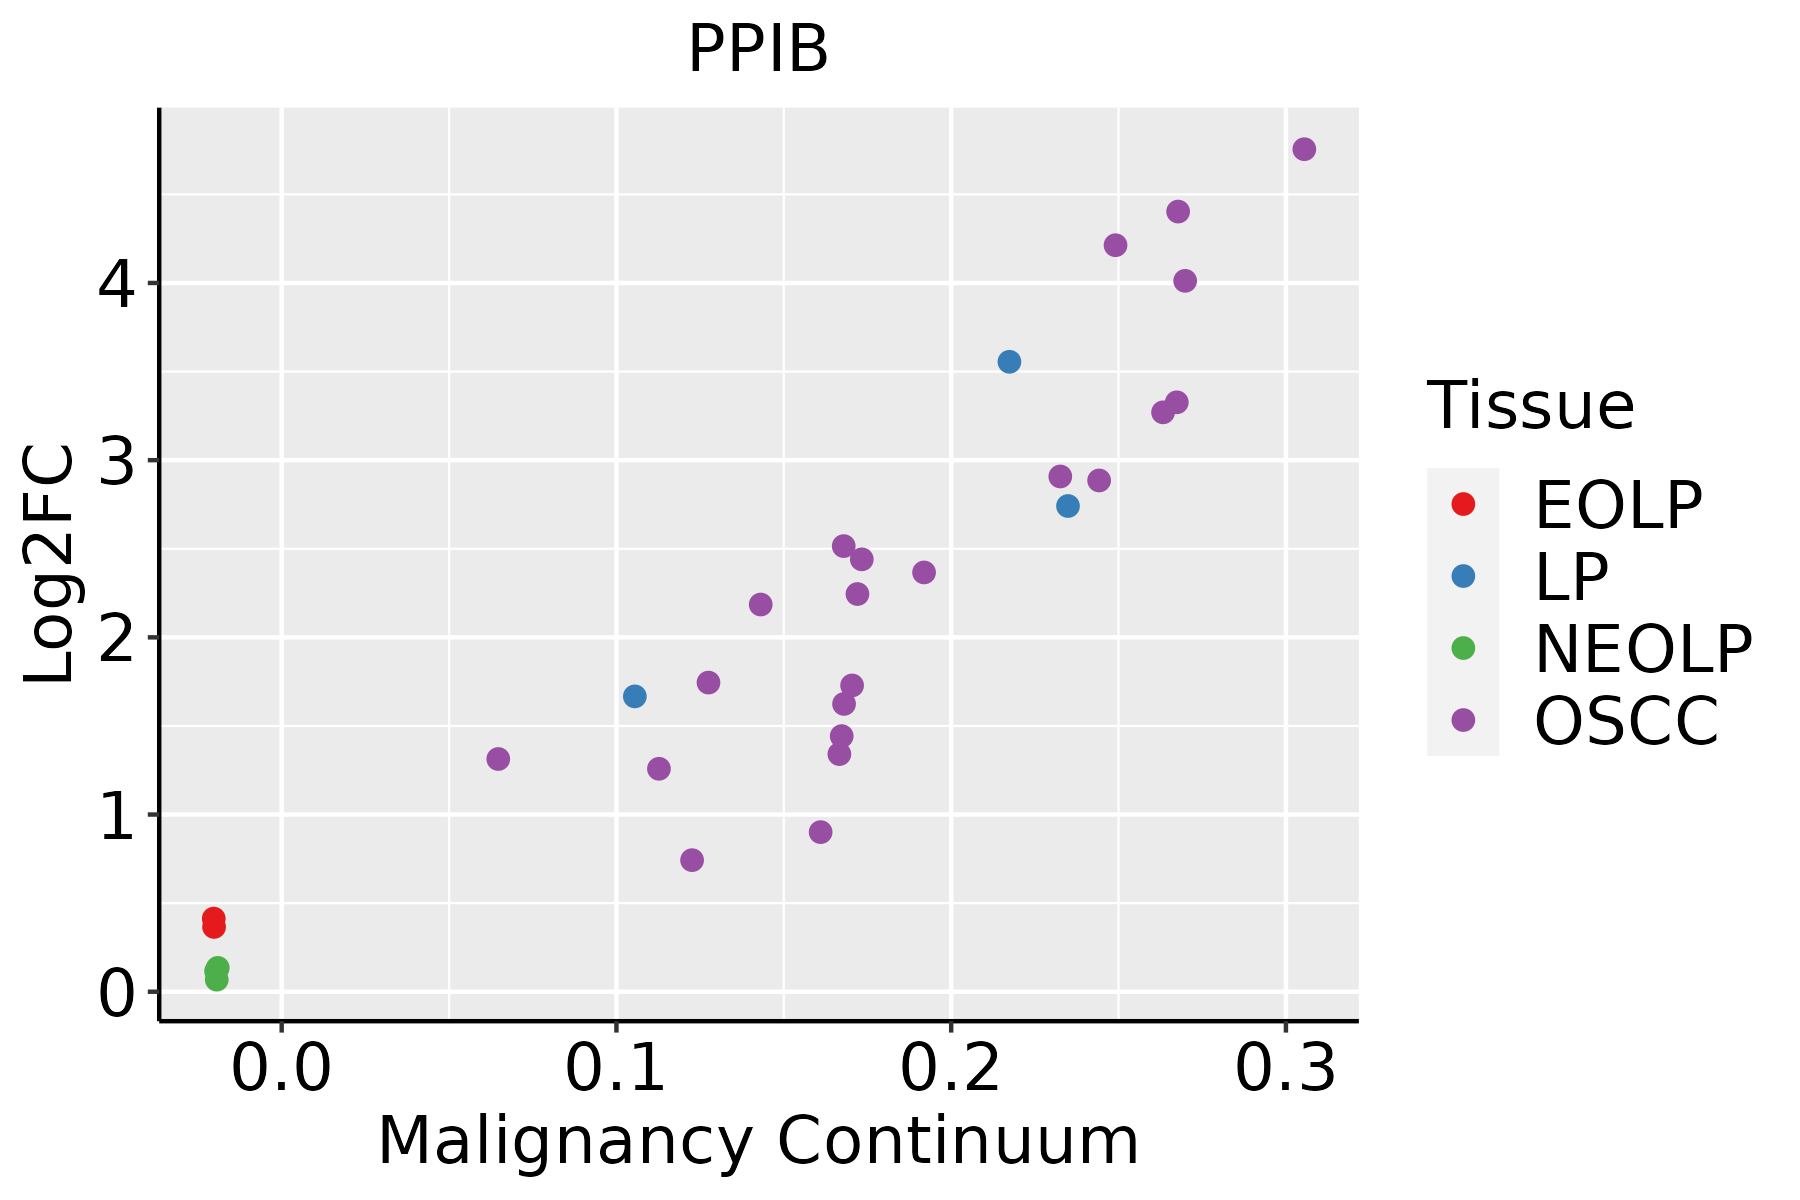 | EOLP: Erosive Oral lichen planus |
| LP: leukoplakia | ||
| NEOLP: Non-erosive oral lichen planus | ||
| OSCC: Oral squamous cell carcinoma | ||
| Prostate | 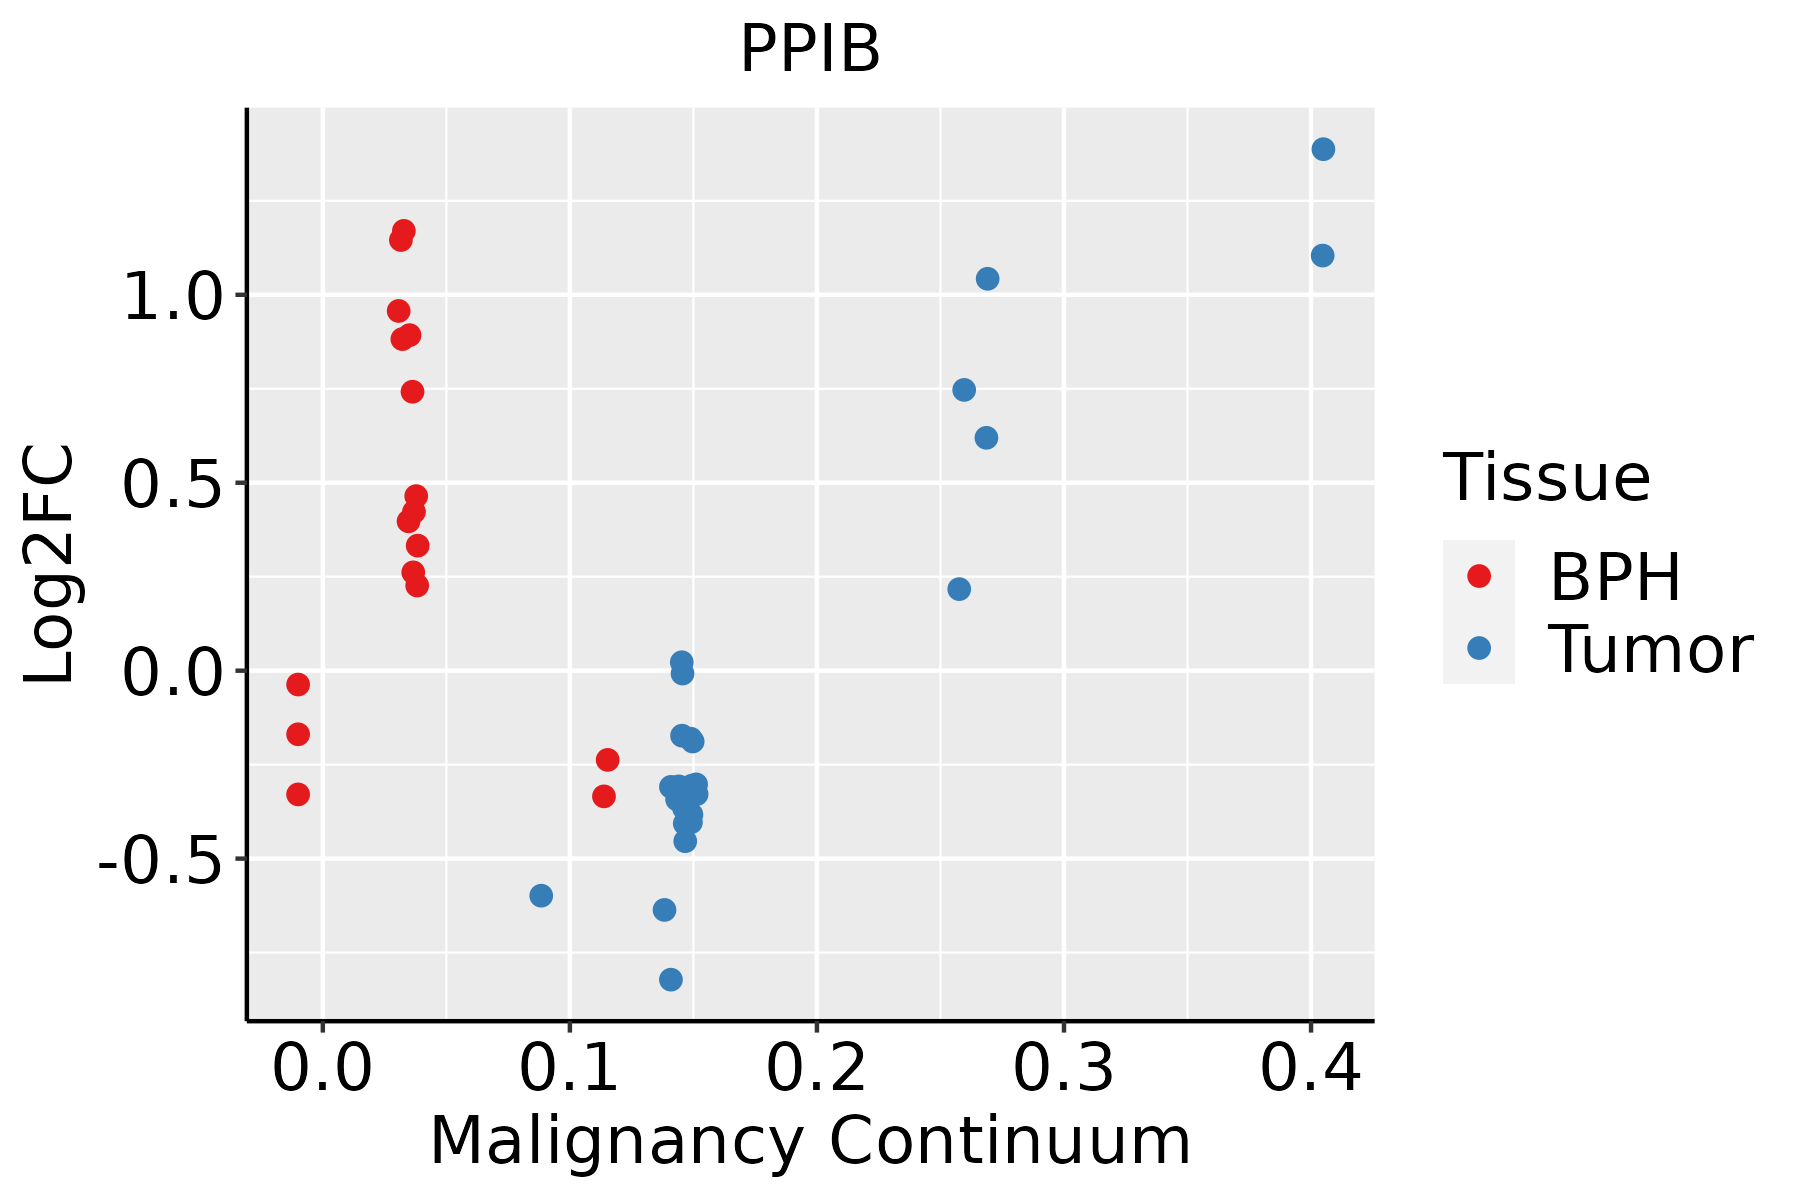 | BPH: Benign Prostatic Hyperplasia |
| Skin | 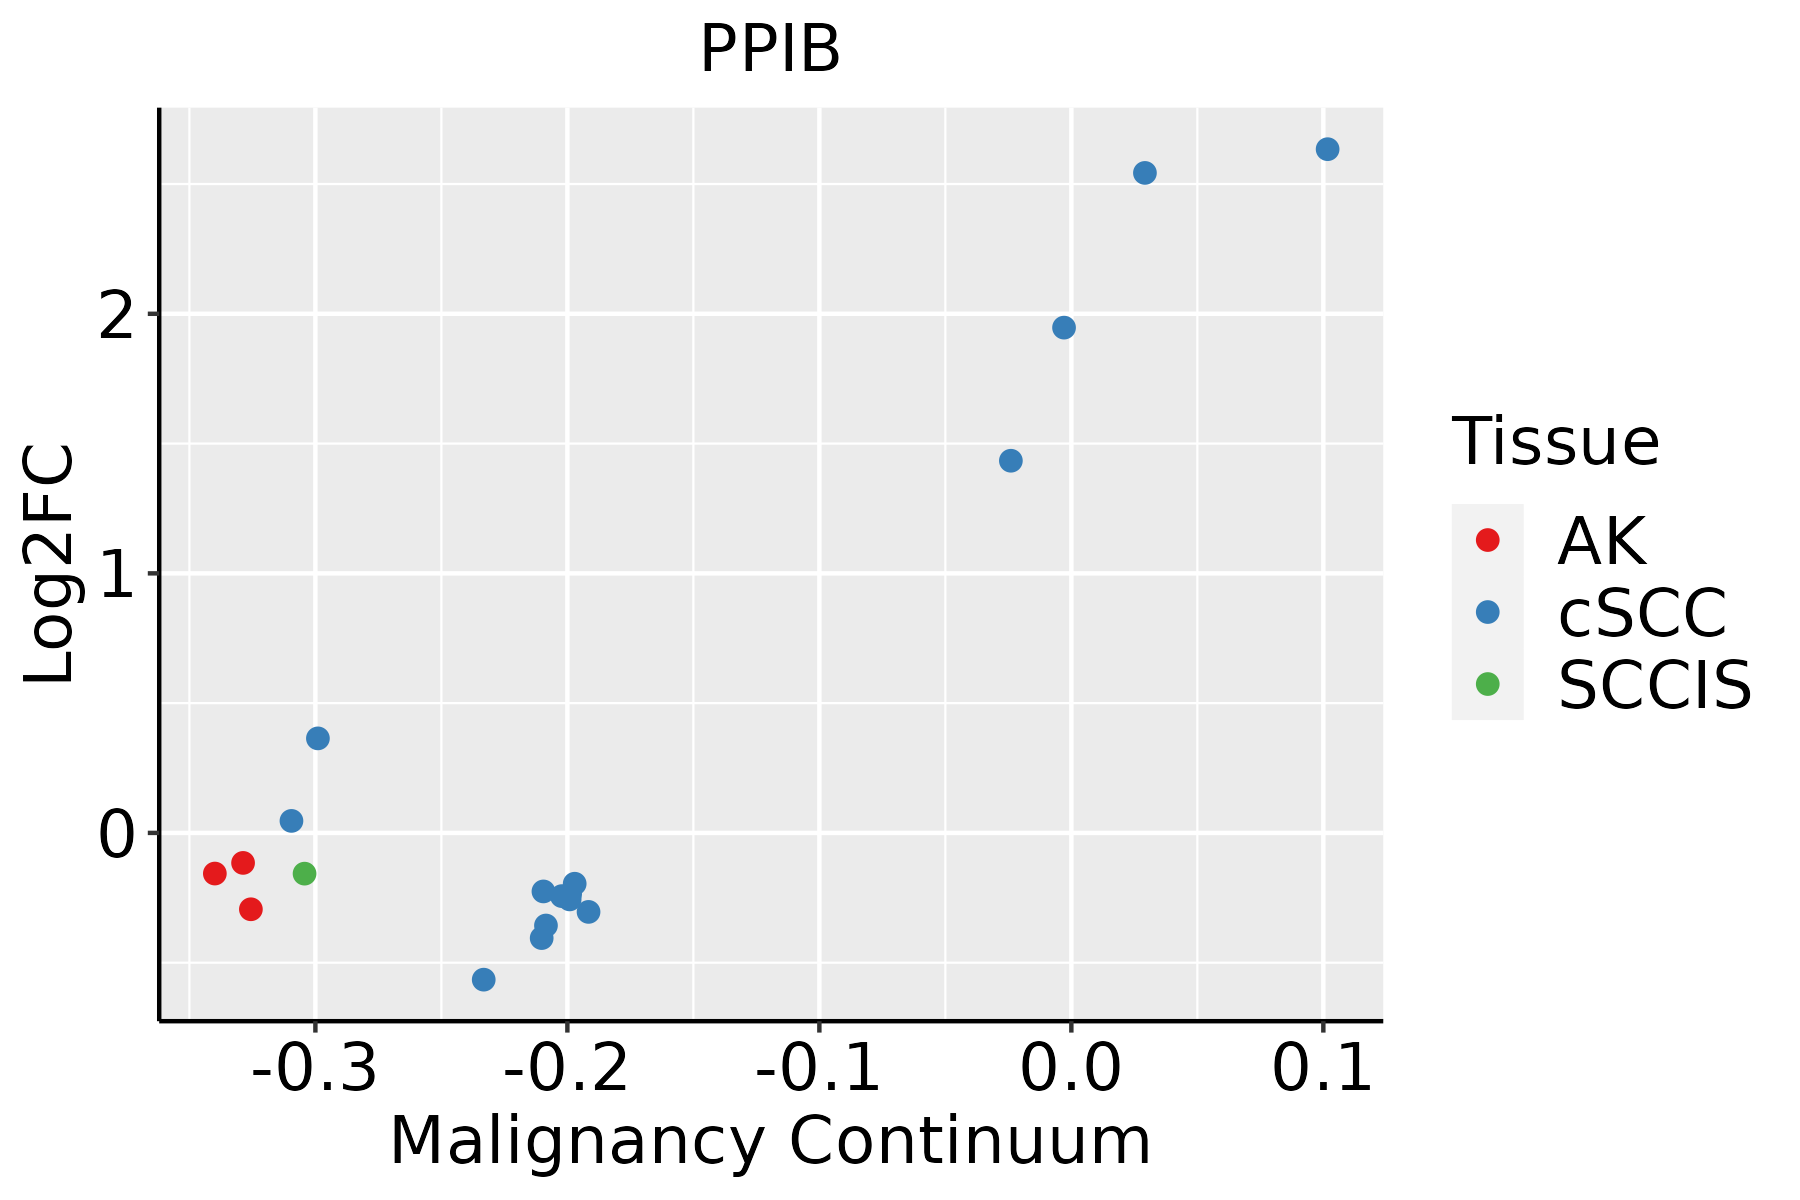 | AK: Actinic keratosis |
| cSCC: Cutaneous squamous cell carcinoma | ||
| SCCIS:squamous cell carcinoma in situ | ||
| Thyroid | 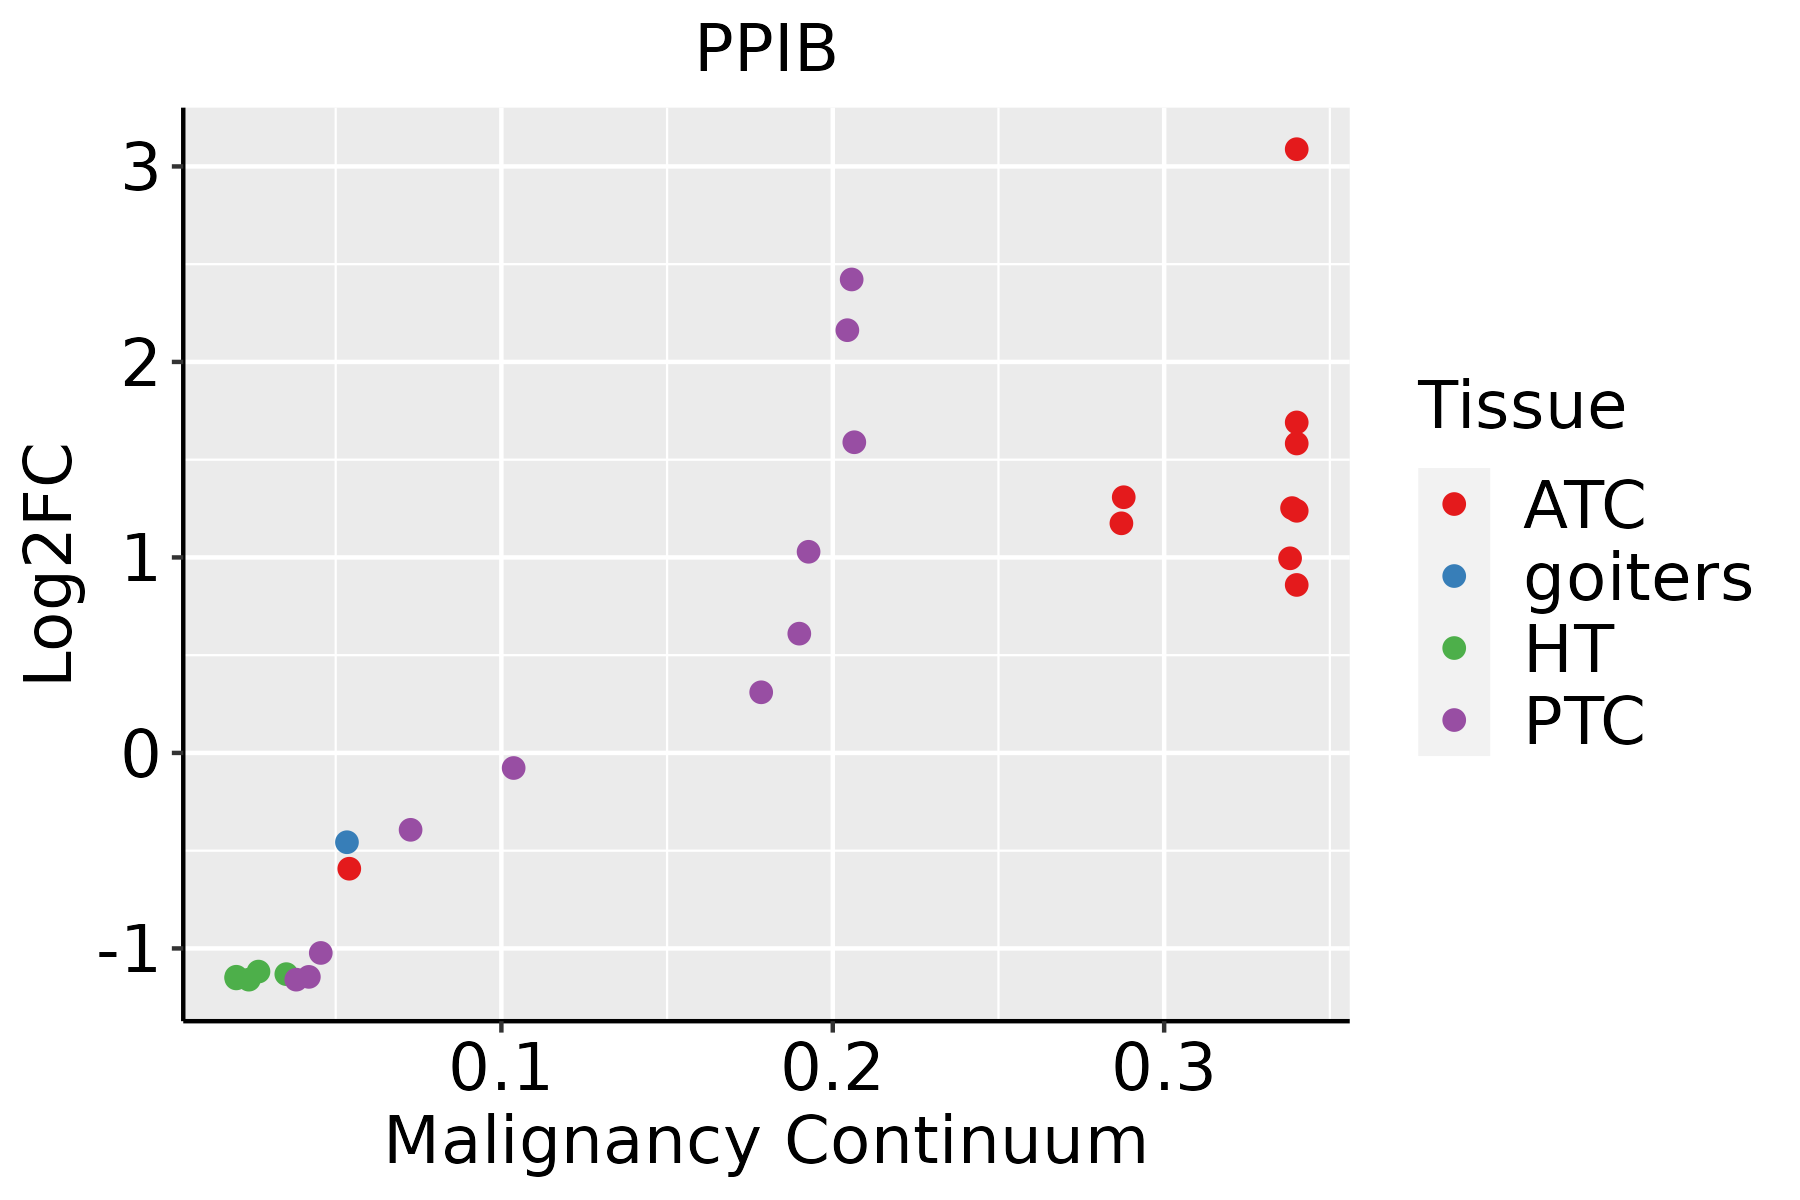 | ATC: Anaplastic thyroid cancer |
| HT: Hashimoto's thyroiditis | ||
| PTC: Papillary thyroid cancer |
| ∗log2FC in expression of this searched gene in stem-like cells from each diseased tissue sample relative to stem-like cells in normal samples in each tissue plotted against the malignancy continuum. Samples are colored based on if they are from different disease stage. |
Top |
Malignant transformation related pathway analysis |
| Find out the enriched GO biological processes and KEGG pathways involved in transition from healthy to precancer to cancer |
| Tissue | Disease Stage | Enriched GO biological Processes |
| Colorectum | AD |  |
| Colorectum | SER |  |
| Colorectum | MSS |  |
| Colorectum | MSI-H |  |
| Colorectum | FAP |  |
| ∗Top 15 enriched GO BP terms are showed in the bar plot of each disease state in each tissue. Each row represents a significant GO biological process which is colored according to the -log10(p.adjust). |
| Page: 1 2 3 4 5 6 7 8 9 |
| GO ID | Tissue | Disease Stage | Description | Gene Ratio | Bg Ratio | pvalue | p.adjust | Count |
| GO:00975302 | Stomach | CSG | granulocyte migration | 19/1034 | 148/18723 | 5.21e-04 | 7.89e-03 | 19 |
| GO:00603262 | Stomach | CSG | cell chemotaxis | 31/1034 | 310/18723 | 1.04e-03 | 1.33e-02 | 31 |
| GO:00305932 | Stomach | CSG | neutrophil chemotaxis | 14/1034 | 103/18723 | 1.57e-03 | 1.75e-02 | 14 |
| GO:19902662 | Stomach | CSG | neutrophil migration | 15/1034 | 122/18723 | 2.97e-03 | 2.77e-02 | 15 |
| GO:00182081 | Stomach | CSG | peptidyl-proline modification | 9/1034 | 58/18723 | 4.28e-03 | 3.68e-02 | 9 |
| GO:000645731 | Stomach | CAG | protein folding | 36/552 | 212/18723 | 1.36e-17 | 3.03e-14 | 36 |
| GO:006107731 | Stomach | CAG | chaperone-mediated protein folding | 17/552 | 67/18723 | 6.48e-12 | 2.89e-09 | 17 |
| GO:001603231 | Stomach | CAG | viral process | 37/552 | 415/18723 | 2.37e-09 | 4.06e-07 | 37 |
| GO:001905831 | Stomach | CAG | viral life cycle | 31/552 | 317/18723 | 5.55e-09 | 7.99e-07 | 31 |
| GO:004440331 | Stomach | CAG | biological process involved in symbiotic interaction | 28/552 | 290/18723 | 4.03e-08 | 4.39e-06 | 28 |
| GO:005082131 | Stomach | CAG | protein stabilization | 22/552 | 191/18723 | 5.27e-08 | 5.60e-06 | 22 |
| GO:003164731 | Stomach | CAG | regulation of protein stability | 28/552 | 298/18723 | 7.20e-08 | 7.30e-06 | 28 |
| GO:00305953 | Stomach | CAG | leukocyte chemotaxis | 19/552 | 230/18723 | 5.49e-05 | 1.60e-03 | 19 |
| GO:001907931 | Stomach | CAG | viral genome replication | 13/552 | 131/18723 | 1.34e-04 | 3.22e-03 | 13 |
| GO:00603263 | Stomach | CAG | cell chemotaxis | 22/552 | 310/18723 | 1.41e-04 | 3.32e-03 | 22 |
| GO:00509003 | Stomach | CAG | leukocyte migration | 24/552 | 369/18723 | 2.68e-04 | 5.22e-03 | 24 |
| GO:00975293 | Stomach | CAG | myeloid leukocyte migration | 17/552 | 220/18723 | 2.96e-04 | 5.63e-03 | 17 |
| GO:00716213 | Stomach | CAG | granulocyte chemotaxis | 12/552 | 125/18723 | 3.27e-04 | 6.06e-03 | 12 |
| GO:00975303 | Stomach | CAG | granulocyte migration | 12/552 | 148/18723 | 1.48e-03 | 1.83e-02 | 12 |
| GO:00182082 | Stomach | CAG | peptidyl-proline modification | 7/552 | 58/18723 | 1.52e-03 | 1.86e-02 | 7 |
| Page: 1 2 3 4 5 6 7 8 9 10 11 12 13 14 15 16 17 18 19 20 21 22 23 24 25 26 27 28 29 |
| Pathway ID | Tissue | Disease Stage | Description | Gene Ratio | Bg Ratio | pvalue | p.adjust | qvalue | Count |
| Page: 1 |
Top |
Cell-cell communication analysis |
| Identification of potential cell-cell interactions between two cell types and their ligand-receptor pairs for different disease states |
| Ligand | Receptor | LRpair | Pathway | Tissue | Disease Stage |
| Page: 1 |
Top |
Single-cell gene regulatory network inference analysis |
| Find out the significant the regulons (TFs) and the target genes of each regulon across cell types for different disease states |
| TF | Cell Type | Tissue | Disease Stage | Target Gene | RSS | Regulon Activity |
| ∗The dot plots of a searched regulon are shown for all cell subpopulations in each disease state of each tissue based on the regulon specific score inferred using pySCENIC and by calculating the average expression. |
| Page: 1 |
Top |
Somatic mutation of malignant transformation related genes |
| Annotation of somatic variants for genes involved in malignant transformation |
| Hugo Symbol | Variant Class | Variant Classification | dbSNP RS | HGVSc | HGVSp | HGVSp Short | SWISSPROT | BIOTYPE | SIFT | PolyPhen | Tumor Sample Barcode | Tissue | Histology | Sex | Age | Stage | Therapy Types | Drugs | Outcome |
| PPIB | SNV | Missense_Mutation | c.394C>T | p.His132Tyr | p.H132Y | P23284 | protein_coding | deleterious(0) | probably_damaging(0.993) | TCGA-AN-A03X-01 | Breast | breast invasive carcinoma | Female | >=65 | I/II | Unknown | Unknown | SD | |
| PPIB | SNV | Missense_Mutation | novel | c.353T>C | p.Ile118Thr | p.I118T | P23284 | protein_coding | deleterious(0) | probably_damaging(0.993) | TCGA-D8-A1X5-01 | Breast | breast invasive carcinoma | Female | >=65 | III/IV | Hormone Therapy | tamoxiphen | SD |
| PPIB | SNV | Missense_Mutation | rs757275030 | c.283N>T | p.Arg95Cys | p.R95C | P23284 | protein_coding | deleterious(0) | probably_damaging(0.998) | TCGA-AZ-4315-01 | Colorectum | colon adenocarcinoma | Male | <65 | I/II | Unknown | Unknown | SD |
| PPIB | SNV | Missense_Mutation | c.268A>G | p.Asn90Asp | p.N90D | P23284 | protein_coding | tolerated(0.06) | benign(0) | TCGA-CK-4951-01 | Colorectum | colon adenocarcinoma | Female | >=65 | I/II | Unknown | Unknown | PD | |
| PPIB | SNV | Missense_Mutation | novel | c.469G>A | p.Val157Ile | p.V157I | P23284 | protein_coding | tolerated(0.06) | benign(0.003) | TCGA-A5-A0VP-01 | Endometrium | uterine corpus endometrioid carcinoma | Female | >=65 | I/II | Unknown | Unknown | SD |
| PPIB | SNV | Missense_Mutation | novel | c.92C>A | p.Ser31Tyr | p.S31Y | P23284 | protein_coding | tolerated(0.07) | possibly_damaging(0.642) | TCGA-A5-A2K5-01 | Endometrium | uterine corpus endometrioid carcinoma | Female | >=65 | I/II | Unknown | Unknown | SD |
| PPIB | SNV | Missense_Mutation | c.279N>A | p.Phe93Leu | p.F93L | P23284 | protein_coding | deleterious(0) | benign(0.244) | TCGA-AP-A059-01 | Endometrium | uterine corpus endometrioid carcinoma | Female | >=65 | I/II | Unknown | Unknown | SD | |
| PPIB | SNV | Missense_Mutation | rs759753798 | c.640G>A | p.Ala214Thr | p.A214T | P23284 | protein_coding | tolerated(0.2) | benign(0.075) | TCGA-AX-A1CE-01 | Endometrium | uterine corpus endometrioid carcinoma | Female | <65 | I/II | Unspecific | Paclitaxel | SD |
| PPIB | SNV | Missense_Mutation | novel | c.337N>G | p.Thr113Ala | p.T113A | P23284 | protein_coding | deleterious(0) | benign(0.003) | TCGA-AX-A2HJ-01 | Endometrium | uterine corpus endometrioid carcinoma | Female | <65 | I/II | Unknown | Unknown | SD |
| PPIB | SNV | Missense_Mutation | novel | c.404N>T | p.Pro135Leu | p.P135L | P23284 | protein_coding | deleterious(0.01) | possibly_damaging(0.455) | TCGA-B5-A3FC-01 | Endometrium | uterine corpus endometrioid carcinoma | Female | <65 | I/II | Unknown | Unknown | SD |
| Page: 1 2 |
Top |
Related drugs of malignant transformation related genes |
| Identification of chemicals and drugs interact with genes involved in malignant transfromation |
| (DGIdb 4.0) |
| Entrez ID | Symbol | Category | Interaction Types | Drug Claim Name | Drug Name | PMIDs |
| 5479 | PPIB | ENZYME, DRUGGABLE GENOME | L-Proline | PROLINE | ||
| 5479 | PPIB | ENZYME, DRUGGABLE GENOME | CYCLOSPORIN A | 9841882 |
| Page: 1 |

Copyright 2023-Present -The University of Texas Health Science Center at Houston |