
|
|||||
|
 | |
| |
| |
| |
| |
| |
|
Gene: LGR4 |
Gene summary for LGR4 |
| Gene information | Species | Human | Gene symbol | LGR4 | Gene ID | 55366 |
| Gene name | leucine rich repeat containing G protein-coupled receptor 4 | |
| Gene Alias | BNMD17 | |
| Cytomap | 11p14.1 | |
| Gene Type | protein-coding | GO ID | GO:0000003 | UniProtAcc | Q59ER8 |
Top |
Malignant transformation analysis |
| Identification of the aberrant gene expression in precancerous and cancerous lesions by comparing the gene expression of stem-like cells in diseased tissues with normal stem cells |
| Entrez ID | Symbol | Replicates | Species | Organ | Tissue | Adj P-value | Log2FC | Malignancy |
| 55366 | LGR4 | CA_HPV_3 | Human | Cervix | CC | 4.30e-02 | 1.27e-01 | 0.0414 |
| 55366 | LGR4 | CCI_2 | Human | Cervix | CC | 9.15e-08 | 1.26e+00 | 0.5249 |
| 55366 | LGR4 | CCI_3 | Human | Cervix | CC | 6.74e-16 | 1.03e+00 | 0.516 |
| 55366 | LGR4 | HTA11_3410_2000001011 | Human | Colorectum | AD | 3.44e-16 | -6.40e-01 | 0.0155 |
| 55366 | LGR4 | HTA11_347_2000001011 | Human | Colorectum | AD | 3.57e-10 | 7.01e-01 | -0.1954 |
| 55366 | LGR4 | HTA11_411_2000001011 | Human | Colorectum | SER | 3.07e-02 | 6.68e-01 | -0.2602 |
| 55366 | LGR4 | HTA11_866_3004761011 | Human | Colorectum | AD | 5.70e-12 | -6.48e-01 | 0.096 |
| 55366 | LGR4 | HTA11_10711_2000001011 | Human | Colorectum | AD | 1.25e-09 | -5.88e-01 | 0.0338 |
| 55366 | LGR4 | HTA11_7696_3000711011 | Human | Colorectum | AD | 3.48e-04 | -4.70e-01 | 0.0674 |
| 55366 | LGR4 | HTA11_7469_2000001011 | Human | Colorectum | AD | 8.95e-04 | -3.38e-01 | -0.0124 |
| 55366 | LGR4 | HTA11_6818_2000001021 | Human | Colorectum | AD | 1.14e-06 | -5.77e-01 | 0.0588 |
| 55366 | LGR4 | HTA11_99999970781_79442 | Human | Colorectum | MSS | 8.93e-20 | -6.47e-01 | 0.294 |
| 55366 | LGR4 | HTA11_99999971662_82457 | Human | Colorectum | MSS | 3.25e-08 | -4.64e-01 | 0.3859 |
| 55366 | LGR4 | HTA11_99999973899_84307 | Human | Colorectum | MSS | 5.41e-12 | -8.76e-01 | 0.2585 |
| 55366 | LGR4 | HTA11_99999974143_84620 | Human | Colorectum | MSS | 1.26e-44 | -9.85e-01 | 0.3005 |
| 55366 | LGR4 | F007 | Human | Colorectum | FAP | 2.09e-02 | -3.76e-01 | 0.1176 |
| 55366 | LGR4 | A001-C-207 | Human | Colorectum | FAP | 1.20e-05 | -4.36e-01 | 0.1278 |
| 55366 | LGR4 | A015-C-203 | Human | Colorectum | FAP | 8.86e-51 | -9.35e-01 | -0.1294 |
| 55366 | LGR4 | A015-C-204 | Human | Colorectum | FAP | 4.38e-14 | -6.60e-01 | -0.0228 |
| 55366 | LGR4 | A014-C-040 | Human | Colorectum | FAP | 2.06e-10 | -8.47e-01 | -0.1184 |
| Page: 1 2 3 4 5 6 |
| Tissue | Expression Dynamics | Abbreviation |
| Cervix | 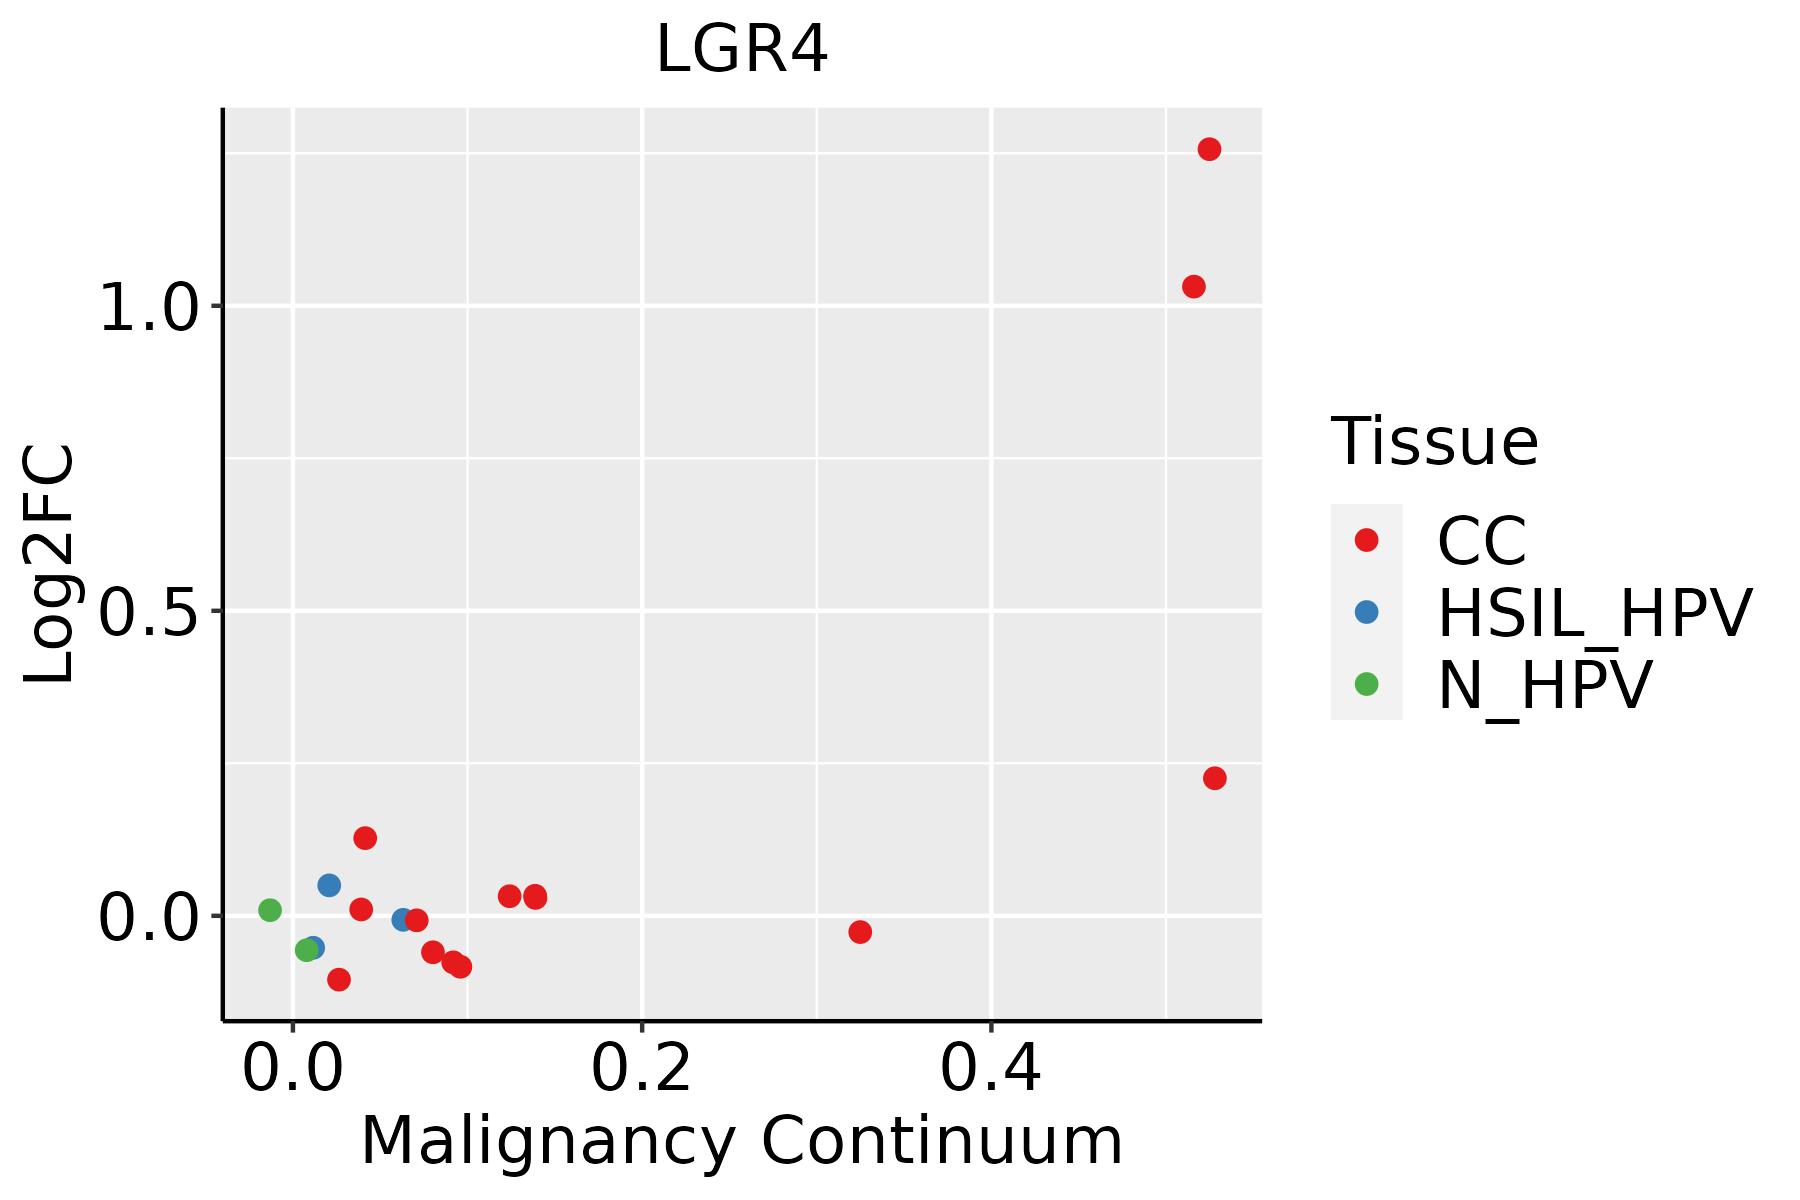 | CC: Cervix cancer |
| HSIL_HPV: HPV-infected high-grade squamous intraepithelial lesions | ||
| N_HPV: HPV-infected normal cervix | ||
| Colorectum (GSE201348) |  | FAP: Familial adenomatous polyposis |
| CRC: Colorectal cancer | ||
| Colorectum (HTA11) |  | AD: Adenomas |
| SER: Sessile serrated lesions | ||
| MSI-H: Microsatellite-high colorectal cancer | ||
| MSS: Microsatellite stable colorectal cancer | ||
| Endometrium | 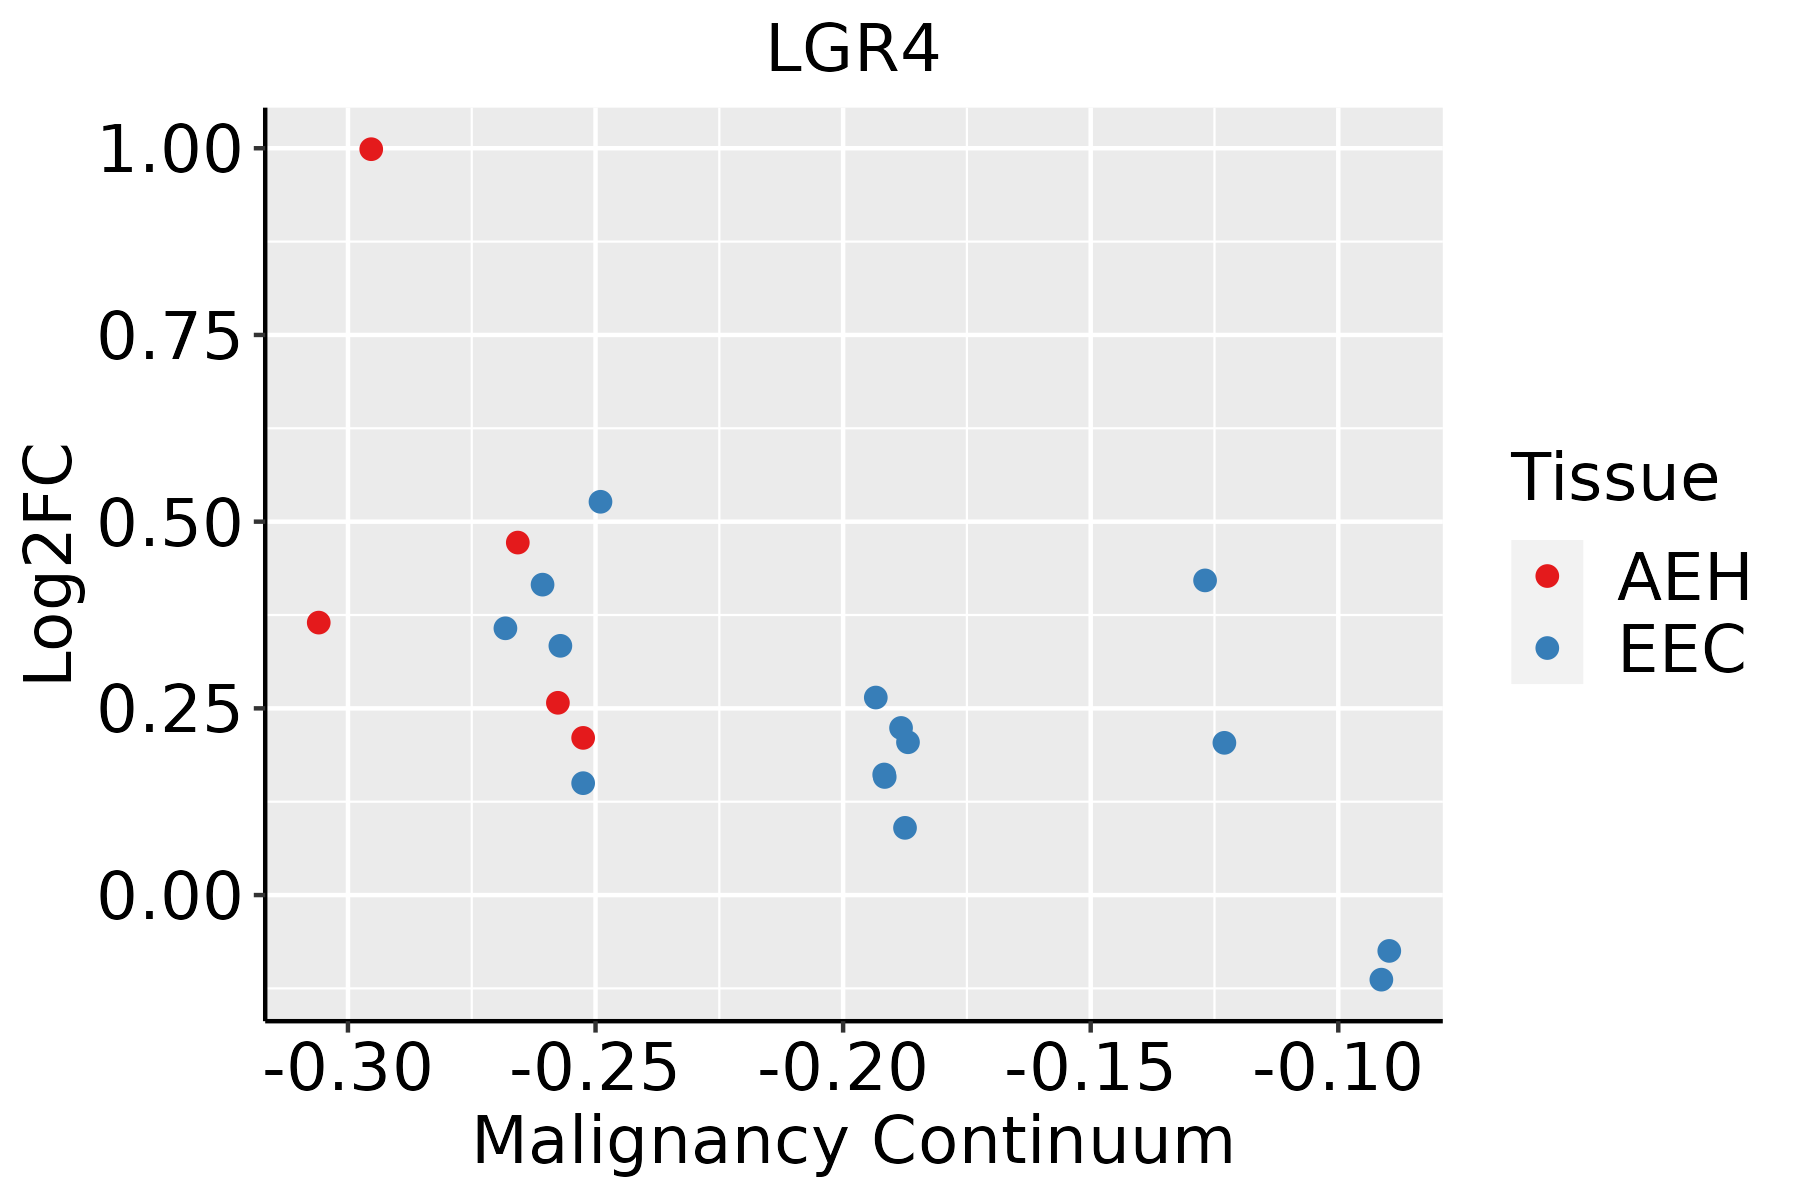 | AEH: Atypical endometrial hyperplasia |
| EEC: Endometrioid Cancer | ||
| Liver | 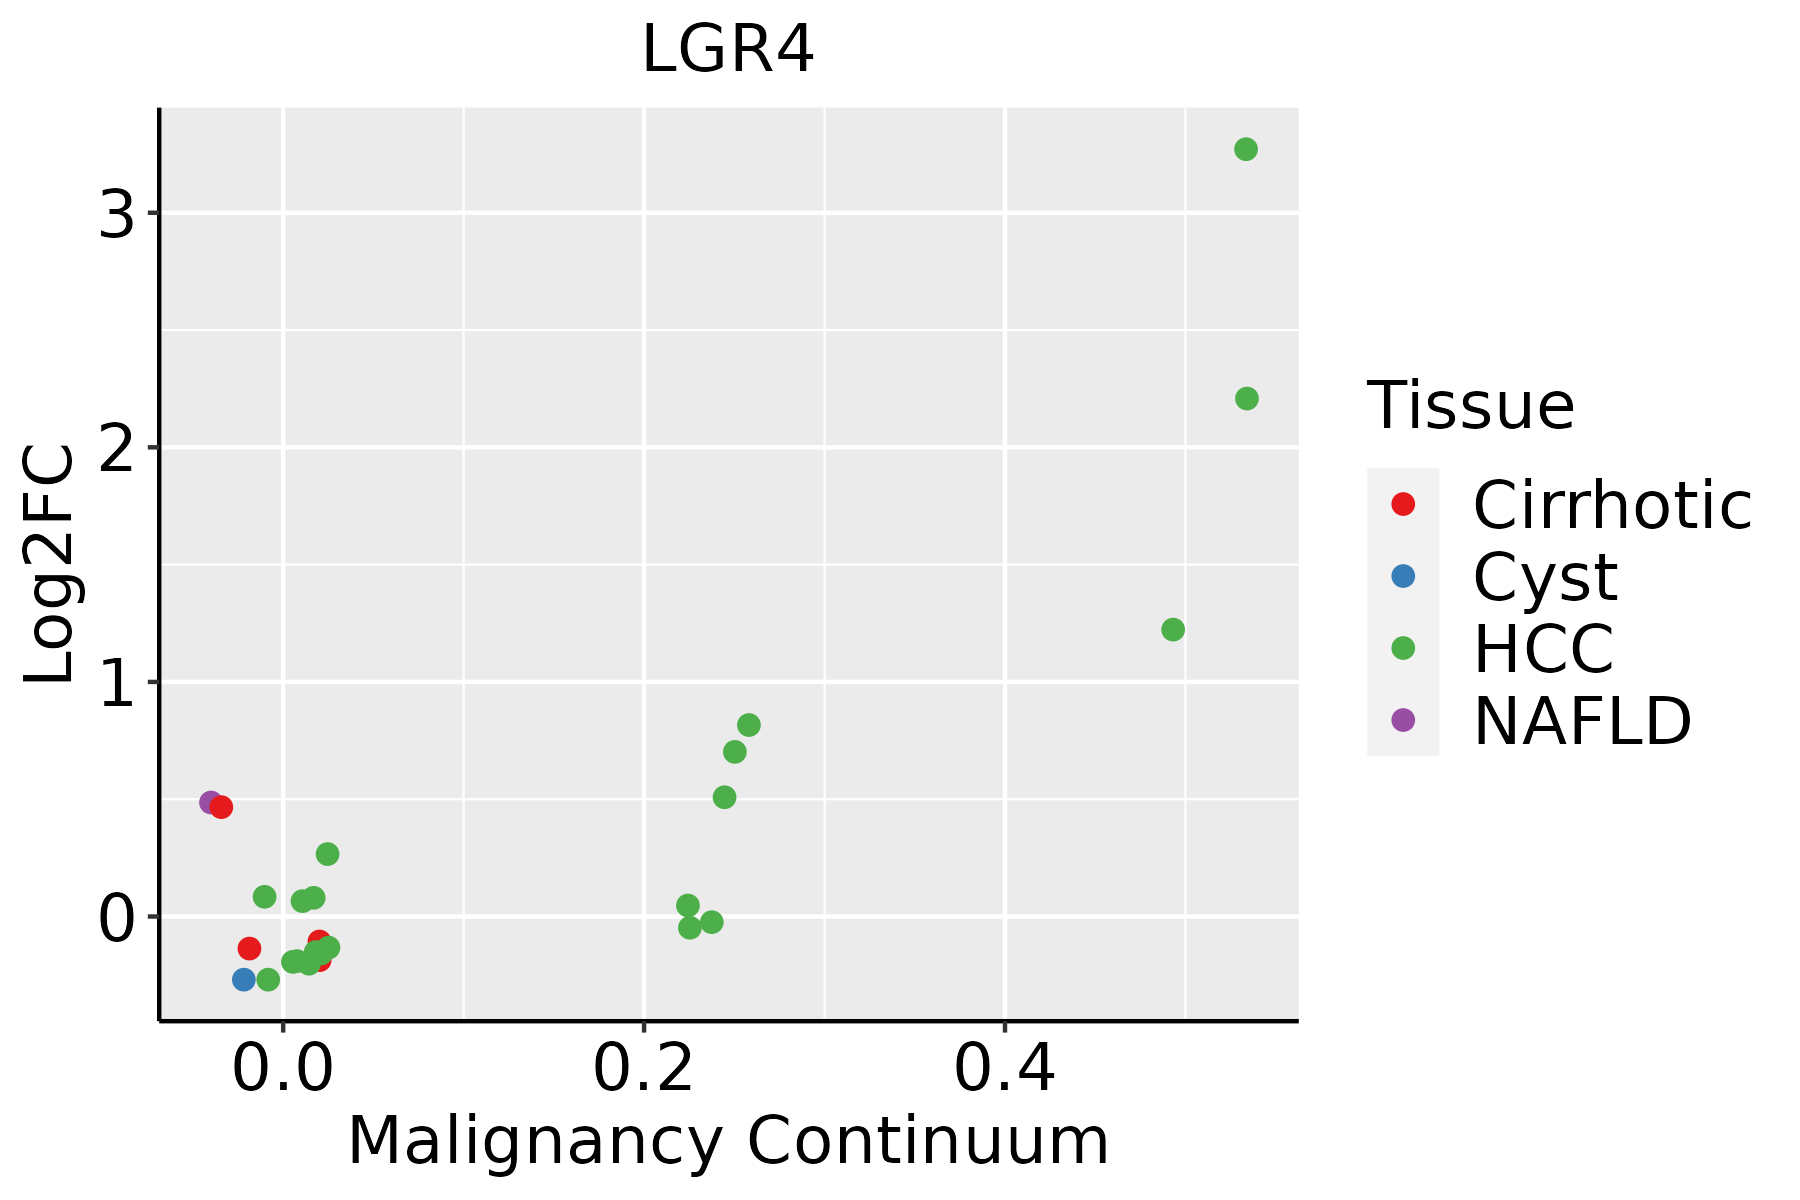 | HCC: Hepatocellular carcinoma |
| NAFLD: Non-alcoholic fatty liver disease | ||
| Lung |  | AAH: Atypical adenomatous hyperplasia |
| AIS: Adenocarcinoma in situ | ||
| IAC: Invasive lung adenocarcinoma | ||
| MIA: Minimally invasive adenocarcinoma | ||
| Prostate |  | BPH: Benign Prostatic Hyperplasia |
| Skin | 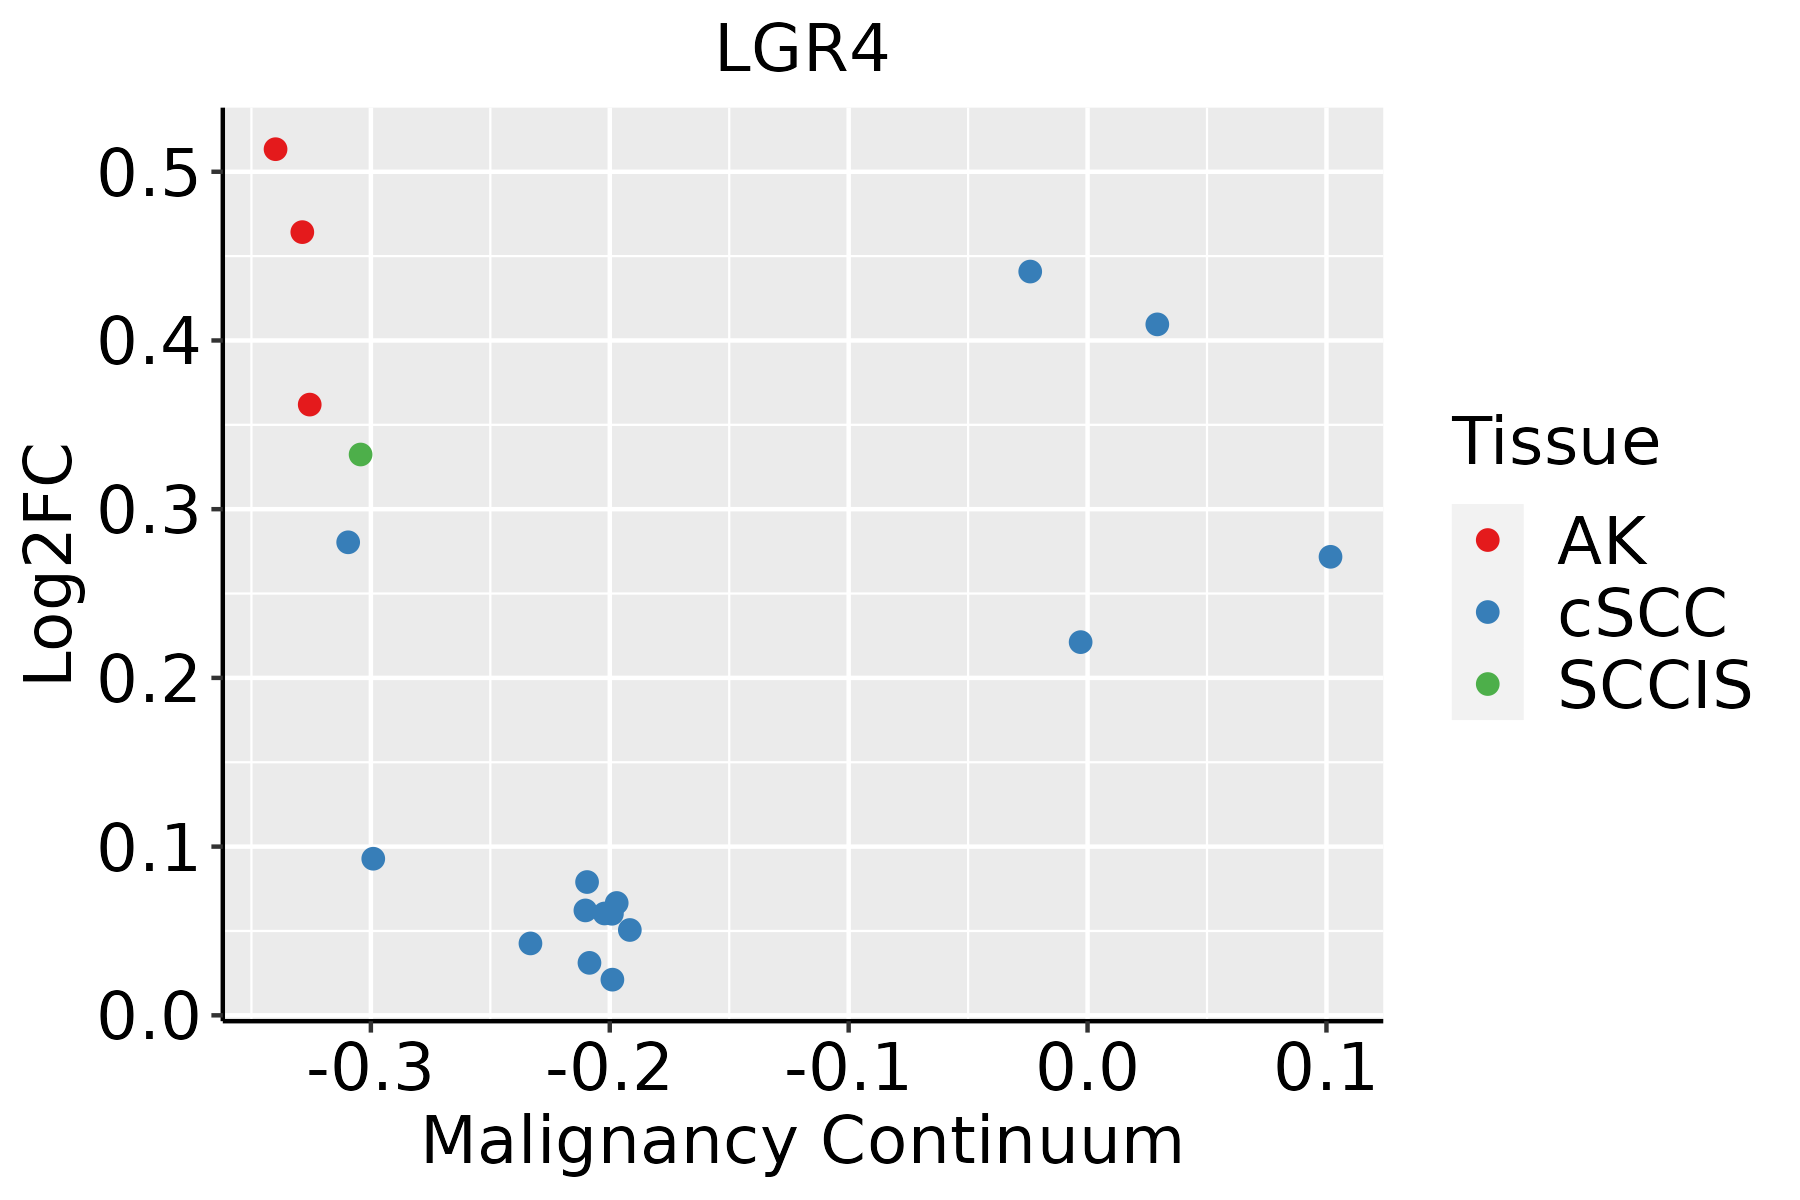 | AK: Actinic keratosis |
| cSCC: Cutaneous squamous cell carcinoma | ||
| SCCIS:squamous cell carcinoma in situ | ||
| Thyroid | 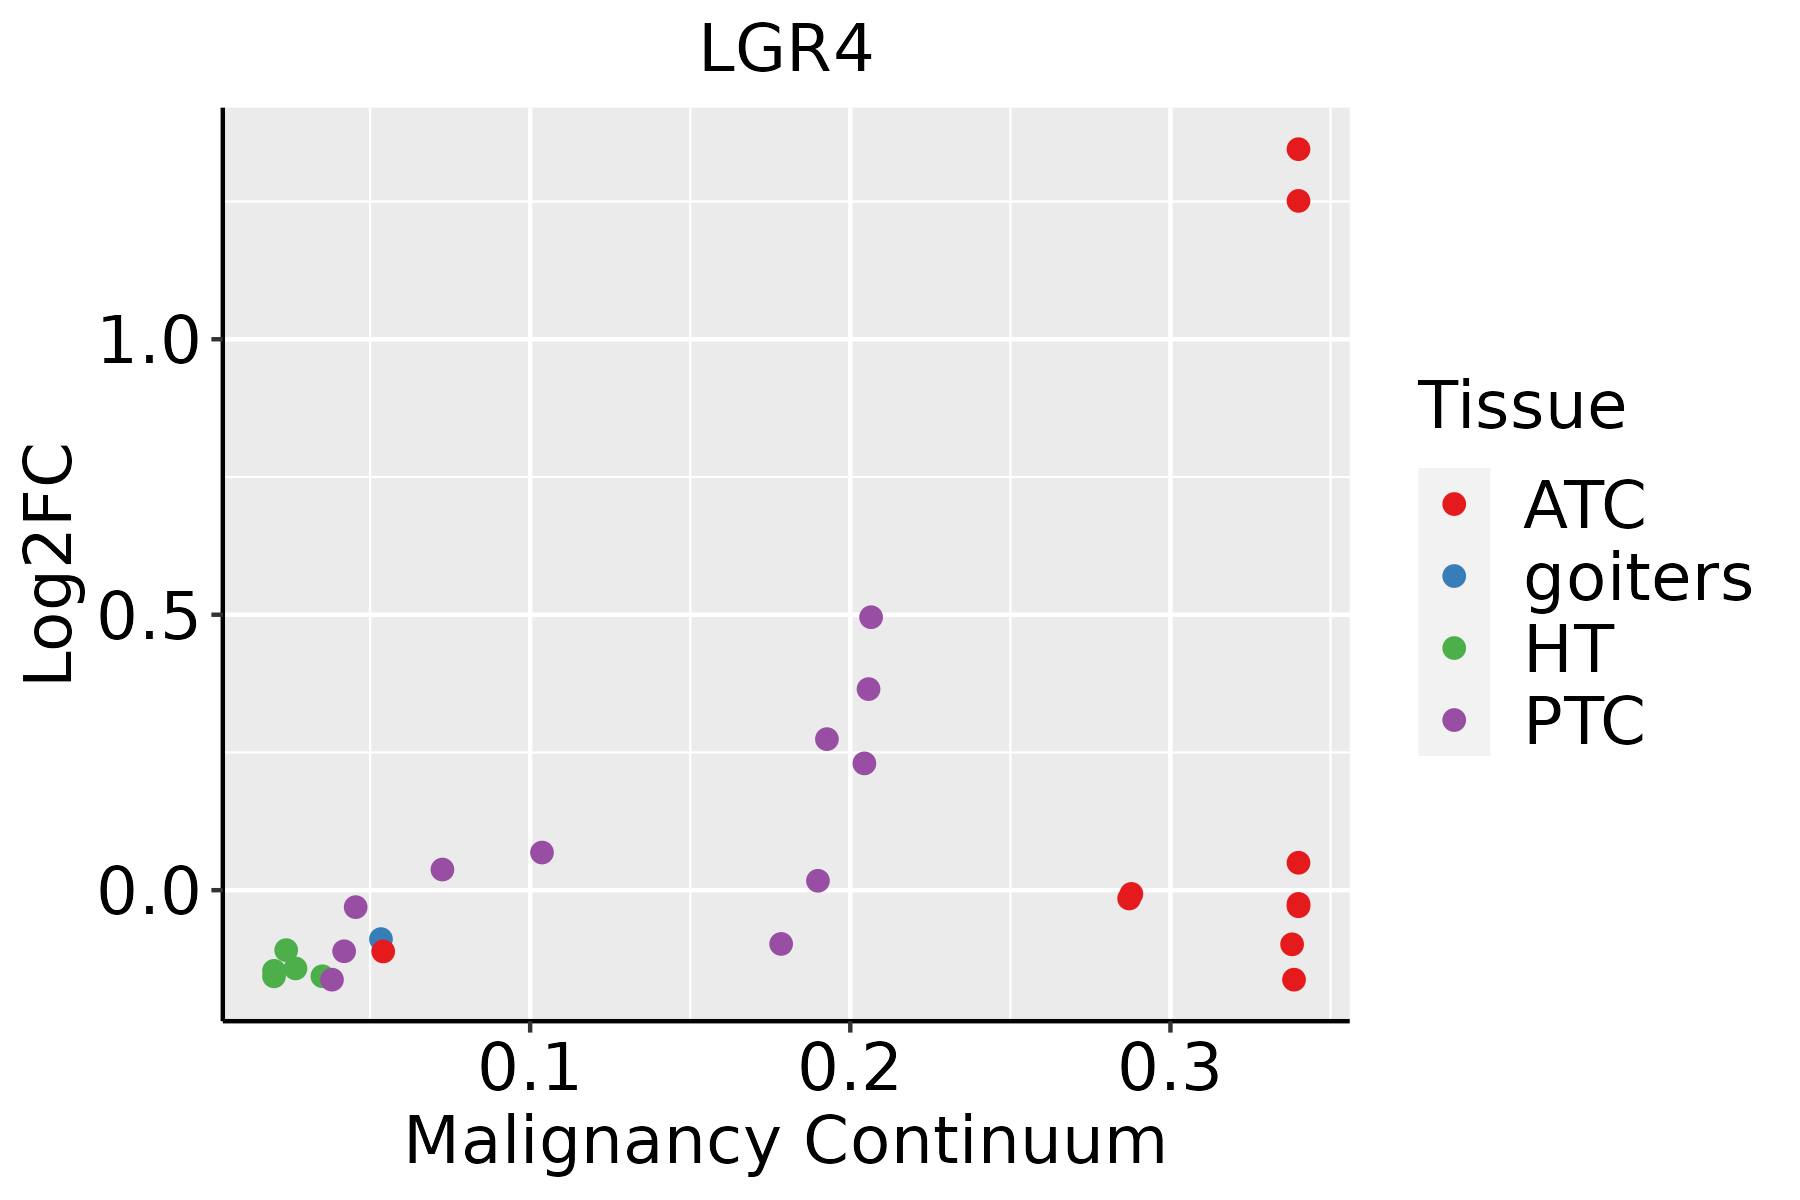 | ATC: Anaplastic thyroid cancer |
| HT: Hashimoto's thyroiditis | ||
| PTC: Papillary thyroid cancer |
| ∗log2FC in expression of this searched gene in stem-like cells from each diseased tissue sample relative to stem-like cells in normal samples in each tissue plotted against the malignancy continuum. Samples are colored based on if they are from different disease stage. |
Top |
Malignant transformation related pathway analysis |
| Find out the enriched GO biological processes and KEGG pathways involved in transition from healthy to precancer to cancer |
| Tissue | Disease Stage | Enriched GO biological Processes |
| Colorectum | AD |  |
| Colorectum | SER |  |
| Colorectum | MSS |  |
| Colorectum | MSI-H |  |
| Colorectum | FAP |  |
| ∗Top 15 enriched GO BP terms are showed in the bar plot of each disease state in each tissue. Each row represents a significant GO biological process which is colored according to the -log10(p.adjust). |
| Page: 1 2 3 4 5 6 7 8 9 |
| GO ID | Tissue | Disease Stage | Description | Gene Ratio | Bg Ratio | pvalue | p.adjust | Count |
| GO:000150314 | Prostate | Tumor | ossification | 109/3246 | 408/18723 | 1.13e-06 | 2.14e-05 | 109 |
| GO:006056214 | Prostate | Tumor | epithelial tube morphogenesis | 90/3246 | 325/18723 | 1.93e-06 | 3.34e-05 | 90 |
| GO:006113813 | Prostate | Tumor | morphogenesis of a branching epithelium | 57/3246 | 182/18723 | 2.66e-06 | 4.45e-05 | 57 |
| GO:000854415 | Prostate | Tumor | epidermis development | 89/3246 | 324/18723 | 3.15e-06 | 5.18e-05 | 89 |
| GO:004358815 | Prostate | Tumor | skin development | 74/3246 | 263/18723 | 8.28e-06 | 1.22e-04 | 74 |
| GO:000165513 | Prostate | Tumor | urogenital system development | 90/3246 | 338/18723 | 1.08e-05 | 1.56e-04 | 90 |
| GO:000975514 | Prostate | Tumor | hormone-mediated signaling pathway | 56/3246 | 190/18723 | 2.39e-05 | 3.00e-04 | 56 |
| GO:003017714 | Prostate | Tumor | positive regulation of Wnt signaling pathway | 44/3246 | 140/18723 | 3.18e-05 | 3.78e-04 | 44 |
| GO:004666111 | Prostate | Tumor | male sex differentiation | 48/3246 | 165/18723 | 1.25e-04 | 1.16e-03 | 48 |
| GO:009026314 | Prostate | Tumor | positive regulation of canonical Wnt signaling pathway | 34/3246 | 106/18723 | 1.55e-04 | 1.40e-03 | 34 |
| GO:000754811 | Prostate | Tumor | sex differentiation | 71/3246 | 276/18723 | 2.70e-04 | 2.24e-03 | 71 |
| GO:007207314 | Prostate | Tumor | kidney epithelium development | 40/3246 | 136/18723 | 3.43e-04 | 2.73e-03 | 40 |
| GO:000182213 | Prostate | Tumor | kidney development | 74/3246 | 293/18723 | 3.68e-04 | 2.87e-03 | 74 |
| GO:007200113 | Prostate | Tumor | renal system development | 75/3246 | 302/18723 | 5.74e-04 | 4.13e-03 | 75 |
| GO:00423031 | Prostate | Tumor | molting cycle | 31/3246 | 107/18723 | 1.97e-03 | 1.14e-02 | 31 |
| GO:00426331 | Prostate | Tumor | hair cycle | 31/3246 | 107/18723 | 1.97e-03 | 1.14e-02 | 31 |
| GO:007200913 | Prostate | Tumor | nephron epithelium development | 31/3246 | 109/18723 | 2.70e-03 | 1.48e-02 | 31 |
| GO:004875411 | Prostate | Tumor | branching morphogenesis of an epithelial tube | 40/3246 | 151/18723 | 3.07e-03 | 1.63e-02 | 40 |
| GO:19908453 | Prostate | Tumor | adaptive thermogenesis | 41/3246 | 157/18723 | 3.63e-03 | 1.86e-02 | 41 |
| GO:000165612 | Prostate | Tumor | metanephros development | 25/3246 | 85/18723 | 4.12e-03 | 2.08e-02 | 25 |
| Page: 1 2 3 4 5 6 7 8 9 10 11 12 13 14 15 16 17 18 19 20 21 22 23 24 25 26 27 28 29 30 31 32 33 34 |
| Pathway ID | Tissue | Disease Stage | Description | Gene Ratio | Bg Ratio | pvalue | p.adjust | qvalue | Count |
| hsa043109 | Cervix | CC | Wnt signaling pathway | 43/1267 | 171/8465 | 3.03e-04 | 1.64e-03 | 9.68e-04 | 43 |
| hsa0431012 | Cervix | CC | Wnt signaling pathway | 43/1267 | 171/8465 | 3.03e-04 | 1.64e-03 | 9.68e-04 | 43 |
| hsa04310 | Colorectum | AD | Wnt signaling pathway | 56/2092 | 171/8465 | 1.03e-02 | 3.93e-02 | 2.51e-02 | 56 |
| hsa043101 | Colorectum | AD | Wnt signaling pathway | 56/2092 | 171/8465 | 1.03e-02 | 3.93e-02 | 2.51e-02 | 56 |
| hsa043102 | Colorectum | MSS | Wnt signaling pathway | 53/1875 | 171/8465 | 4.24e-03 | 1.86e-02 | 1.14e-02 | 53 |
| hsa043103 | Colorectum | MSS | Wnt signaling pathway | 53/1875 | 171/8465 | 4.24e-03 | 1.86e-02 | 1.14e-02 | 53 |
| hsa043104 | Colorectum | FAP | Wnt signaling pathway | 46/1404 | 171/8465 | 3.94e-04 | 3.06e-03 | 1.86e-03 | 46 |
| hsa043105 | Colorectum | FAP | Wnt signaling pathway | 46/1404 | 171/8465 | 3.94e-04 | 3.06e-03 | 1.86e-03 | 46 |
| hsa043106 | Colorectum | CRC | Wnt signaling pathway | 40/1091 | 171/8465 | 1.01e-04 | 1.57e-03 | 1.07e-03 | 40 |
| hsa043107 | Colorectum | CRC | Wnt signaling pathway | 40/1091 | 171/8465 | 1.01e-04 | 1.57e-03 | 1.07e-03 | 40 |
| hsa0431010 | Endometrium | AEH | Wnt signaling pathway | 37/1197 | 171/8465 | 4.68e-03 | 2.53e-02 | 1.86e-02 | 37 |
| hsa0431013 | Endometrium | AEH | Wnt signaling pathway | 37/1197 | 171/8465 | 4.68e-03 | 2.53e-02 | 1.86e-02 | 37 |
| hsa0431022 | Endometrium | EEC | Wnt signaling pathway | 40/1237 | 171/8465 | 1.37e-03 | 8.99e-03 | 6.70e-03 | 40 |
| hsa0431032 | Endometrium | EEC | Wnt signaling pathway | 40/1237 | 171/8465 | 1.37e-03 | 8.99e-03 | 6.70e-03 | 40 |
| hsa043108 | Lung | IAC | Wnt signaling pathway | 40/1053 | 171/8465 | 4.56e-05 | 7.06e-04 | 4.69e-04 | 40 |
| hsa0431011 | Lung | IAC | Wnt signaling pathway | 40/1053 | 171/8465 | 4.56e-05 | 7.06e-04 | 4.69e-04 | 40 |
| hsa0431021 | Lung | AIS | Wnt signaling pathway | 39/961 | 171/8465 | 1.29e-05 | 3.32e-04 | 2.12e-04 | 39 |
| hsa0431031 | Lung | AIS | Wnt signaling pathway | 39/961 | 171/8465 | 1.29e-05 | 3.32e-04 | 2.12e-04 | 39 |
| hsa0431014 | Prostate | BPH | Wnt signaling pathway | 50/1718 | 171/8465 | 3.11e-03 | 1.15e-02 | 7.14e-03 | 50 |
| hsa0431015 | Prostate | BPH | Wnt signaling pathway | 50/1718 | 171/8465 | 3.11e-03 | 1.15e-02 | 7.14e-03 | 50 |
| Page: 1 2 |
Top |
Cell-cell communication analysis |
| Identification of potential cell-cell interactions between two cell types and their ligand-receptor pairs for different disease states |
| Ligand | Receptor | LRpair | Pathway | Tissue | Disease Stage |
| Page: 1 |
Top |
Single-cell gene regulatory network inference analysis |
| Find out the significant the regulons (TFs) and the target genes of each regulon across cell types for different disease states |
| TF | Cell Type | Tissue | Disease Stage | Target Gene | RSS | Regulon Activity |
| ∗The dot plots of a searched regulon are shown for all cell subpopulations in each disease state of each tissue based on the regulon specific score inferred using pySCENIC and by calculating the average expression. |
| Page: 1 |
Top |
Somatic mutation of malignant transformation related genes |
| Annotation of somatic variants for genes involved in malignant transformation |
| Hugo Symbol | Variant Class | Variant Classification | dbSNP RS | HGVSc | HGVSp | HGVSp Short | SWISSPROT | BIOTYPE | SIFT | PolyPhen | Tumor Sample Barcode | Tissue | Histology | Sex | Age | Stage | Therapy Types | Drugs | Outcome |
| LGR4 | SNV | Missense_Mutation | novel | c.1817N>T | p.Ala606Val | p.A606V | Q9BXB1 | protein_coding | deleterious(0) | possibly_damaging(0.756) | TCGA-A2-A4S1-01 | Breast | breast invasive carcinoma | Female | >=65 | I/II | Unknown | Unknown | SD |
| LGR4 | SNV | Missense_Mutation | rs749587915 | c.466N>T | p.Arg156Trp | p.R156W | Q9BXB1 | protein_coding | deleterious(0) | probably_damaging(0.999) | TCGA-AN-A0XU-01 | Breast | breast invasive carcinoma | Female | <65 | I/II | Unknown | Unknown | SD |
| LGR4 | SNV | Missense_Mutation | c.1968N>A | p.Ser656Arg | p.S656R | Q9BXB1 | protein_coding | tolerated(0.3) | benign(0.007) | TCGA-C8-A134-01 | Breast | breast invasive carcinoma | Female | <65 | I/II | Chemotherapy | 5-fluorouracil | CR | |
| LGR4 | SNV | Missense_Mutation | c.539N>G | p.Gln180Arg | p.Q180R | Q9BXB1 | protein_coding | tolerated(0.06) | possibly_damaging(0.782) | TCGA-D8-A147-01 | Breast | breast invasive carcinoma | Female | <65 | I/II | Chemotherapy | doxorubicine | SD | |
| LGR4 | insertion | Nonsense_Mutation | novel | c.508_509insCATTGTGATATTGAAAGTATA | p.Val170delinsAlaLeuTerTyrTerLysTyrMet | p.V170delinsAL*Y*KYM | Q9BXB1 | protein_coding | TCGA-A2-A0CQ-01 | Breast | breast invasive carcinoma | Female | <65 | I/II | Chemotherapy | adriamycin | SD | ||
| LGR4 | insertion | Frame_Shift_Ins | novel | c.573_574insGAAAT | p.Ile192GlufsTer15 | p.I192Efs*15 | Q9BXB1 | protein_coding | TCGA-AR-A0TU-01 | Breast | breast invasive carcinoma | Female | <65 | I/II | Unspecific | Doxorubicin | SD | ||
| LGR4 | SNV | Missense_Mutation | c.1953N>C | p.Met651Ile | p.M651I | Q9BXB1 | protein_coding | tolerated(0.45) | benign(0) | TCGA-IR-A3LK-01 | Cervix | cervical & endocervical cancer | Female | >=65 | I/II | Chemotherapy | cisplatin | PD | |
| LGR4 | SNV | Missense_Mutation | rs200626048 | c.1625N>A | p.Arg542His | p.R542H | Q9BXB1 | protein_coding | deleterious(0) | probably_damaging(0.996) | TCGA-VS-A8EL-01 | Cervix | cervical & endocervical cancer | Female | <65 | I/II | Chemotherapy | cisplatin | CR |
| LGR4 | SNV | Missense_Mutation | c.2000N>G | p.Leu667Arg | p.L667R | Q9BXB1 | protein_coding | tolerated(0.08) | benign(0.419) | TCGA-A6-3809-01 | Colorectum | colon adenocarcinoma | Female | >=65 | I/II | Unknown | Unknown | SD | |
| LGR4 | SNV | Missense_Mutation | rs376236224 | c.274G>A | p.Asp92Asn | p.D92N | Q9BXB1 | protein_coding | tolerated(0.24) | possibly_damaging(0.735) | TCGA-A6-5661-01 | Colorectum | colon adenocarcinoma | Female | >=65 | I/II | Unknown | Unknown | SD |
| Page: 1 2 3 4 5 6 7 8 9 |
Top |
Related drugs of malignant transformation related genes |
| Identification of chemicals and drugs interact with genes involved in malignant transfromation |
| (DGIdb 4.0) |
| Entrez ID | Symbol | Category | Interaction Types | Drug Claim Name | Drug Name | PMIDs |
| 55366 | LGR4 | G PROTEIN COUPLED RECEPTOR, DRUGGABLE GENOME | agonist | 178100589 | ||
| 55366 | LGR4 | G PROTEIN COUPLED RECEPTOR, DRUGGABLE GENOME | agonist | 178100587 | ||
| 55366 | LGR4 | G PROTEIN COUPLED RECEPTOR, DRUGGABLE GENOME | agonist | 178100588 | ||
| 55366 | LGR4 | G PROTEIN COUPLED RECEPTOR, DRUGGABLE GENOME | agonist | 178100586 |
| Page: 1 |

Copyright 2023-Present -The University of Texas Health Science Center at Houston |