
|
|||||
|
 | |
| |
| |
| |
| |
| |
|
Gene: JUNB |
Gene summary for JUNB |
| Gene information | Species | Human | Gene symbol | JUNB | Gene ID | 3726 |
| Gene name | JunB proto-oncogene, AP-1 transcription factor subunit | |
| Gene Alias | AP-1 | |
| Cytomap | 19p13.13 | |
| Gene Type | protein-coding | GO ID | GO:0000003 | UniProtAcc | P17275 |
Top |
Malignant transformation analysis |
| Identification of the aberrant gene expression in precancerous and cancerous lesions by comparing the gene expression of stem-like cells in diseased tissues with normal stem cells |
| Entrez ID | Symbol | Replicates | Species | Organ | Tissue | Adj P-value | Log2FC | Malignancy |
| 3726 | JUNB | GSM4909280 | Human | Breast | Precancer | 1.23e-02 | 4.42e-01 | 0.0305 |
| 3726 | JUNB | GSM4909281 | Human | Breast | IDC | 4.15e-07 | -4.93e-01 | 0.21 |
| 3726 | JUNB | GSM4909282 | Human | Breast | IDC | 2.42e-57 | 7.46e-01 | -0.0288 |
| 3726 | JUNB | GSM4909285 | Human | Breast | IDC | 4.26e-07 | 3.14e-01 | 0.21 |
| 3726 | JUNB | GSM4909290 | Human | Breast | IDC | 2.71e-04 | -4.08e-01 | 0.2096 |
| 3726 | JUNB | GSM4909294 | Human | Breast | IDC | 1.09e-19 | -7.18e-01 | 0.2022 |
| 3726 | JUNB | GSM4909296 | Human | Breast | IDC | 1.54e-07 | -5.06e-01 | 0.1524 |
| 3726 | JUNB | GSM4909297 | Human | Breast | IDC | 1.57e-10 | 1.00e-01 | 0.1517 |
| 3726 | JUNB | GSM4909299 | Human | Breast | IDC | 4.89e-06 | 3.52e-01 | 0.035 |
| 3726 | JUNB | GSM4909300 | Human | Breast | IDC | 7.10e-05 | 4.29e-01 | 0.0334 |
| 3726 | JUNB | GSM4909304 | Human | Breast | IDC | 3.65e-09 | -5.44e-01 | 0.1636 |
| 3726 | JUNB | GSM4909305 | Human | Breast | IDC | 3.08e-11 | 4.28e-01 | 0.0436 |
| 3726 | JUNB | GSM4909306 | Human | Breast | IDC | 1.17e-10 | 3.49e-01 | 0.1564 |
| 3726 | JUNB | GSM4909308 | Human | Breast | IDC | 8.75e-25 | 5.47e-01 | 0.158 |
| 3726 | JUNB | GSM4909311 | Human | Breast | IDC | 6.18e-24 | -2.76e-01 | 0.1534 |
| 3726 | JUNB | GSM4909312 | Human | Breast | IDC | 9.91e-17 | 4.04e-01 | 0.1552 |
| 3726 | JUNB | GSM4909313 | Human | Breast | IDC | 2.93e-12 | 4.41e-01 | 0.0391 |
| 3726 | JUNB | GSM4909315 | Human | Breast | IDC | 7.28e-17 | -6.80e-01 | 0.21 |
| 3726 | JUNB | GSM4909316 | Human | Breast | IDC | 1.01e-08 | -7.66e-01 | 0.21 |
| 3726 | JUNB | GSM4909319 | Human | Breast | IDC | 6.89e-36 | 1.66e-01 | 0.1563 |
| Page: 1 2 3 4 5 6 7 8 9 10 11 12 13 14 15 |
| Tissue | Expression Dynamics | Abbreviation |
| Breast | 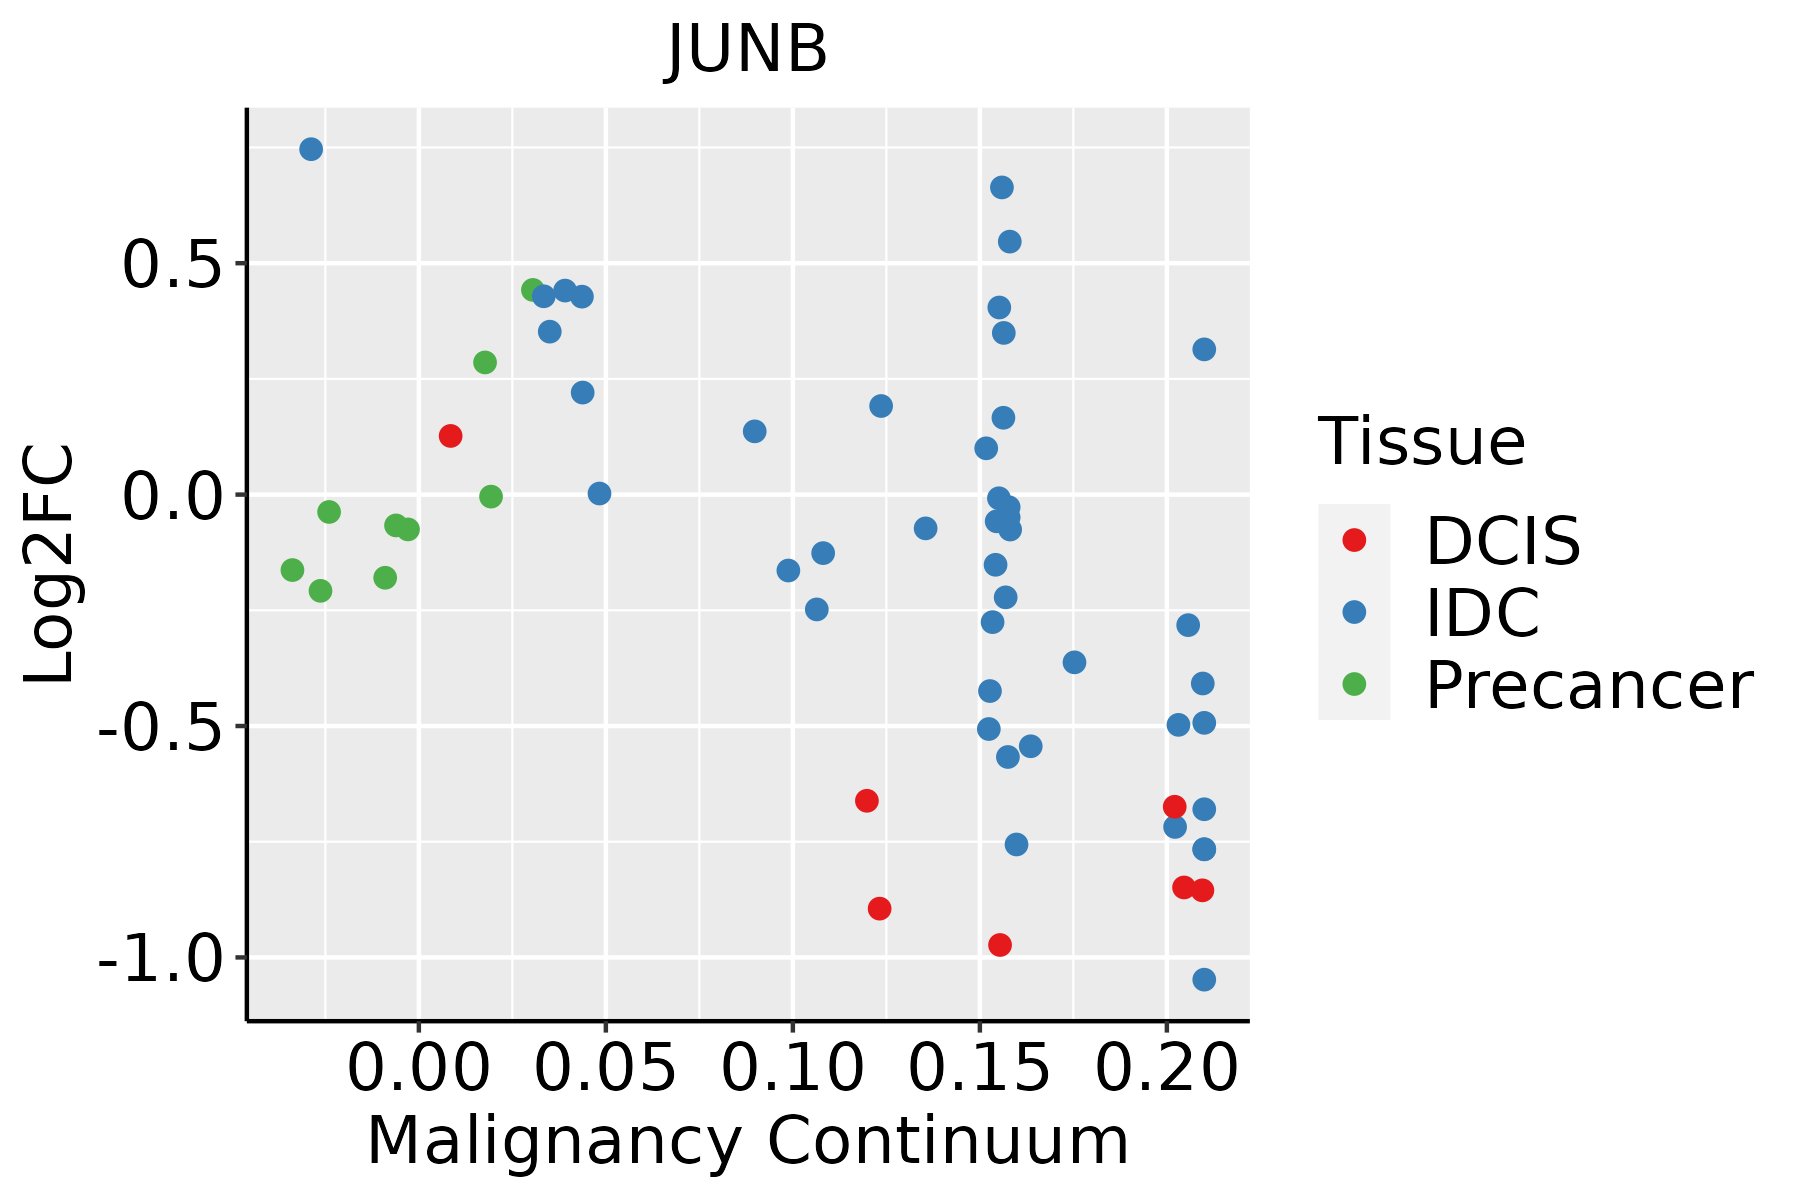 | IDC: Invasive ductal carcinoma |
| DCIS: Ductal carcinoma in situ | ||
| Precancer(BRCA1-mut): Precancerous lesion from BRCA1 mutation carriers | ||
| Cervix | 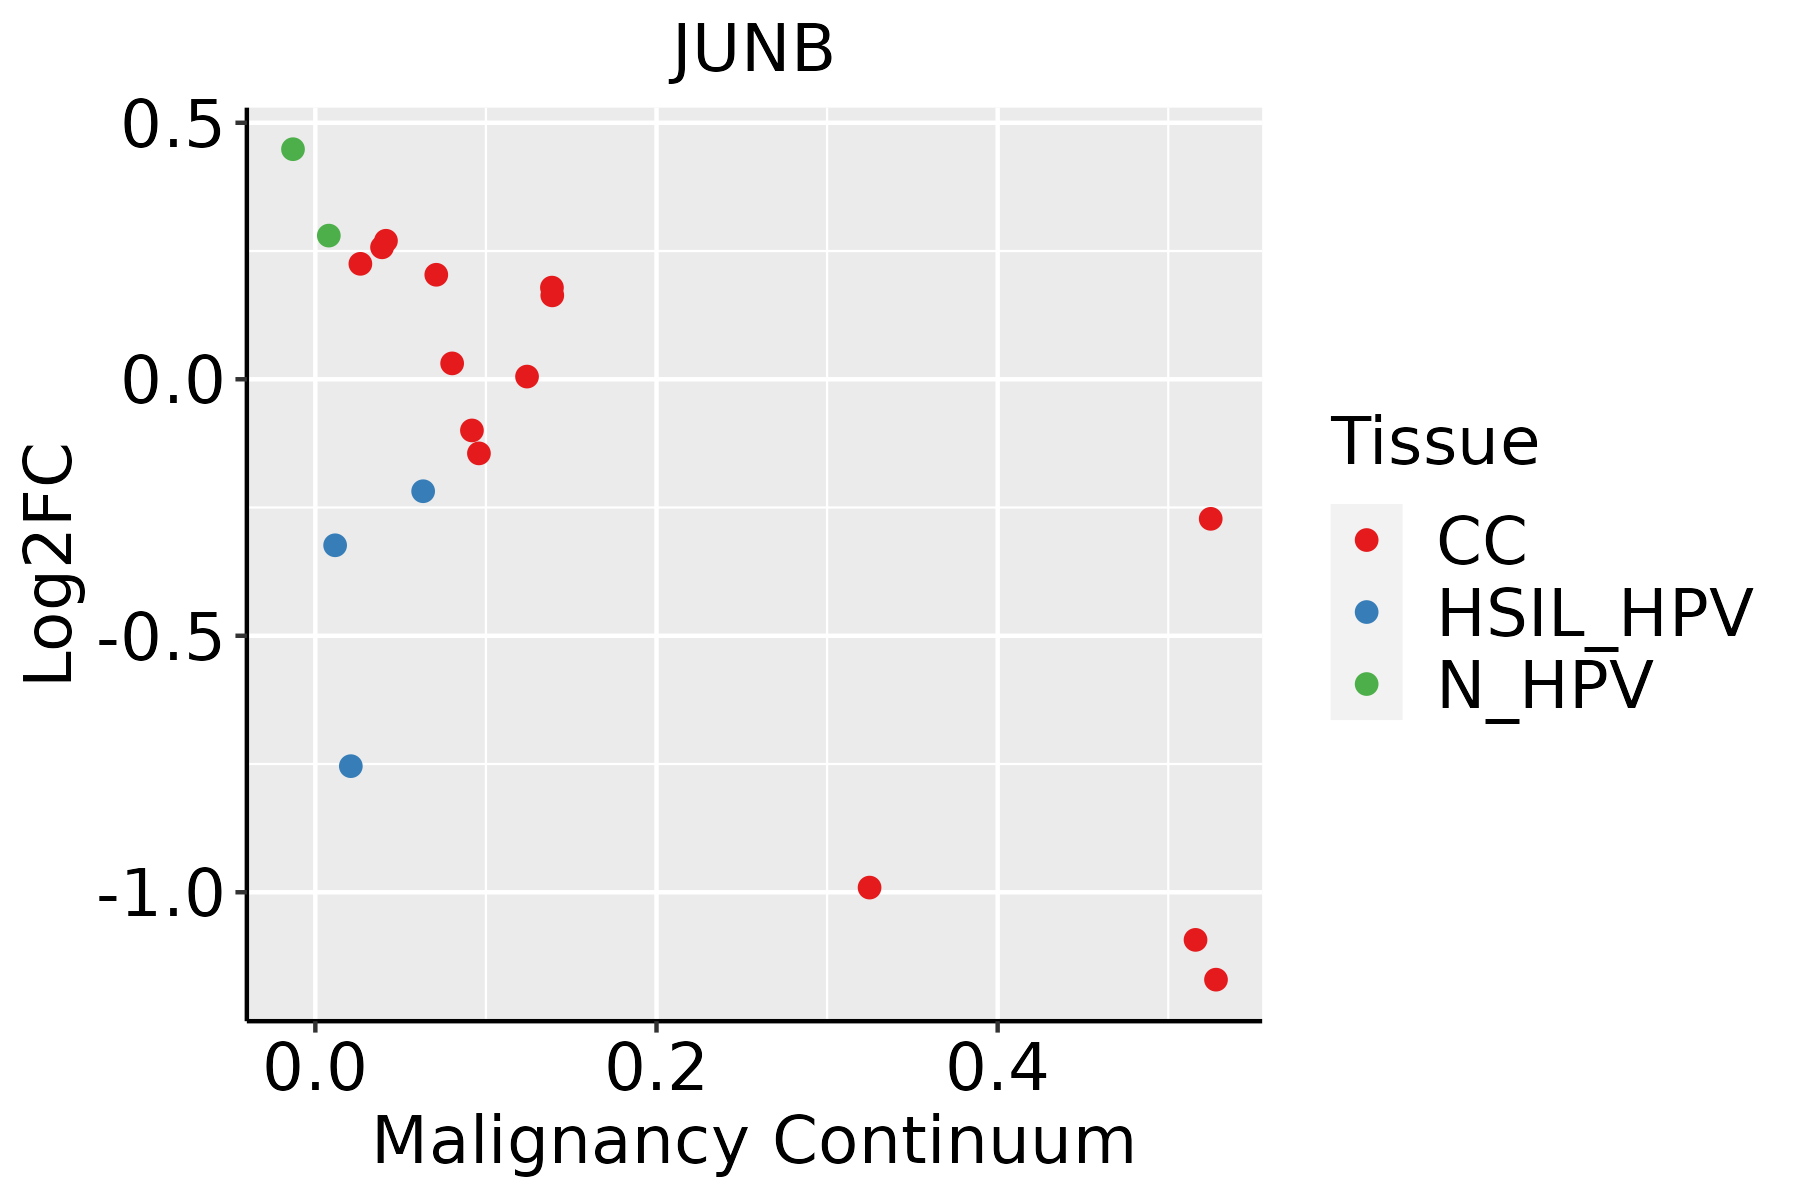 | CC: Cervix cancer |
| HSIL_HPV: HPV-infected high-grade squamous intraepithelial lesions | ||
| N_HPV: HPV-infected normal cervix | ||
| Colorectum (GSE201348) |  | FAP: Familial adenomatous polyposis |
| CRC: Colorectal cancer | ||
| Colorectum (HTA11) |  | AD: Adenomas |
| SER: Sessile serrated lesions | ||
| MSI-H: Microsatellite-high colorectal cancer | ||
| MSS: Microsatellite stable colorectal cancer | ||
| Endometrium | 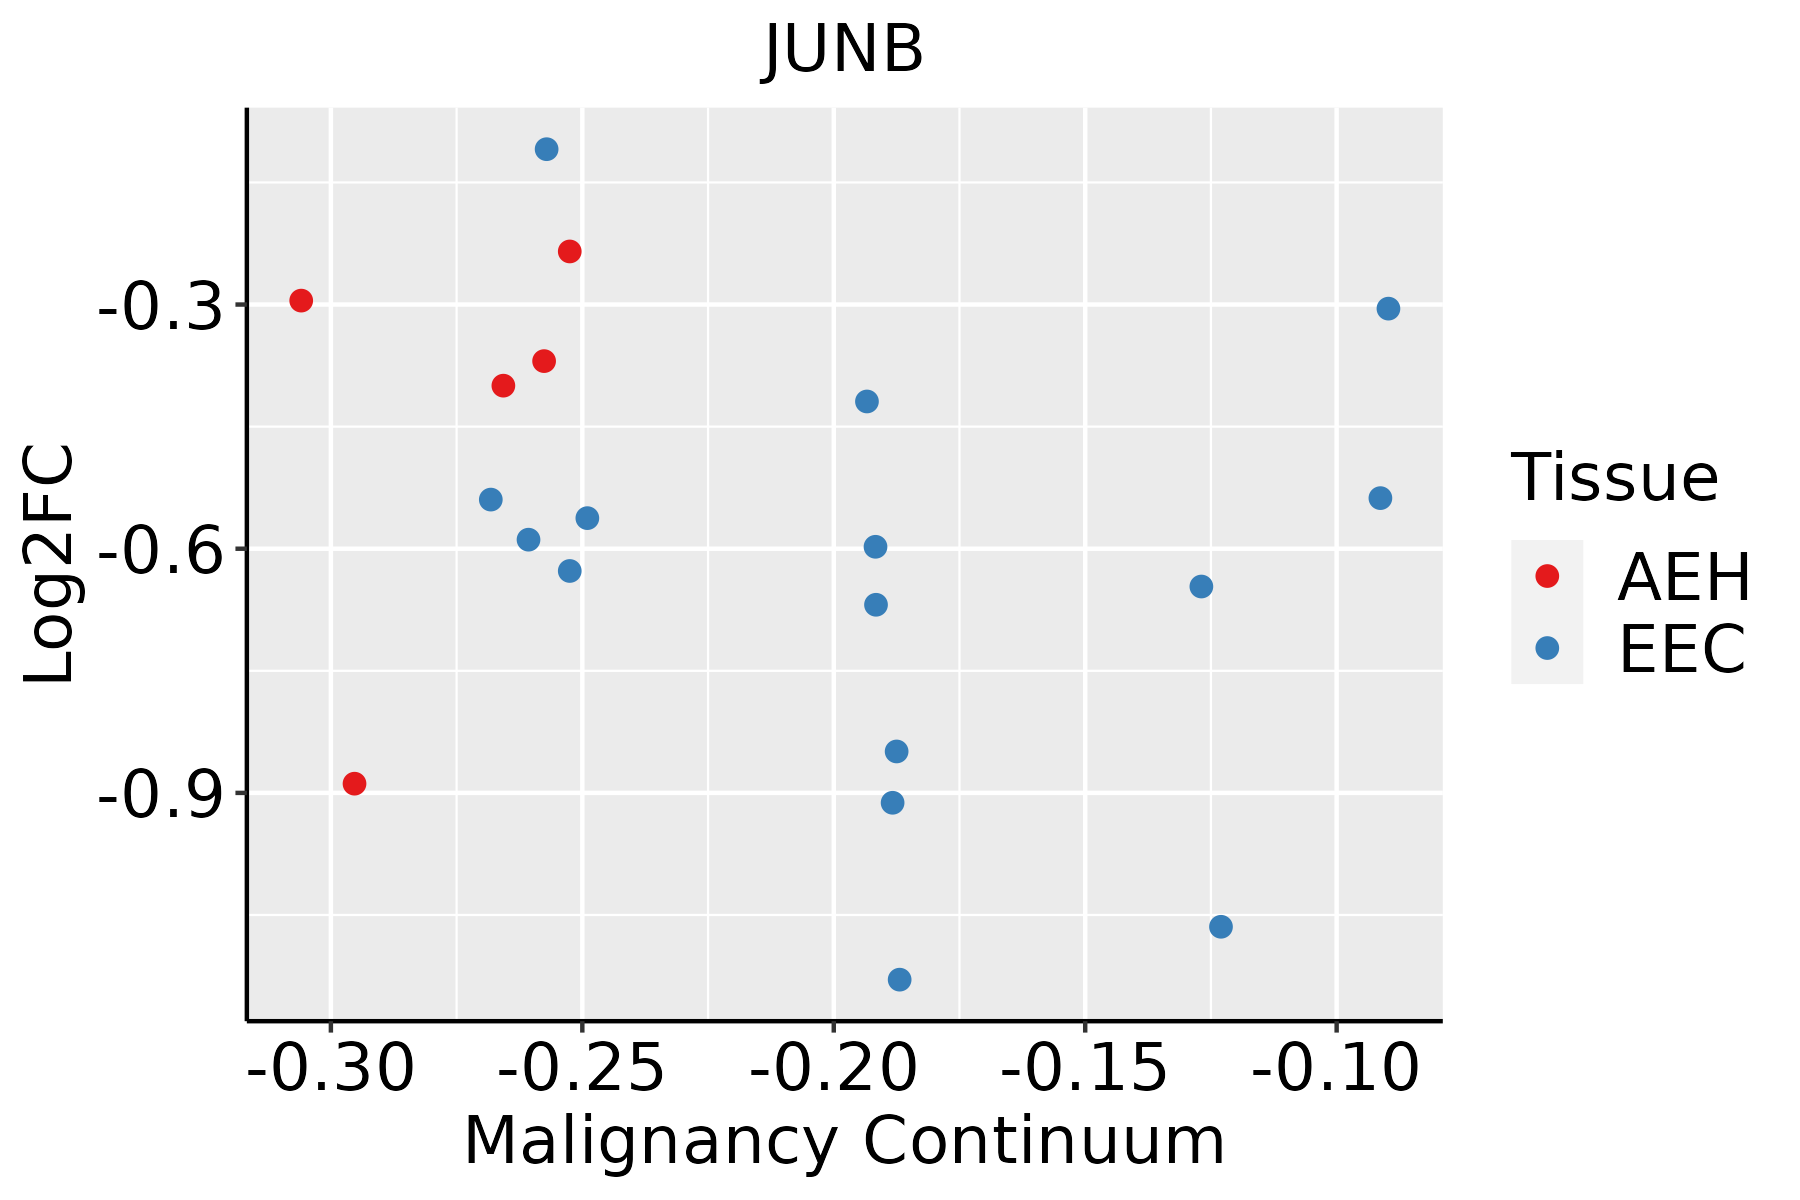 | AEH: Atypical endometrial hyperplasia |
| EEC: Endometrioid Cancer | ||
| Esophagus | 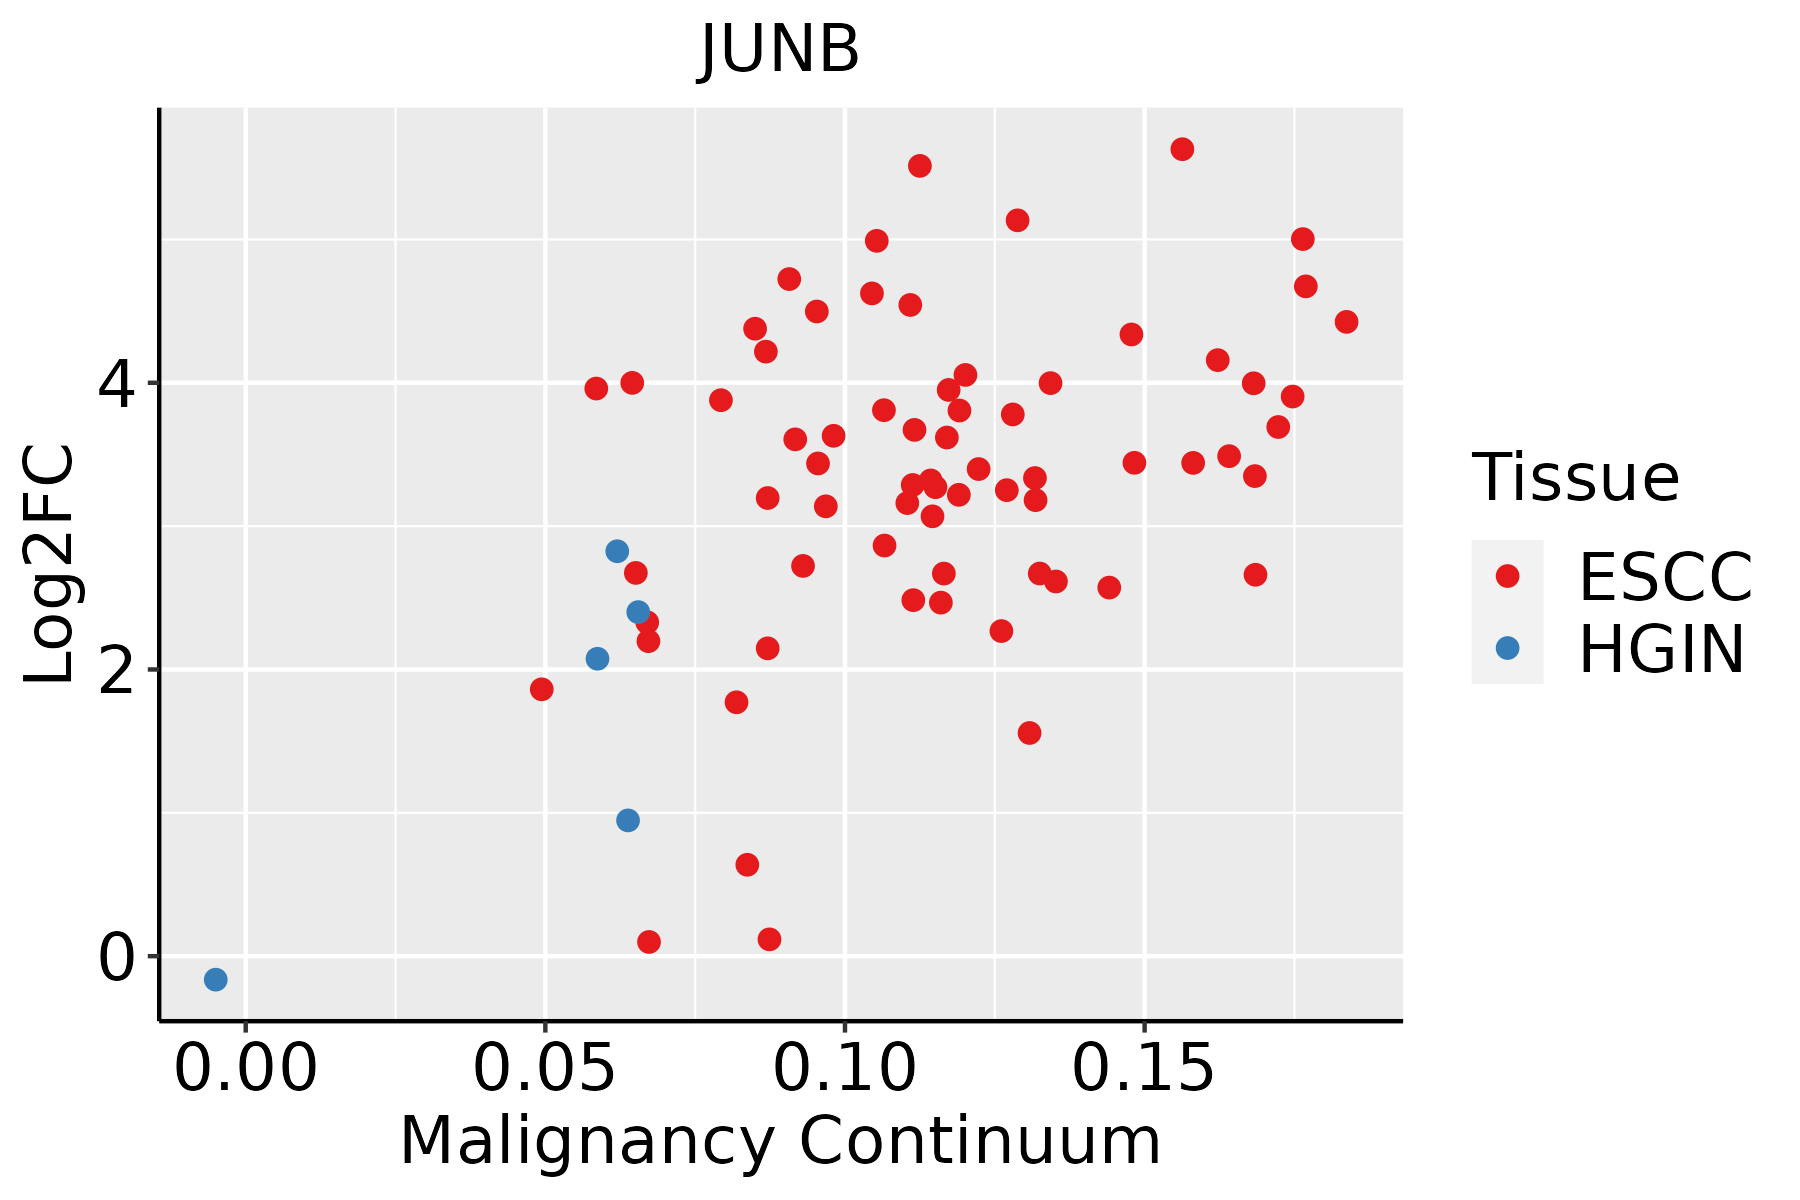 | ESCC: Esophageal squamous cell carcinoma |
| HGIN: High-grade intraepithelial neoplasias | ||
| LGIN: Low-grade intraepithelial neoplasias | ||
| Liver |  | HCC: Hepatocellular carcinoma |
| NAFLD: Non-alcoholic fatty liver disease | ||
| Lung | 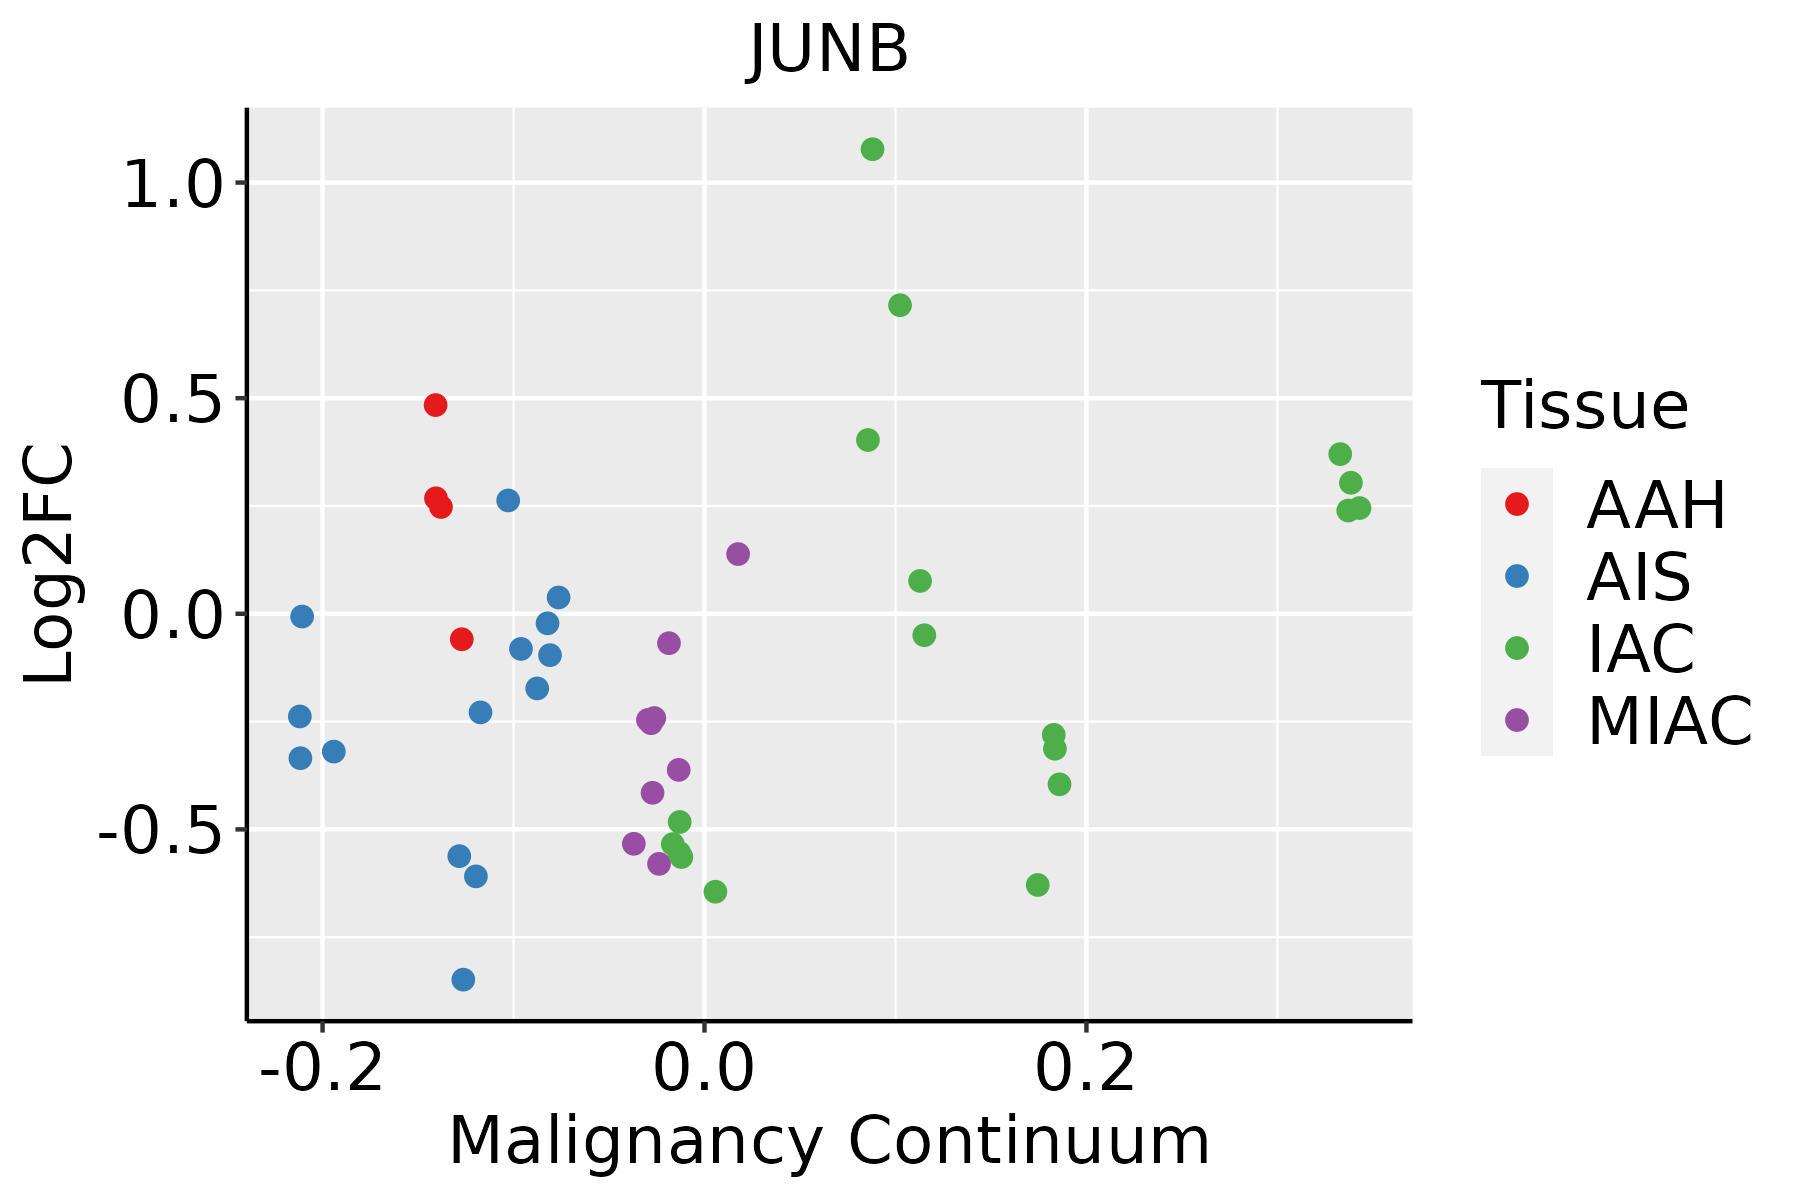 | AAH: Atypical adenomatous hyperplasia |
| AIS: Adenocarcinoma in situ | ||
| IAC: Invasive lung adenocarcinoma | ||
| MIA: Minimally invasive adenocarcinoma | ||
| Oral Cavity |  | EOLP: Erosive Oral lichen planus |
| LP: leukoplakia | ||
| NEOLP: Non-erosive oral lichen planus | ||
| OSCC: Oral squamous cell carcinoma | ||
| Prostate | 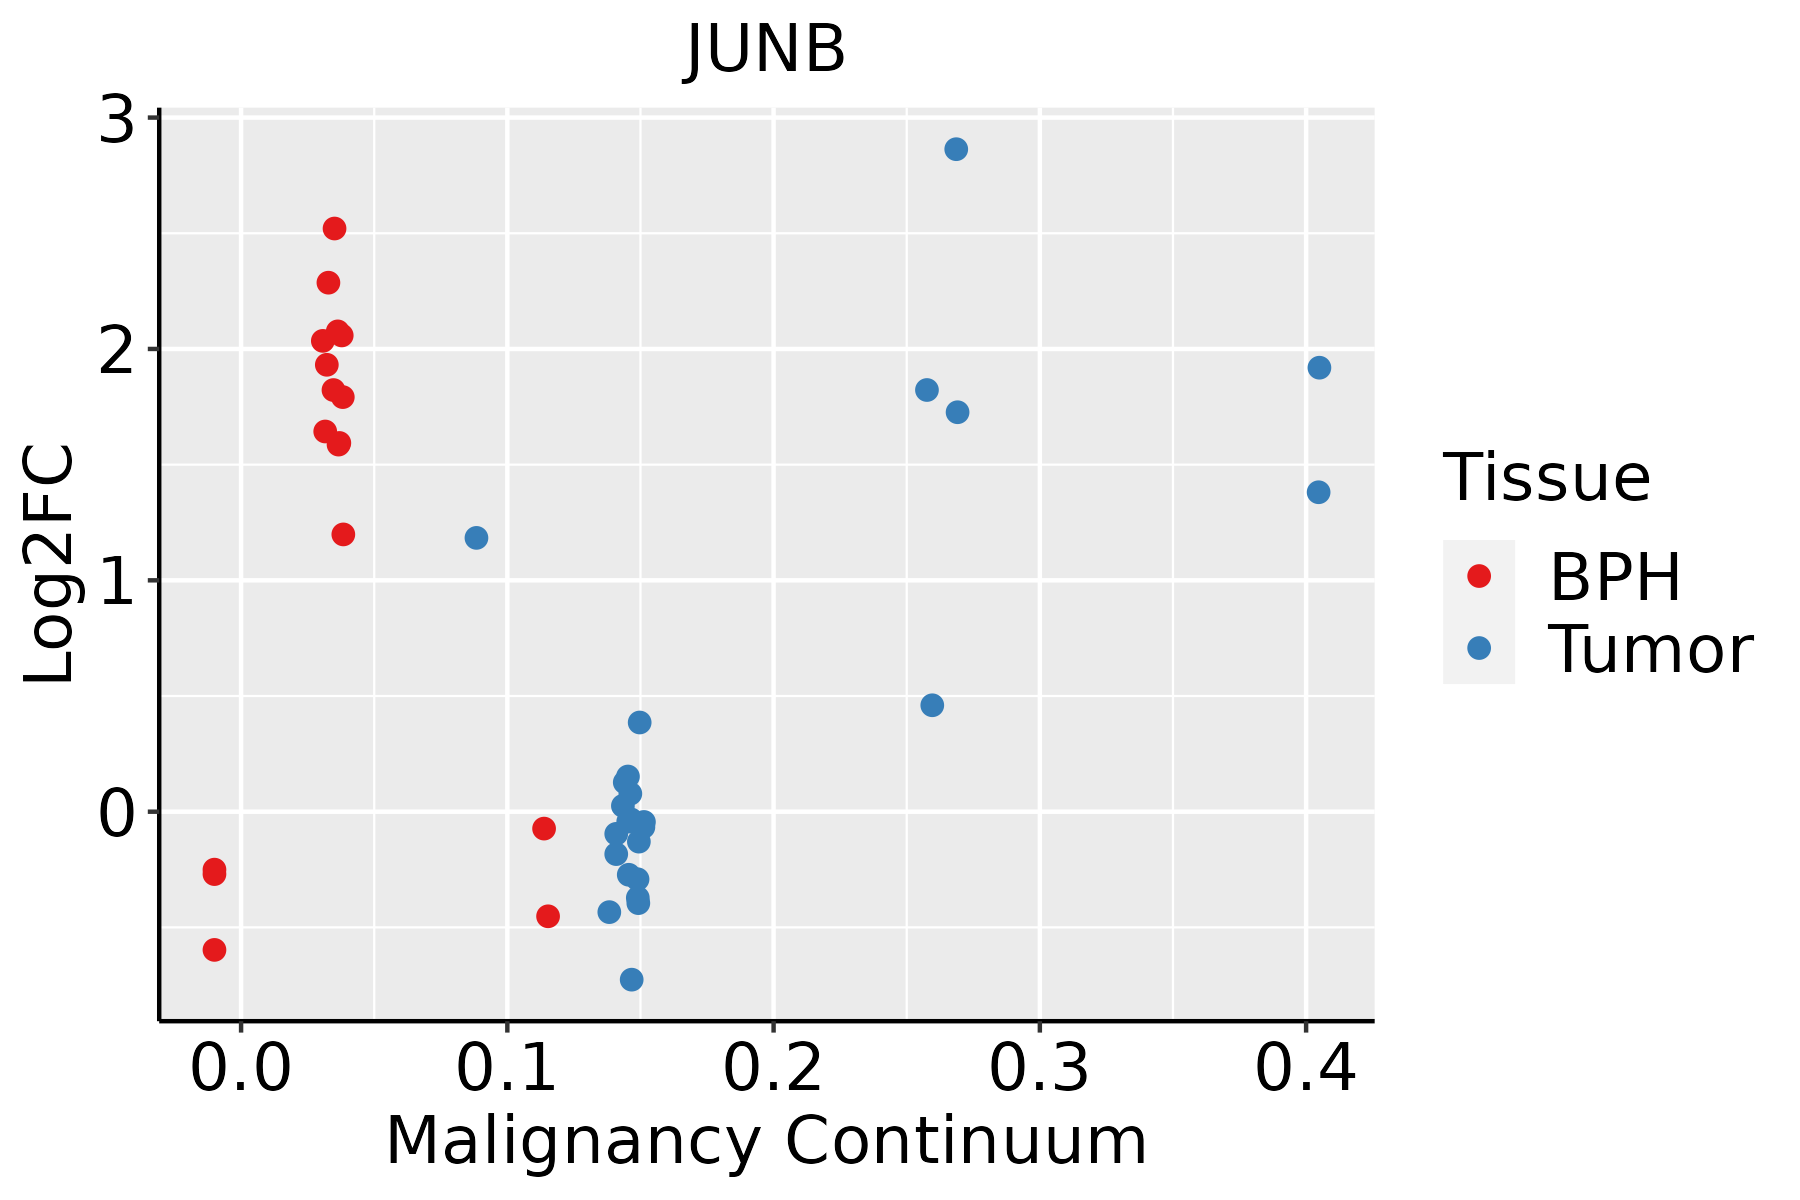 | BPH: Benign Prostatic Hyperplasia |
| Skin | 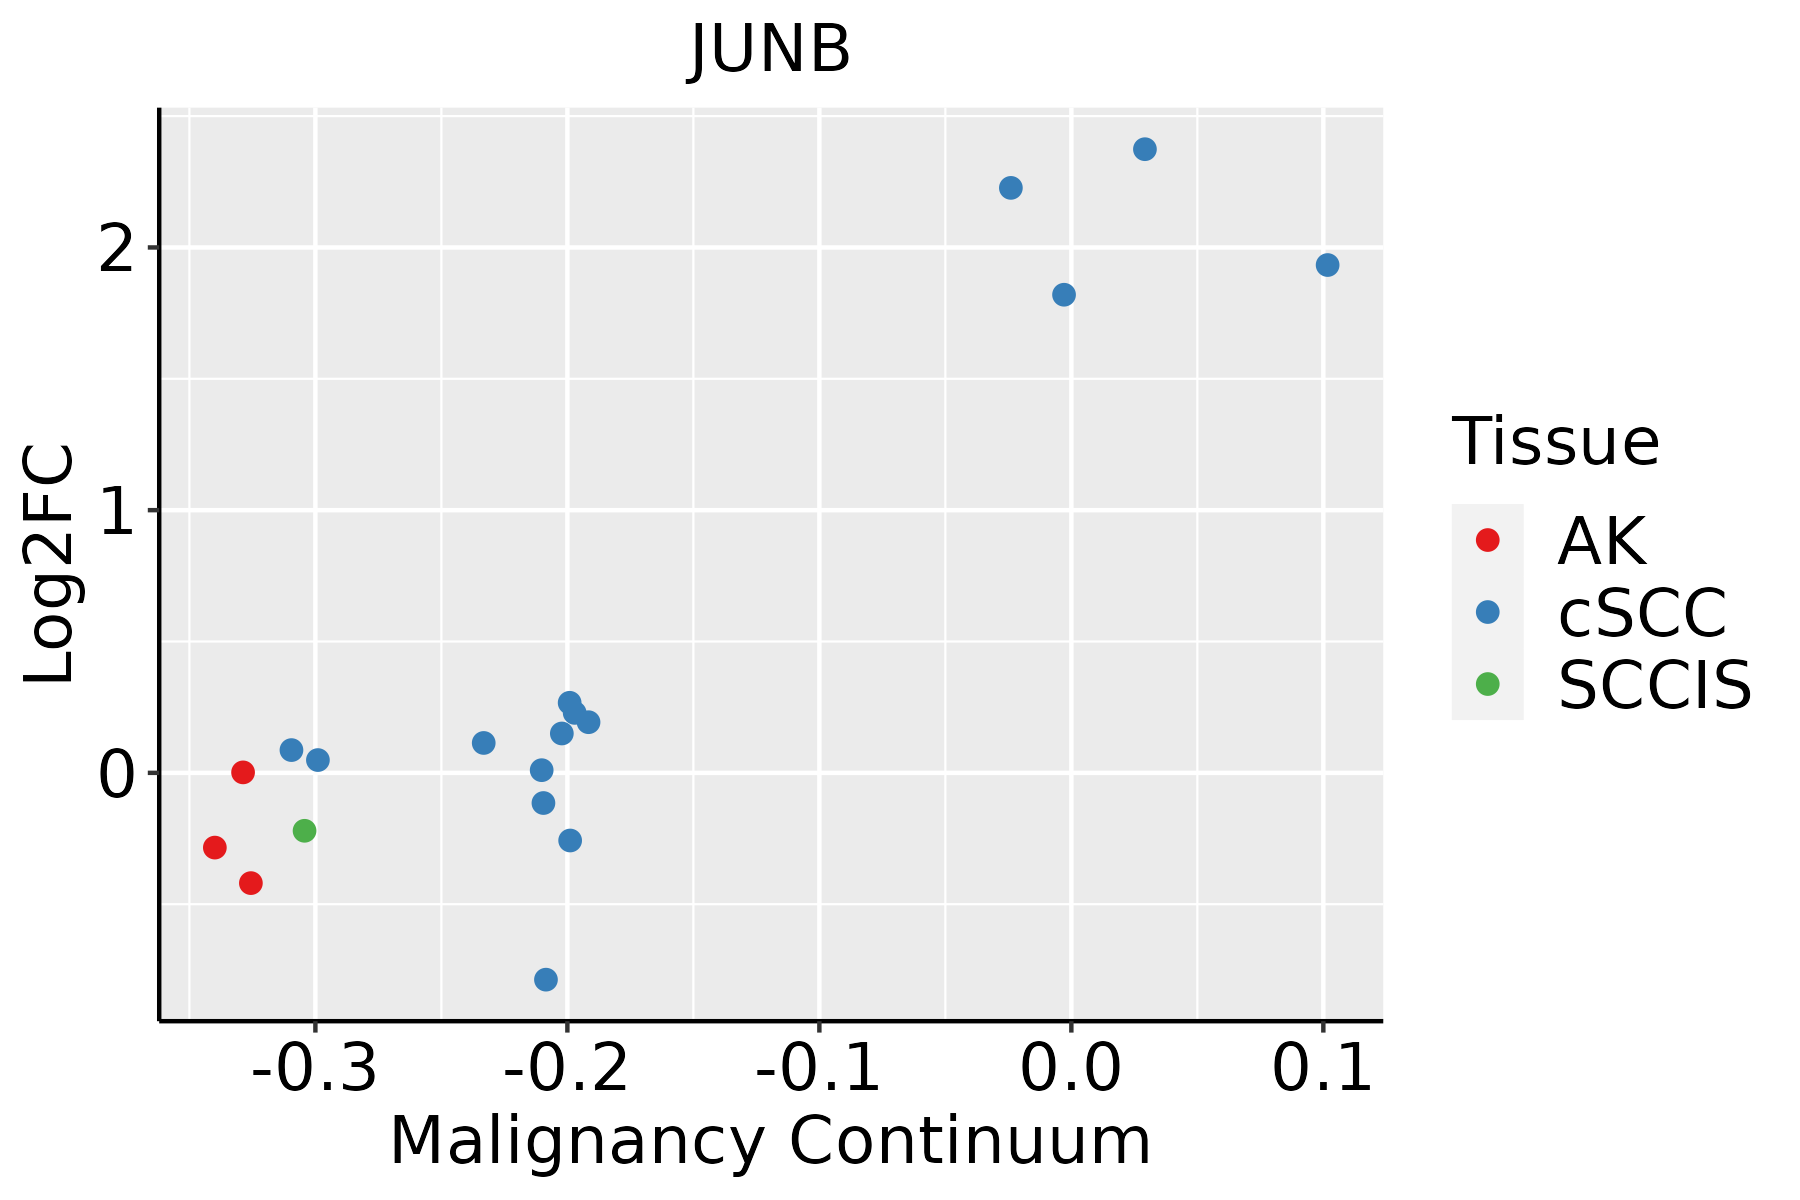 | AK: Actinic keratosis |
| cSCC: Cutaneous squamous cell carcinoma | ||
| SCCIS:squamous cell carcinoma in situ | ||
| Thyroid | 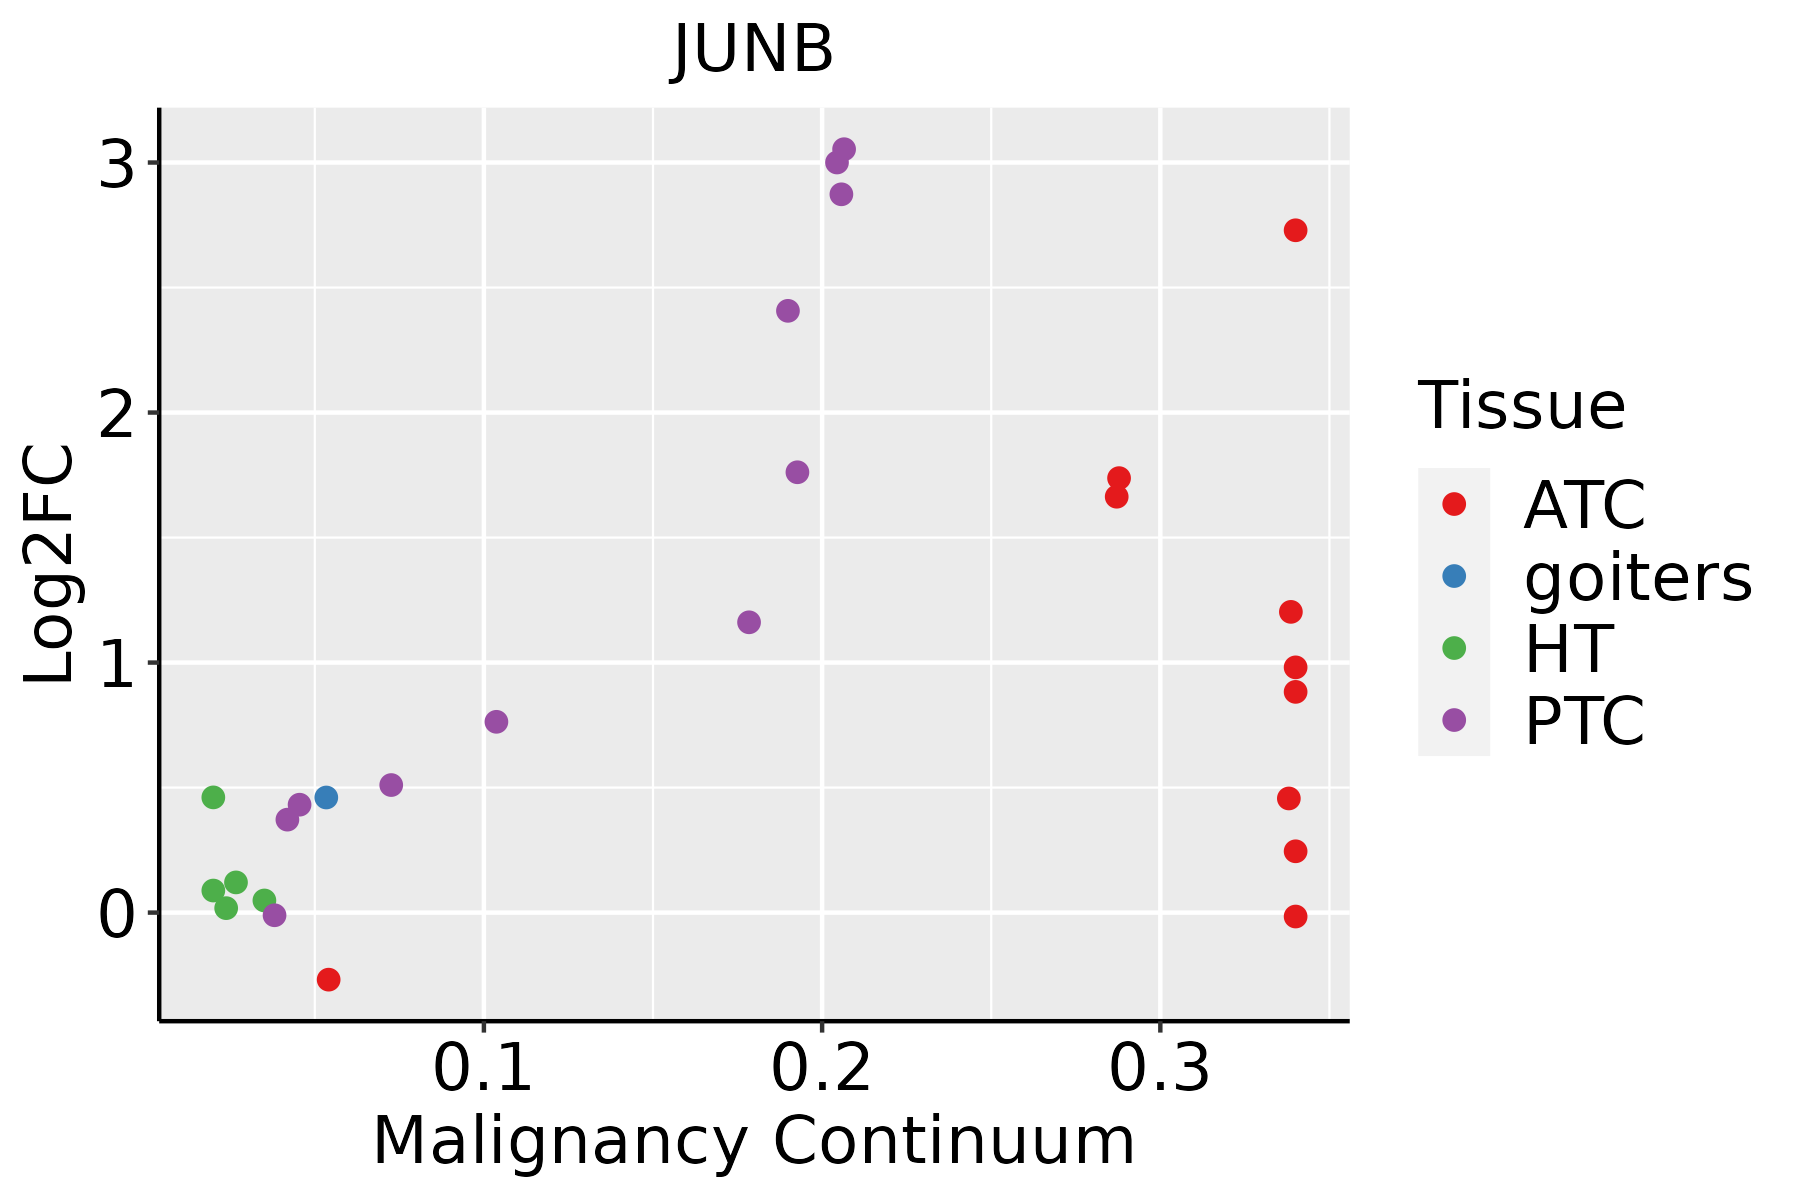 | ATC: Anaplastic thyroid cancer |
| HT: Hashimoto's thyroiditis | ||
| PTC: Papillary thyroid cancer |
| ∗log2FC in expression of this searched gene in stem-like cells from each diseased tissue sample relative to stem-like cells in normal samples in each tissue plotted against the malignancy continuum. Samples are colored based on if they are from different disease stage. |
Top |
Malignant transformation related pathway analysis |
| Find out the enriched GO biological processes and KEGG pathways involved in transition from healthy to precancer to cancer |
| Tissue | Disease Stage | Enriched GO biological Processes |
| Colorectum | AD |  |
| Colorectum | SER |  |
| Colorectum | MSS |  |
| Colorectum | MSI-H |  |
| Colorectum | FAP |  |
| ∗Top 15 enriched GO BP terms are showed in the bar plot of each disease state in each tissue. Each row represents a significant GO biological process which is colored according to the -log10(p.adjust). |
| Page: 1 2 3 4 5 6 7 8 9 |
| GO ID | Tissue | Disease Stage | Description | Gene Ratio | Bg Ratio | pvalue | p.adjust | Count |
| GO:005159218 | Thyroid | HT | response to calcium ion | 19/1272 | 149/18723 | 5.92e-03 | 3.76e-02 | 19 |
| GO:00466976 | Thyroid | HT | decidualization | 6/1272 | 26/18723 | 6.89e-03 | 4.20e-02 | 6 |
| GO:000257320 | Thyroid | HT | myeloid leukocyte differentiation | 24/1272 | 208/18723 | 7.69e-03 | 4.54e-02 | 24 |
| GO:0001701111 | Thyroid | PTC | in utero embryonic development | 175/5968 | 367/18723 | 1.40e-10 | 4.73e-09 | 175 |
| GO:0001503110 | Thyroid | PTC | ossification | 176/5968 | 408/18723 | 9.26e-07 | 1.40e-05 | 176 |
| GO:0030099113 | Thyroid | PTC | myeloid cell differentiation | 160/5968 | 381/18723 | 1.75e-05 | 1.82e-04 | 160 |
| GO:0010038112 | Thyroid | PTC | response to metal ion | 157/5968 | 373/18723 | 1.80e-05 | 1.86e-04 | 157 |
| GO:000189224 | Thyroid | PTC | embryonic placenta development | 44/5968 | 82/18723 | 3.51e-05 | 3.30e-04 | 44 |
| GO:0001649111 | Thyroid | PTC | osteoblast differentiation | 102/5968 | 229/18723 | 3.66e-05 | 3.40e-04 | 102 |
| GO:0061458112 | Thyroid | PTC | reproductive system development | 173/5968 | 427/18723 | 8.70e-05 | 7.23e-04 | 173 |
| GO:0048608111 | Thyroid | PTC | reproductive structure development | 170/5968 | 424/18723 | 1.86e-04 | 1.41e-03 | 170 |
| GO:0001890112 | Thyroid | PTC | placenta development | 66/5968 | 144/18723 | 3.06e-04 | 2.14e-03 | 66 |
| GO:000182513 | Thyroid | PTC | blastocyst formation | 22/5968 | 38/18723 | 8.19e-04 | 5.07e-03 | 22 |
| GO:00018246 | Thyroid | PTC | blastocyst development | 49/5968 | 106/18723 | 1.37e-03 | 7.72e-03 | 49 |
| GO:00606745 | Thyroid | PTC | placenta blood vessel development | 18/5968 | 30/18723 | 1.38e-03 | 7.74e-03 | 18 |
| GO:006071115 | Thyroid | PTC | labyrinthine layer development | 24/5968 | 44/18723 | 1.52e-03 | 8.49e-03 | 24 |
| GO:005159219 | Thyroid | PTC | response to calcium ion | 65/5968 | 149/18723 | 1.67e-03 | 9.16e-03 | 65 |
| GO:0071241110 | Thyroid | PTC | cellular response to inorganic substance | 92/5968 | 226/18723 | 3.01e-03 | 1.49e-02 | 92 |
| GO:000157011 | Thyroid | PTC | vasculogenesis | 36/5968 | 80/18723 | 9.35e-03 | 3.85e-02 | 36 |
| GO:00607161 | Thyroid | PTC | labyrinthine layer blood vessel development | 11/5968 | 18/18723 | 1.00e-02 | 4.07e-02 | 11 |
| Page: 1 2 3 4 5 6 7 8 9 10 11 12 13 14 15 16 17 18 19 20 21 22 23 24 25 |
| Pathway ID | Tissue | Disease Stage | Description | Gene Ratio | Bg Ratio | pvalue | p.adjust | qvalue | Count |
| hsa046686 | Cervix | CC | TNF signaling pathway | 28/1267 | 114/8465 | 4.60e-03 | 1.62e-02 | 9.59e-03 | 28 |
| hsa0466813 | Cervix | CC | TNF signaling pathway | 28/1267 | 114/8465 | 4.60e-03 | 1.62e-02 | 9.59e-03 | 28 |
| hsa04935 | Colorectum | MSS | Growth hormone synthesis, secretion and action | 42/1875 | 120/8465 | 8.17e-04 | 5.16e-03 | 3.16e-03 | 42 |
| hsa049351 | Colorectum | MSS | Growth hormone synthesis, secretion and action | 42/1875 | 120/8465 | 8.17e-04 | 5.16e-03 | 3.16e-03 | 42 |
| hsa046687 | Endometrium | EEC | TNF signaling pathway | 27/1237 | 114/8465 | 6.47e-03 | 3.22e-02 | 2.40e-02 | 27 |
| hsa0466814 | Endometrium | EEC | TNF signaling pathway | 27/1237 | 114/8465 | 6.47e-03 | 3.22e-02 | 2.40e-02 | 27 |
| hsa0466810 | Esophagus | ESCC | TNF signaling pathway | 89/4205 | 114/8465 | 3.36e-10 | 4.01e-09 | 2.06e-09 | 89 |
| hsa0466817 | Esophagus | ESCC | TNF signaling pathway | 89/4205 | 114/8465 | 3.36e-10 | 4.01e-09 | 2.06e-09 | 89 |
| hsa046684 | Liver | HCC | TNF signaling pathway | 73/4020 | 114/8465 | 2.53e-04 | 1.19e-03 | 6.63e-04 | 73 |
| hsa0466811 | Liver | HCC | TNF signaling pathway | 73/4020 | 114/8465 | 2.53e-04 | 1.19e-03 | 6.63e-04 | 73 |
| hsa046682 | Liver | Cyst | TNF signaling pathway | 12/339 | 114/8465 | 1.96e-03 | 1.88e-02 | 1.56e-02 | 12 |
| hsa046683 | Liver | Cyst | TNF signaling pathway | 12/339 | 114/8465 | 1.96e-03 | 1.88e-02 | 1.56e-02 | 12 |
| hsa046685 | Lung | IAC | TNF signaling pathway | 25/1053 | 114/8465 | 3.01e-03 | 1.53e-02 | 1.02e-02 | 25 |
| hsa04380 | Lung | IAC | Osteoclast differentiation | 27/1053 | 128/8465 | 3.74e-03 | 1.84e-02 | 1.22e-02 | 27 |
| hsa049356 | Lung | IAC | Growth hormone synthesis, secretion and action | 24/1053 | 120/8465 | 1.18e-02 | 4.22e-02 | 2.80e-02 | 24 |
| hsa0466812 | Lung | IAC | TNF signaling pathway | 25/1053 | 114/8465 | 3.01e-03 | 1.53e-02 | 1.02e-02 | 25 |
| hsa043801 | Lung | IAC | Osteoclast differentiation | 27/1053 | 128/8465 | 3.74e-03 | 1.84e-02 | 1.22e-02 | 27 |
| hsa0493511 | Lung | IAC | Growth hormone synthesis, secretion and action | 24/1053 | 120/8465 | 1.18e-02 | 4.22e-02 | 2.80e-02 | 24 |
| hsa0493521 | Lung | AIS | Growth hormone synthesis, secretion and action | 23/961 | 120/8465 | 7.85e-03 | 3.58e-02 | 2.29e-02 | 23 |
| hsa0493531 | Lung | AIS | Growth hormone synthesis, secretion and action | 23/961 | 120/8465 | 7.85e-03 | 3.58e-02 | 2.29e-02 | 23 |
| Page: 1 2 |
Top |
Cell-cell communication analysis |
| Identification of potential cell-cell interactions between two cell types and their ligand-receptor pairs for different disease states |
| Ligand | Receptor | LRpair | Pathway | Tissue | Disease Stage |
| Page: 1 |
Top |
Single-cell gene regulatory network inference analysis |
| Find out the significant the regulons (TFs) and the target genes of each regulon across cell types for different disease states |
| TF | Cell Type | Tissue | Disease Stage | Target Gene | RSS | Regulon Activity |
| JUNB | INCAF | Colorectum | FAP | SOCS3,ZFP36,CEBPB, etc. | 1.35e-01 |  |
| JUNB | NEUT | Esophagus | Healthy | DCN,MGP,EIF1, etc. | 7.24e-01 |  |
| JUNB | STM | Liver | Cirrhotic | FOS,DEPP1,CTD-3252C9.4, etc. | 3.93e-01 |  |
| ∗The dot plots of a searched regulon are shown for all cell subpopulations in each disease state of each tissue based on the regulon specific score inferred using pySCENIC and by calculating the average expression. |
| Page: 1 |
Top |
Somatic mutation of malignant transformation related genes |
| Annotation of somatic variants for genes involved in malignant transformation |
| Hugo Symbol | Variant Class | Variant Classification | dbSNP RS | HGVSc | HGVSp | HGVSp Short | SWISSPROT | BIOTYPE | SIFT | PolyPhen | Tumor Sample Barcode | Tissue | Histology | Sex | Age | Stage | Therapy Types | Drugs | Outcome |
| JUNB | SNV | Missense_Mutation | novel | c.1003N>A | p.Gly335Ser | p.G335S | P17275 | protein_coding | deleterious(0) | probably_damaging(0.997) | TCGA-2W-A8YY-01 | Cervix | cervical & endocervical cancer | Female | <65 | I/II | Chemotherapy | cisplatin | CR |
| JUNB | SNV | Missense_Mutation | rs781257277 | c.167G>C | p.Arg56Pro | p.R56P | P17275 | protein_coding | tolerated(0.14) | benign(0.009) | TCGA-C5-A905-01 | Cervix | cervical & endocervical cancer | Female | <65 | I/II | Unknown | Unknown | SD |
| JUNB | SNV | Missense_Mutation | c.879N>G | p.Ile293Met | p.I293M | P17275 | protein_coding | deleterious(0) | probably_damaging(0.998) | TCGA-IR-A3LK-01 | Cervix | cervical & endocervical cancer | Female | >=65 | I/II | Chemotherapy | cisplatin | PD | |
| JUNB | deletion | Frame_Shift_Del | c.340delN | p.Gly115ValfsTer35 | p.G115Vfs*35 | P17275 | protein_coding | TCGA-A6-2686-01 | Colorectum | colon adenocarcinoma | Female | >=65 | I/II | Unknown | Unknown | SD | |||
| JUNB | deletion | Frame_Shift_Del | c.340delN | p.Gly115ValfsTer35 | p.G115Vfs*35 | P17275 | protein_coding | TCGA-AA-3492-01 | Colorectum | colon adenocarcinoma | Female | >=65 | I/II | Unknown | Unknown | SD | |||
| JUNB | deletion | Frame_Shift_Del | c.373delN | p.Gly126AlafsTer24 | p.G126Afs*24 | P17275 | protein_coding | TCGA-DM-A1HB-01 | Colorectum | colon adenocarcinoma | Male | >=65 | III/IV | Unknown | Unknown | SD | |||
| JUNB | deletion | Frame_Shift_Del | c.373delN | p.Gly126AlafsTer24 | p.G126Afs*24 | P17275 | protein_coding | TCGA-EI-6507-01 | Colorectum | rectum adenocarcinoma | Male | <65 | I/II | Unknown | Unknown | SD | |||
| JUNB | SNV | Missense_Mutation | novel | c.10N>G | p.Lys4Glu | p.K4E | P17275 | protein_coding | deleterious(0.02) | benign(0.269) | TCGA-A5-A2K3-01 | Endometrium | uterine corpus endometrioid carcinoma | Female | >=65 | I/II | Chemotherapy | carboplatin | SD |
| JUNB | deletion | Frame_Shift_Del | c.340delN | p.Gly115ValfsTer35 | p.G115Vfs*35 | P17275 | protein_coding | TCGA-SL-A6JA-01 | Endometrium | uterine corpus endometrioid carcinoma | Female | >=65 | I/II | Unknown | Unknown | SD | |||
| JUNB | SNV | Missense_Mutation | c.394C>A | p.Gln132Lys | p.Q132K | P17275 | protein_coding | deleterious(0) | possibly_damaging(0.79) | TCGA-RC-A7SF-01 | Liver | liver hepatocellular carcinoma | Male | >=65 | I/II | Unknown | Unknown | PD |
| Page: 1 2 |
Top |
Related drugs of malignant transformation related genes |
| Identification of chemicals and drugs interact with genes involved in malignant transfromation |
| (DGIdb 4.0) |
| Entrez ID | Symbol | Category | Interaction Types | Drug Claim Name | Drug Name | PMIDs |
| 3726 | JUNB | TRANSCRIPTION FACTOR, TRANSCRIPTION FACTOR BINDING, TRANSCRIPTION FACTOR COMPLEX, TUMOR SUPPRESSOR | UVB | 9607142 | ||
| 3726 | JUNB | TRANSCRIPTION FACTOR, TRANSCRIPTION FACTOR BINDING, TRANSCRIPTION FACTOR COMPLEX, TUMOR SUPPRESSOR | INSULIN | INSULIN | 8264634 | |
| 3726 | JUNB | TRANSCRIPTION FACTOR, TRANSCRIPTION FACTOR BINDING, TRANSCRIPTION FACTOR COMPLEX, TUMOR SUPPRESSOR | CYTOKINES | 9591138 | ||
| 3726 | JUNB | TRANSCRIPTION FACTOR, TRANSCRIPTION FACTOR BINDING, TRANSCRIPTION FACTOR COMPLEX, TUMOR SUPPRESSOR | DEXAMETHASONE | DEXAMETHASONE | 9024781 |
| Page: 1 |

Copyright 2023-Present -The University of Texas Health Science Center at Houston |