
|
|||||
|
 | |
| |
| |
| |
| |
| |
|
Gene: IRF1 |
Gene summary for IRF1 |
| Gene information | Species | Human | Gene symbol | IRF1 | Gene ID | 3659 |
| Gene name | interferon regulatory factor 1 | |
| Gene Alias | IRF-1 | |
| Cytomap | 5q31.1 | |
| Gene Type | protein-coding | GO ID | GO:0001775 | UniProtAcc | P10914 |
Top |
Malignant transformation analysis |
| Identification of the aberrant gene expression in precancerous and cancerous lesions by comparing the gene expression of stem-like cells in diseased tissues with normal stem cells |
| Entrez ID | Symbol | Replicates | Species | Organ | Tissue | Adj P-value | Log2FC | Malignancy |
| 3659 | IRF1 | GSM4909282 | Human | Breast | IDC | 5.39e-06 | -3.15e-01 | -0.0288 |
| 3659 | IRF1 | GSM4909285 | Human | Breast | IDC | 2.57e-09 | -4.63e-01 | 0.21 |
| 3659 | IRF1 | GSM4909286 | Human | Breast | IDC | 8.76e-14 | -4.62e-01 | 0.1081 |
| 3659 | IRF1 | GSM4909289 | Human | Breast | IDC | 4.40e-04 | -5.20e-01 | 0.1064 |
| 3659 | IRF1 | GSM4909290 | Human | Breast | IDC | 9.40e-06 | -3.60e-01 | 0.2096 |
| 3659 | IRF1 | GSM4909291 | Human | Breast | IDC | 5.05e-03 | -3.20e-01 | 0.1753 |
| 3659 | IRF1 | GSM4909294 | Human | Breast | IDC | 1.21e-10 | -4.00e-01 | 0.2022 |
| 3659 | IRF1 | GSM4909296 | Human | Breast | IDC | 4.85e-08 | -2.99e-01 | 0.1524 |
| 3659 | IRF1 | GSM4909297 | Human | Breast | IDC | 1.65e-14 | -3.42e-01 | 0.1517 |
| 3659 | IRF1 | GSM4909302 | Human | Breast | IDC | 2.58e-03 | -2.25e-01 | 0.1545 |
| 3659 | IRF1 | GSM4909304 | Human | Breast | IDC | 1.74e-13 | -4.45e-01 | 0.1636 |
| 3659 | IRF1 | GSM4909306 | Human | Breast | IDC | 4.69e-04 | -3.24e-01 | 0.1564 |
| 3659 | IRF1 | GSM4909307 | Human | Breast | IDC | 9.04e-08 | -3.91e-01 | 0.1569 |
| 3659 | IRF1 | GSM4909309 | Human | Breast | IDC | 2.07e-03 | -2.84e-01 | 0.0483 |
| 3659 | IRF1 | GSM4909311 | Human | Breast | IDC | 2.60e-17 | -4.32e-01 | 0.1534 |
| 3659 | IRF1 | GSM4909312 | Human | Breast | IDC | 4.18e-07 | -2.65e-01 | 0.1552 |
| 3659 | IRF1 | GSM4909315 | Human | Breast | IDC | 5.22e-08 | -3.92e-01 | 0.21 |
| 3659 | IRF1 | GSM4909316 | Human | Breast | IDC | 1.28e-03 | -3.87e-01 | 0.21 |
| 3659 | IRF1 | GSM4909319 | Human | Breast | IDC | 2.57e-24 | -3.33e-01 | 0.1563 |
| 3659 | IRF1 | GSM4909321 | Human | Breast | IDC | 1.25e-02 | -4.30e-02 | 0.1559 |
| Page: 1 2 3 4 5 6 7 8 9 10 |
| Tissue | Expression Dynamics | Abbreviation |
| Breast | 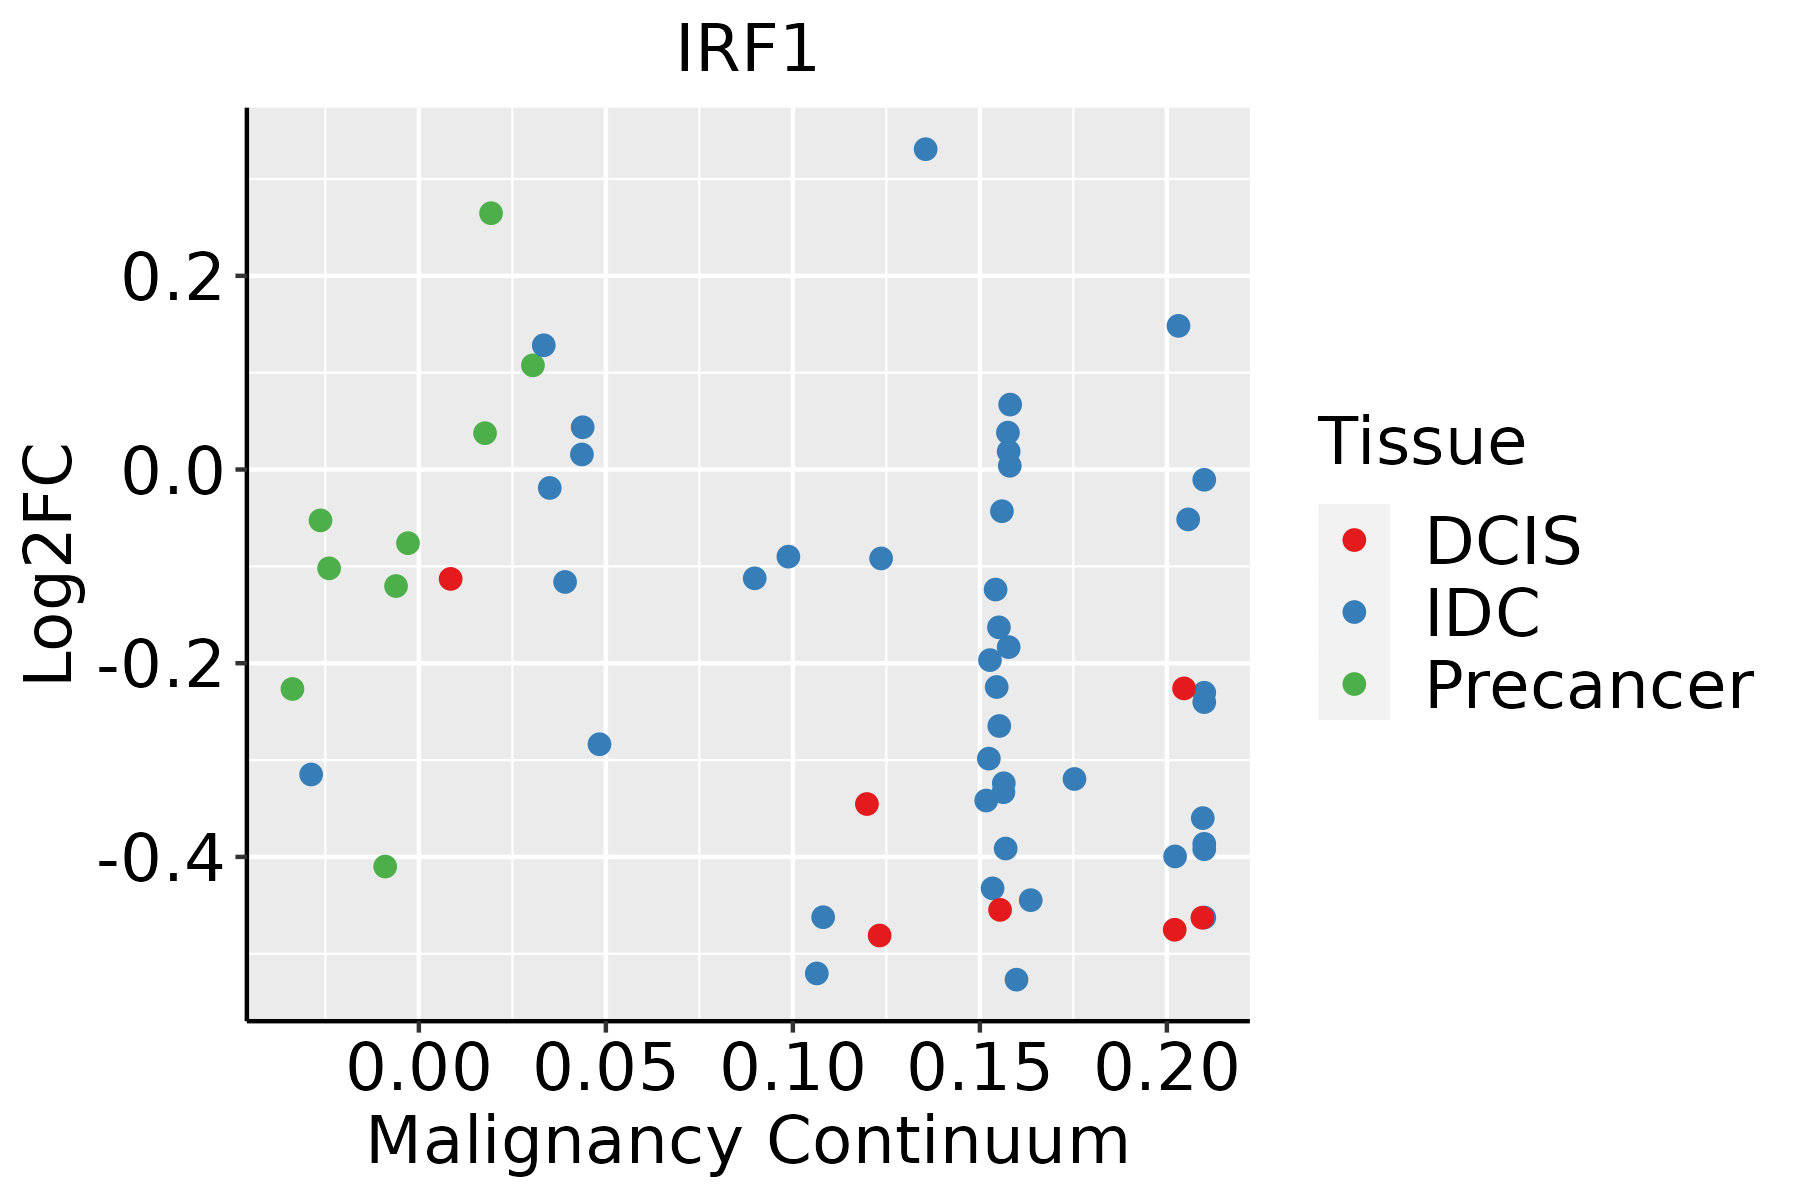 | IDC: Invasive ductal carcinoma |
| DCIS: Ductal carcinoma in situ | ||
| Precancer(BRCA1-mut): Precancerous lesion from BRCA1 mutation carriers | ||
| Cervix | 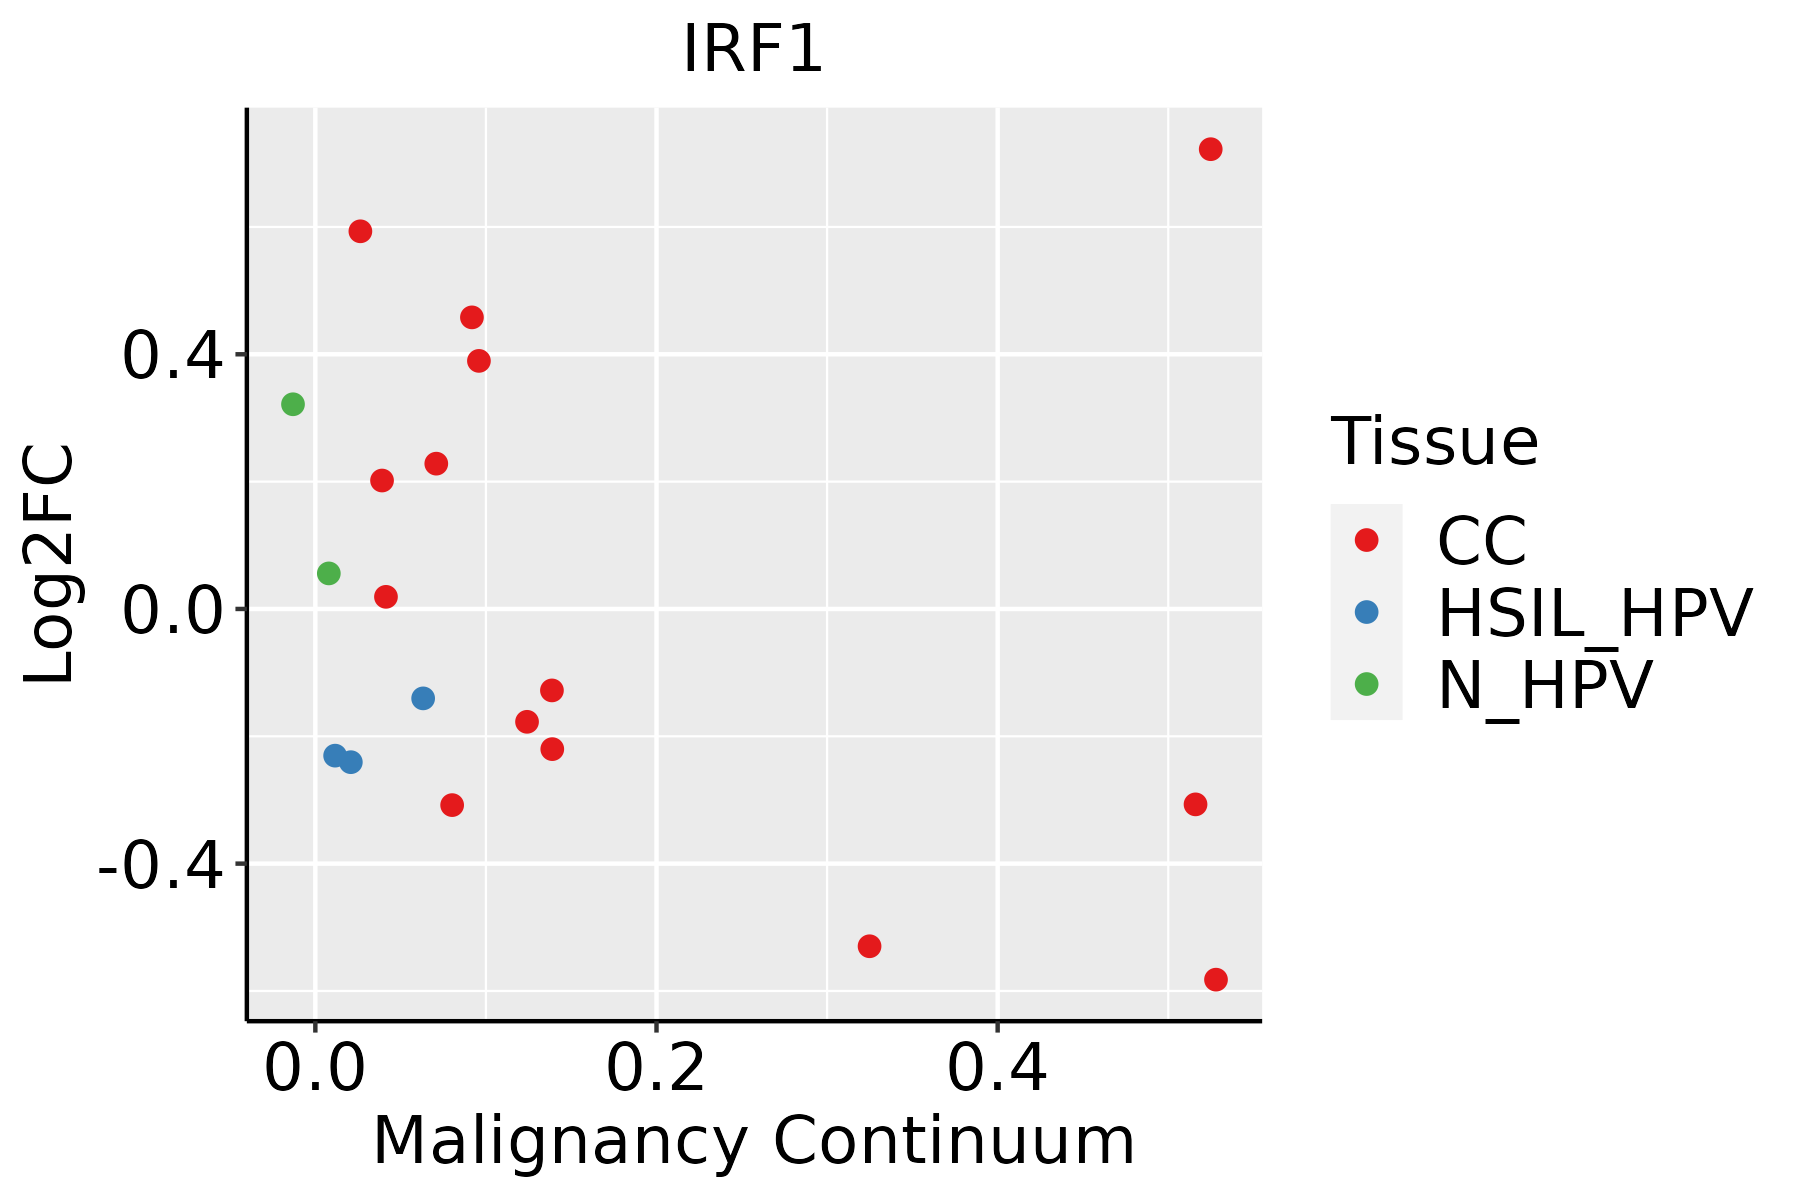 | CC: Cervix cancer |
| HSIL_HPV: HPV-infected high-grade squamous intraepithelial lesions | ||
| N_HPV: HPV-infected normal cervix | ||
| Colorectum (GSE201348) |  | FAP: Familial adenomatous polyposis |
| CRC: Colorectal cancer | ||
| Colorectum (HTA11) |  | AD: Adenomas |
| SER: Sessile serrated lesions | ||
| MSI-H: Microsatellite-high colorectal cancer | ||
| MSS: Microsatellite stable colorectal cancer | ||
| Endometrium | 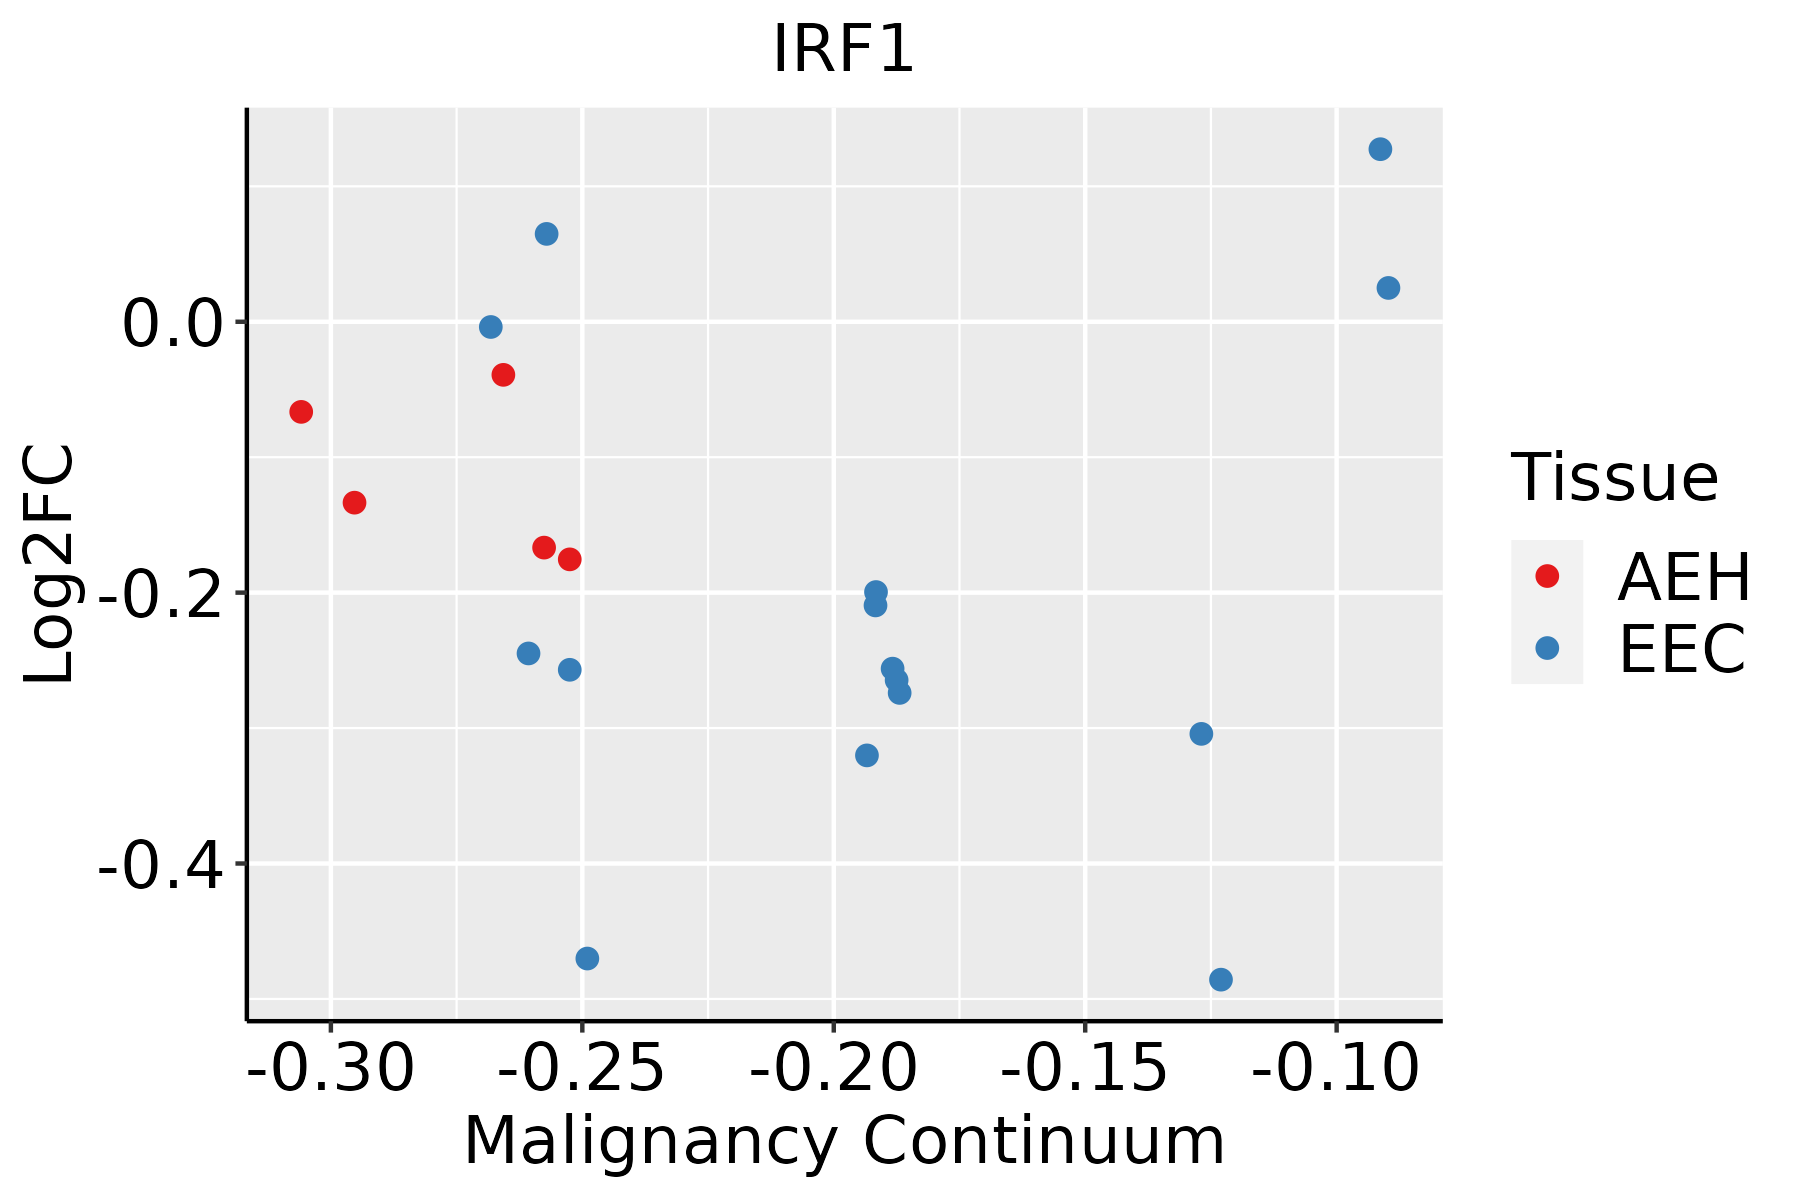 | AEH: Atypical endometrial hyperplasia |
| EEC: Endometrioid Cancer | ||
| Esophagus |  | ESCC: Esophageal squamous cell carcinoma |
| HGIN: High-grade intraepithelial neoplasias | ||
| LGIN: Low-grade intraepithelial neoplasias | ||
| Liver | 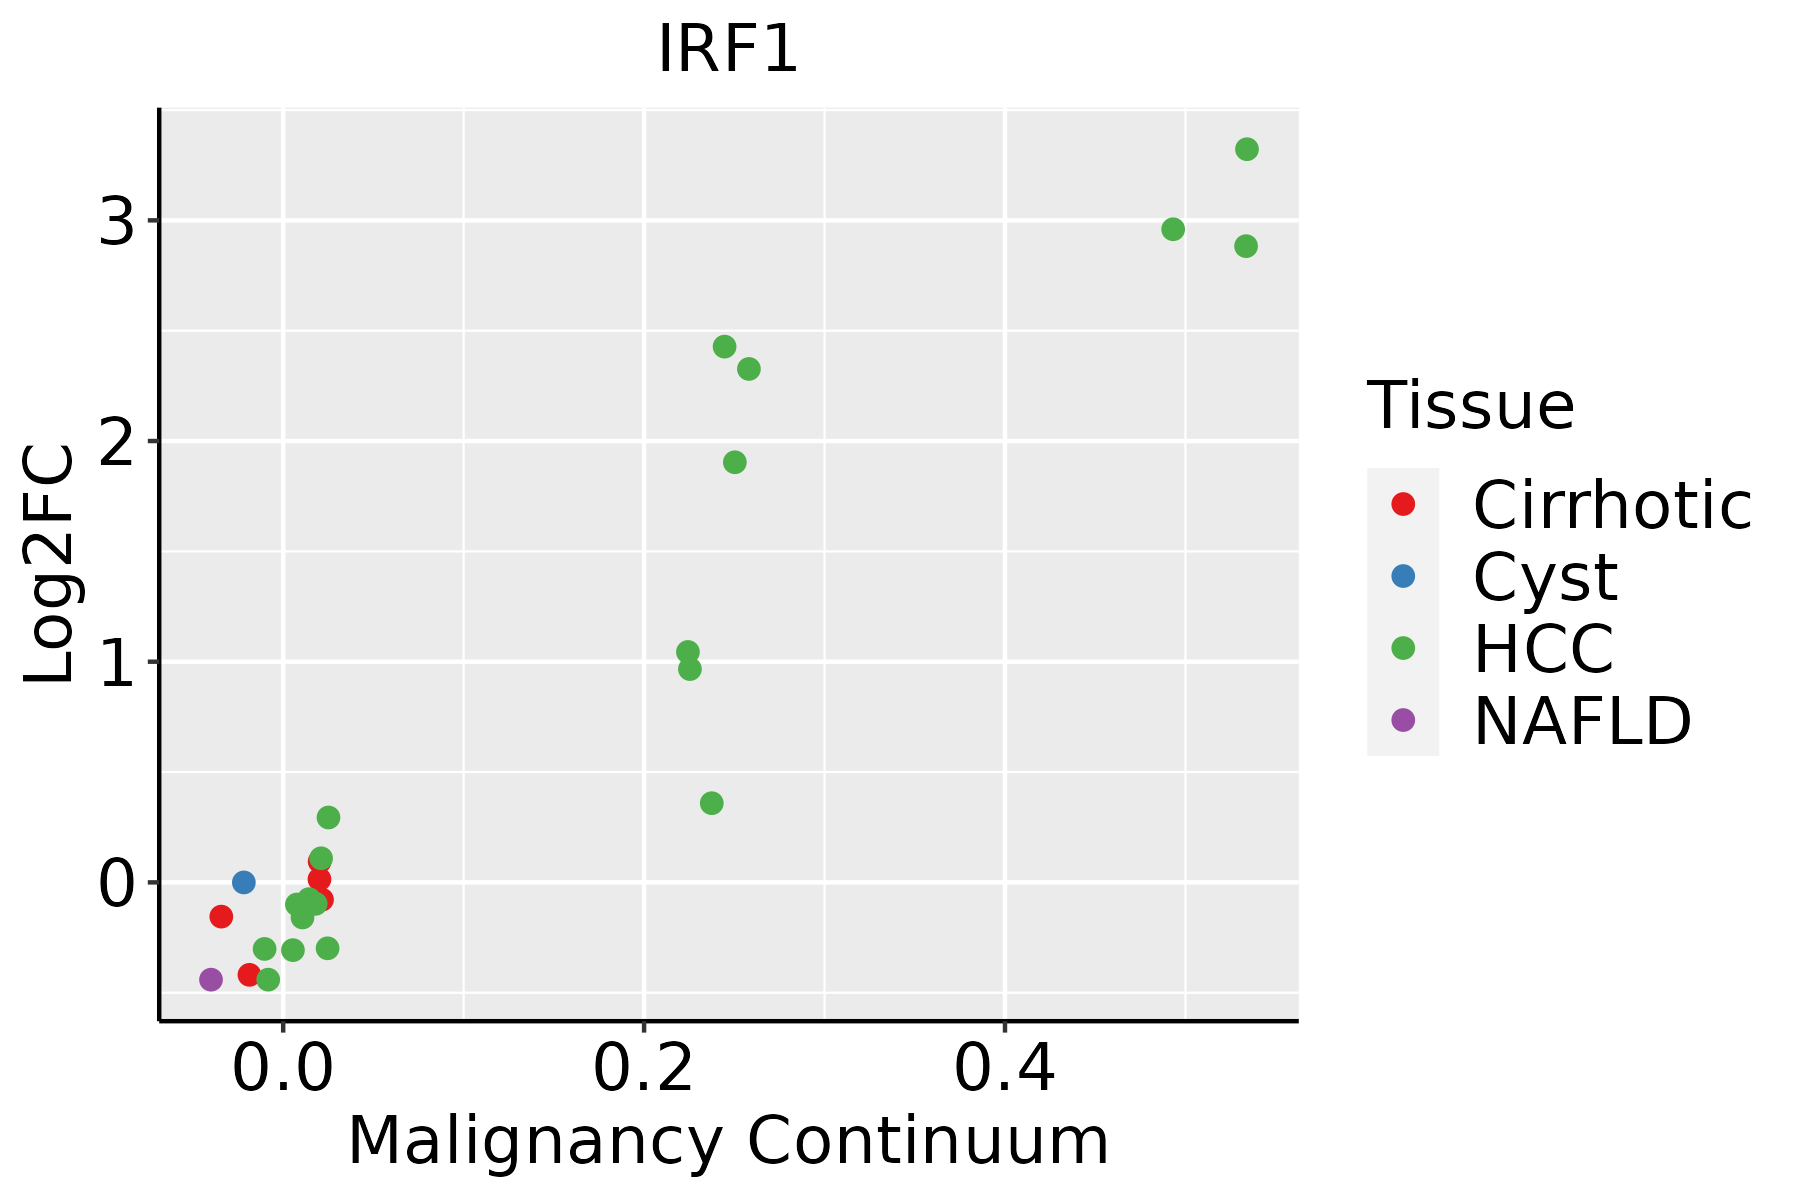 | HCC: Hepatocellular carcinoma |
| NAFLD: Non-alcoholic fatty liver disease | ||
| Oral Cavity | 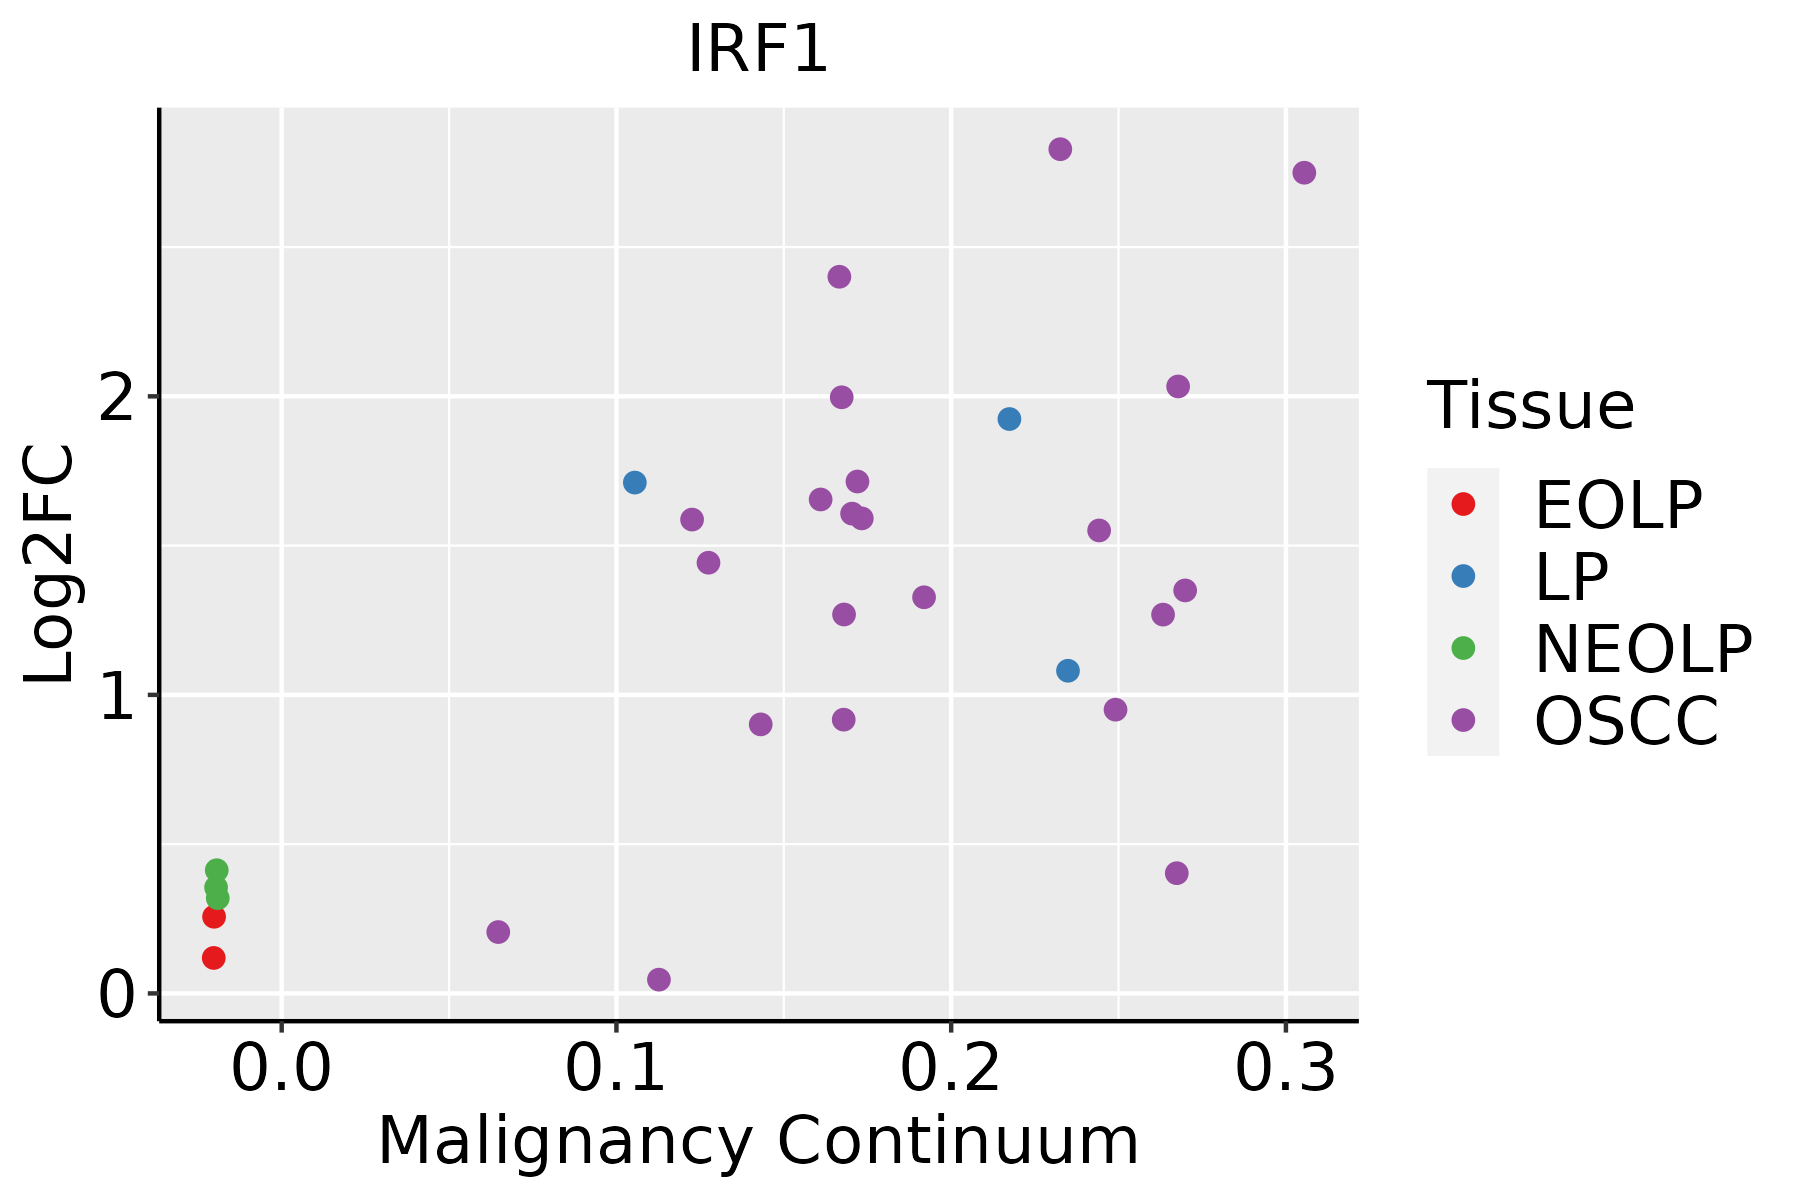 | EOLP: Erosive Oral lichen planus |
| LP: leukoplakia | ||
| NEOLP: Non-erosive oral lichen planus | ||
| OSCC: Oral squamous cell carcinoma | ||
| Prostate | 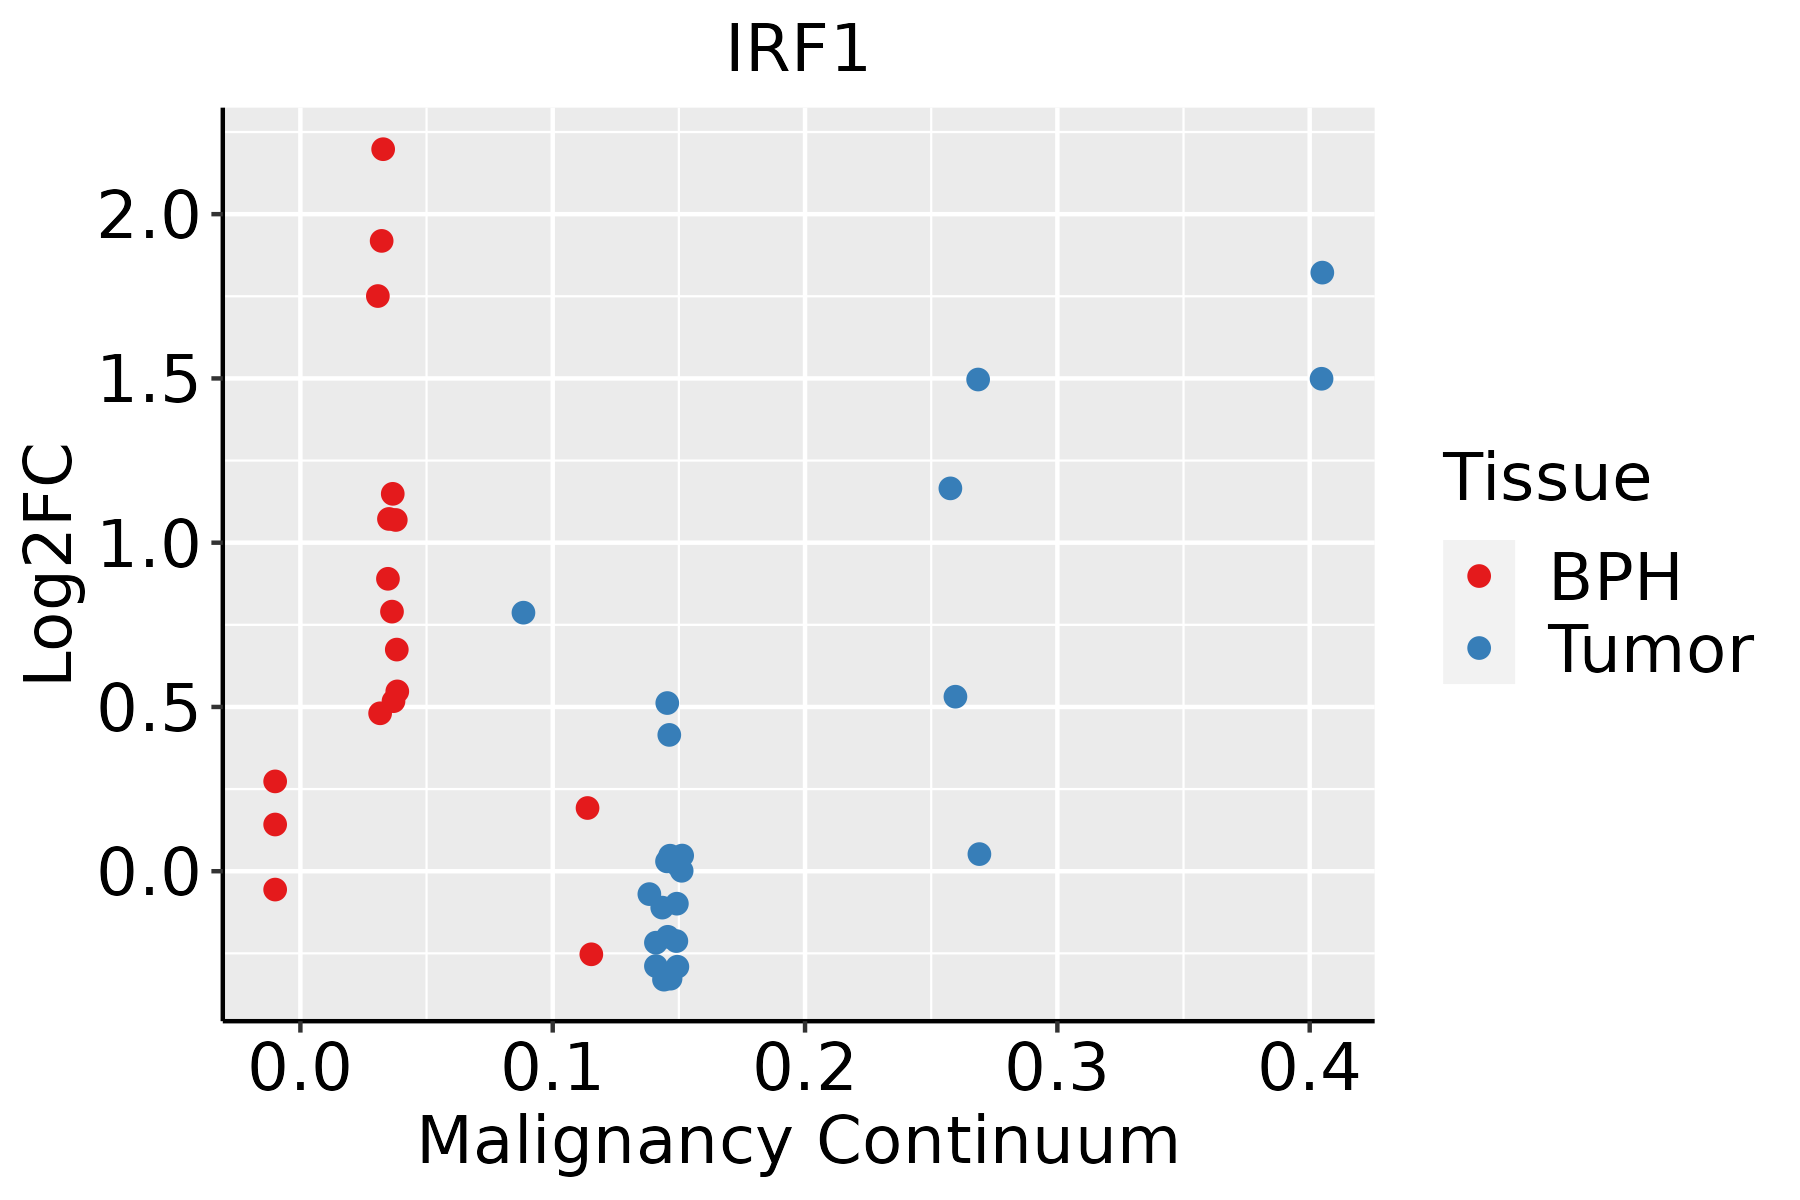 | BPH: Benign Prostatic Hyperplasia |
| Skin | 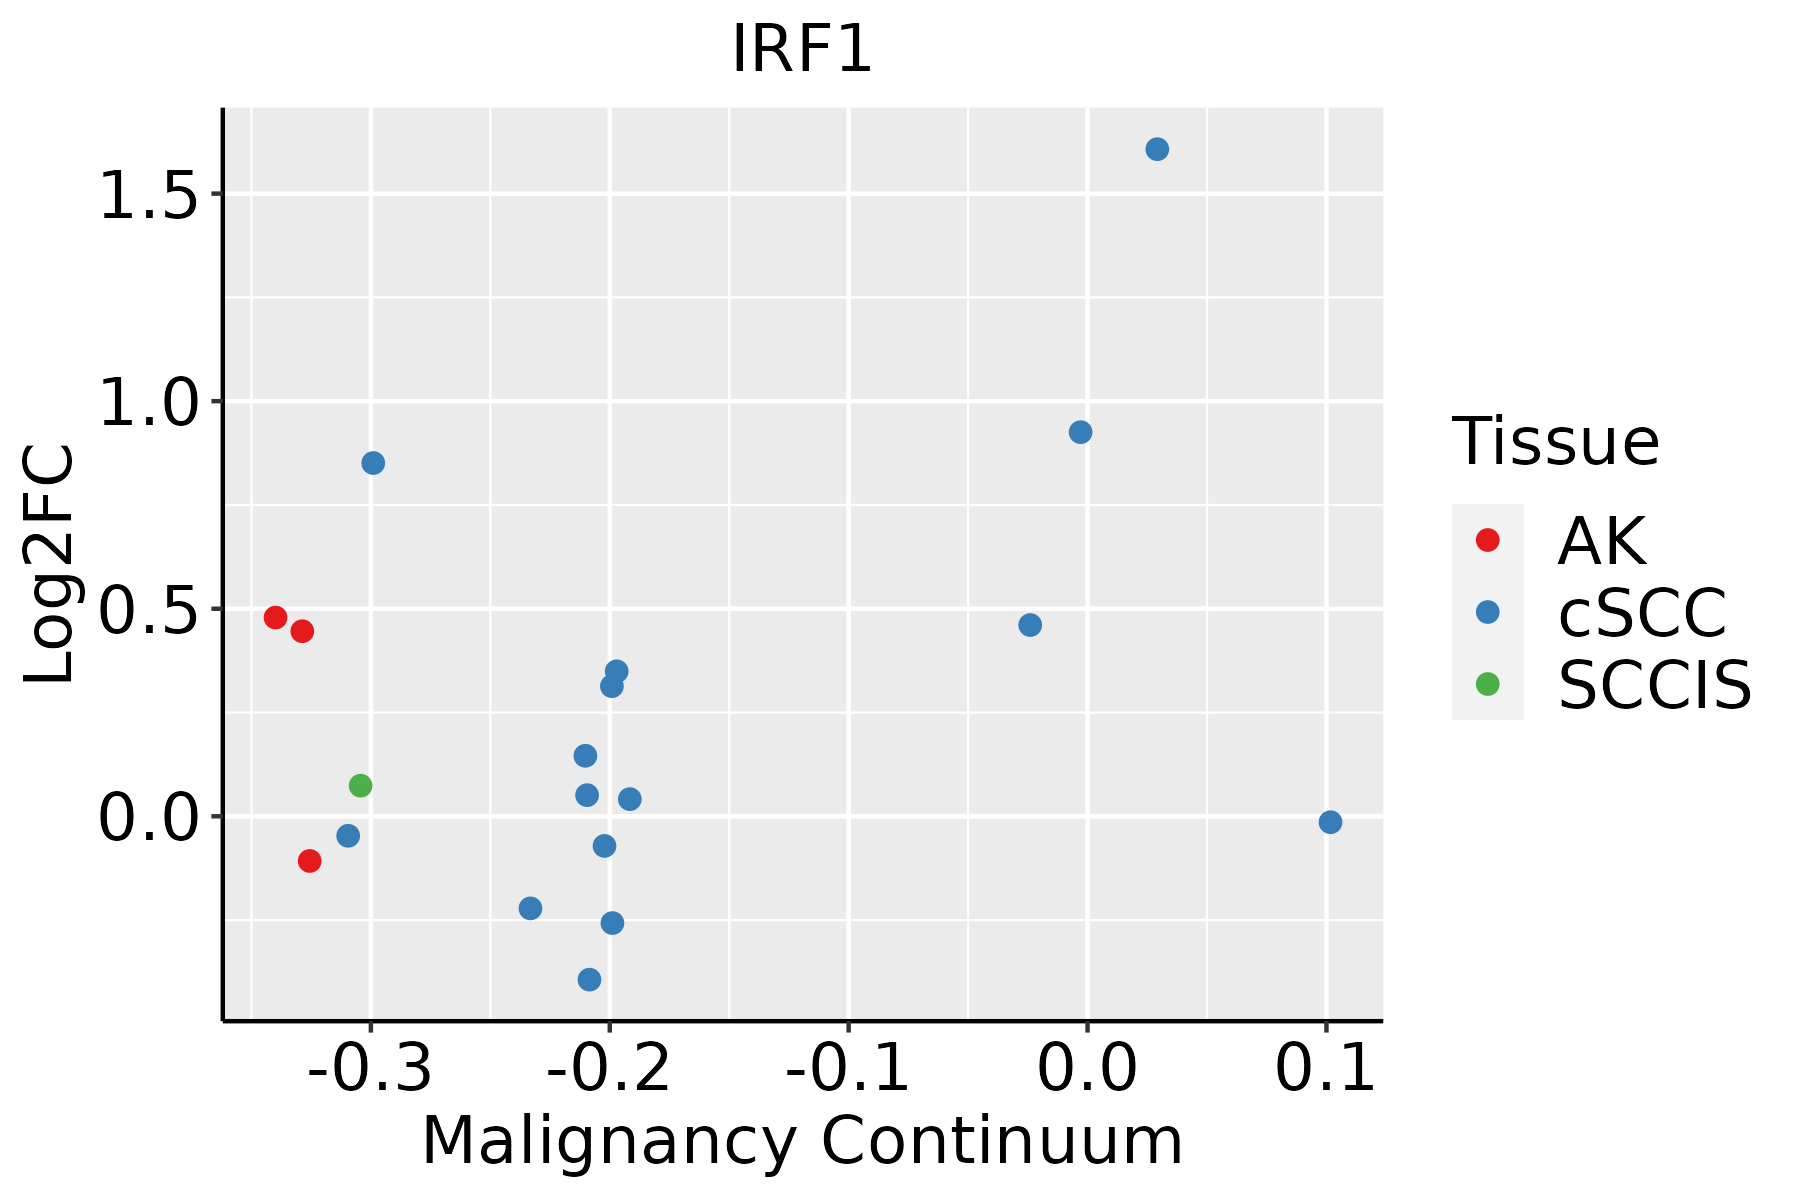 | AK: Actinic keratosis |
| cSCC: Cutaneous squamous cell carcinoma | ||
| SCCIS:squamous cell carcinoma in situ | ||
| Thyroid |  | ATC: Anaplastic thyroid cancer |
| HT: Hashimoto's thyroiditis | ||
| PTC: Papillary thyroid cancer |
| ∗log2FC in expression of this searched gene in stem-like cells from each diseased tissue sample relative to stem-like cells in normal samples in each tissue plotted against the malignancy continuum. Samples are colored based on if they are from different disease stage. |
Top |
Malignant transformation related pathway analysis |
| Find out the enriched GO biological processes and KEGG pathways involved in transition from healthy to precancer to cancer |
| Tissue | Disease Stage | Enriched GO biological Processes |
| Colorectum | AD |  |
| Colorectum | SER |  |
| Colorectum | MSS |  |
| Colorectum | MSI-H |  |
| Colorectum | FAP |  |
| ∗Top 15 enriched GO BP terms are showed in the bar plot of each disease state in each tissue. Each row represents a significant GO biological process which is colored according to the -log10(p.adjust). |
| Page: 1 2 3 4 5 6 7 8 9 |
| GO ID | Tissue | Disease Stage | Description | Gene Ratio | Bg Ratio | pvalue | p.adjust | Count |
| GO:000716215 | Prostate | Tumor | negative regulation of cell adhesion | 82/3246 | 303/18723 | 1.38e-05 | 1.89e-04 | 82 |
| GO:002240717 | Prostate | Tumor | regulation of cell-cell adhesion | 112/3246 | 448/18723 | 2.20e-05 | 2.80e-04 | 112 |
| GO:190210513 | Prostate | Tumor | regulation of leukocyte differentiation | 74/3246 | 279/18723 | 7.23e-05 | 7.63e-04 | 74 |
| GO:000961214 | Prostate | Tumor | response to mechanical stimulus | 60/3246 | 216/18723 | 8.45e-05 | 8.46e-04 | 60 |
| GO:004211015 | Prostate | Tumor | T cell activation | 117/3246 | 487/18723 | 9.22e-05 | 9.05e-04 | 117 |
| GO:007126013 | Prostate | Tumor | cellular response to mechanical stimulus | 28/3246 | 81/18723 | 1.39e-04 | 1.27e-03 | 28 |
| GO:190313113 | Prostate | Tumor | mononuclear cell differentiation | 102/3246 | 426/18723 | 2.87e-04 | 2.32e-03 | 102 |
| GO:000181914 | Prostate | Tumor | positive regulation of cytokine production | 109/3246 | 467/18723 | 4.98e-04 | 3.67e-03 | 109 |
| GO:000715915 | Prostate | Tumor | leukocyte cell-cell adhesion | 89/3246 | 371/18723 | 6.33e-04 | 4.52e-03 | 89 |
| GO:000268314 | Prostate | Tumor | negative regulation of immune system process | 101/3246 | 434/18723 | 8.70e-04 | 5.85e-03 | 101 |
| GO:190303714 | Prostate | Tumor | regulation of leukocyte cell-cell adhesion | 81/3246 | 336/18723 | 9.26e-04 | 6.10e-03 | 81 |
| GO:005086314 | Prostate | Tumor | regulation of T cell activation | 78/3246 | 329/18723 | 1.86e-03 | 1.09e-02 | 78 |
| GO:003009811 | Prostate | Tumor | lymphocyte differentiation | 87/3246 | 374/18723 | 1.93e-03 | 1.12e-02 | 87 |
| GO:004663411 | Prostate | Tumor | regulation of alpha-beta T cell activation | 30/3246 | 104/18723 | 2.48e-03 | 1.38e-02 | 30 |
| GO:004561911 | Prostate | Tumor | regulation of lymphocyte differentiation | 45/3246 | 174/18723 | 2.93e-03 | 1.58e-02 | 45 |
| GO:004663111 | Prostate | Tumor | alpha-beta T cell activation | 41/3246 | 156/18723 | 3.21e-03 | 1.68e-02 | 41 |
| GO:00466331 | Prostate | Tumor | alpha-beta T cell proliferation | 14/3246 | 38/18723 | 3.24e-03 | 1.69e-02 | 14 |
| GO:00466401 | Prostate | Tumor | regulation of alpha-beta T cell proliferation | 13/3246 | 35/18723 | 4.14e-03 | 2.08e-02 | 13 |
| GO:003434113 | Prostate | Tumor | response to interferon-gamma | 37/3246 | 141/18723 | 5.07e-03 | 2.46e-02 | 37 |
| GO:003545611 | Prostate | Tumor | response to interferon-beta | 12/3246 | 32/18723 | 5.30e-03 | 2.54e-02 | 12 |
| Page: 1 2 3 4 5 6 7 8 9 10 11 12 13 14 15 16 17 18 19 20 21 22 23 24 25 26 27 28 29 |
| Pathway ID | Tissue | Disease Stage | Description | Gene Ratio | Bg Ratio | pvalue | p.adjust | qvalue | Count |
| hsa051336 | Breast | DCIS | Pertussis | 15/846 | 76/8465 | 7.42e-03 | 3.48e-02 | 2.56e-02 | 15 |
| hsa0513311 | Breast | DCIS | Pertussis | 15/846 | 76/8465 | 7.42e-03 | 3.48e-02 | 2.56e-02 | 15 |
| hsa051657 | Cervix | CC | Human papillomavirus infection | 74/1267 | 331/8465 | 1.70e-04 | 1.02e-03 | 6.03e-04 | 74 |
| hsa051337 | Cervix | CC | Pertussis | 21/1267 | 76/8465 | 3.08e-03 | 1.19e-02 | 7.03e-03 | 21 |
| hsa046686 | Cervix | CC | TNF signaling pathway | 28/1267 | 114/8465 | 4.60e-03 | 1.62e-02 | 9.59e-03 | 28 |
| hsa046254 | Cervix | CC | C-type lectin receptor signaling pathway | 25/1267 | 104/8465 | 9.52e-03 | 2.94e-02 | 1.74e-02 | 25 |
| hsa049172 | Cervix | CC | Prolactin signaling pathway | 18/1267 | 70/8465 | 1.29e-02 | 3.87e-02 | 2.29e-02 | 18 |
| hsa0516512 | Cervix | CC | Human papillomavirus infection | 74/1267 | 331/8465 | 1.70e-04 | 1.02e-03 | 6.03e-04 | 74 |
| hsa0513312 | Cervix | CC | Pertussis | 21/1267 | 76/8465 | 3.08e-03 | 1.19e-02 | 7.03e-03 | 21 |
| hsa0466813 | Cervix | CC | TNF signaling pathway | 28/1267 | 114/8465 | 4.60e-03 | 1.62e-02 | 9.59e-03 | 28 |
| hsa0462511 | Cervix | CC | C-type lectin receptor signaling pathway | 25/1267 | 104/8465 | 9.52e-03 | 2.94e-02 | 1.74e-02 | 25 |
| hsa0491711 | Cervix | CC | Prolactin signaling pathway | 18/1267 | 70/8465 | 1.29e-02 | 3.87e-02 | 2.29e-02 | 18 |
| hsa046687 | Endometrium | EEC | TNF signaling pathway | 27/1237 | 114/8465 | 6.47e-03 | 3.22e-02 | 2.40e-02 | 27 |
| hsa0466814 | Endometrium | EEC | TNF signaling pathway | 27/1237 | 114/8465 | 6.47e-03 | 3.22e-02 | 2.40e-02 | 27 |
| hsa0466810 | Esophagus | ESCC | TNF signaling pathway | 89/4205 | 114/8465 | 3.36e-10 | 4.01e-09 | 2.06e-09 | 89 |
| hsa0516510 | Esophagus | ESCC | Human papillomavirus infection | 215/4205 | 331/8465 | 7.86e-09 | 7.12e-08 | 3.65e-08 | 215 |
| hsa046259 | Esophagus | ESCC | C-type lectin receptor signaling pathway | 73/4205 | 104/8465 | 1.57e-05 | 7.98e-05 | 4.09e-05 | 73 |
| hsa051339 | Esophagus | ESCC | Pertussis | 48/4205 | 76/8465 | 1.21e-02 | 2.77e-02 | 1.42e-02 | 48 |
| hsa0466817 | Esophagus | ESCC | TNF signaling pathway | 89/4205 | 114/8465 | 3.36e-10 | 4.01e-09 | 2.06e-09 | 89 |
| hsa0516515 | Esophagus | ESCC | Human papillomavirus infection | 215/4205 | 331/8465 | 7.86e-09 | 7.12e-08 | 3.65e-08 | 215 |
| Page: 1 2 3 4 |
Top |
Cell-cell communication analysis |
| Identification of potential cell-cell interactions between two cell types and their ligand-receptor pairs for different disease states |
| Ligand | Receptor | LRpair | Pathway | Tissue | Disease Stage |
| Page: 1 |
Top |
Single-cell gene regulatory network inference analysis |
| Find out the significant the regulons (TFs) and the target genes of each regulon across cell types for different disease states |
| TF | Cell Type | Tissue | Disease Stage | Target Gene | RSS | Regulon Activity |
| IRF1 | IMENT | Colorectum | ADJ | AHDC1,AC246817.1,APOL2, etc. | 2.96e-01 |  |
| IRF1 | MDSC | Lung | Healthy | GBP5,CXCL10,RNF114, etc. | 8.74e-01 |  |
| ∗The dot plots of a searched regulon are shown for all cell subpopulations in each disease state of each tissue based on the regulon specific score inferred using pySCENIC and by calculating the average expression. |
| Page: 1 |
Top |
Somatic mutation of malignant transformation related genes |
| Annotation of somatic variants for genes involved in malignant transformation |
| Hugo Symbol | Variant Class | Variant Classification | dbSNP RS | HGVSc | HGVSp | HGVSp Short | SWISSPROT | BIOTYPE | SIFT | PolyPhen | Tumor Sample Barcode | Tissue | Histology | Sex | Age | Stage | Therapy Types | Drugs | Outcome |
| IRF1 | SNV | Missense_Mutation | c.158N>A | p.Cys53Tyr | p.C53Y | P10914 | protein_coding | deleterious(0) | probably_damaging(0.998) | TCGA-A8-A097-01 | Breast | breast invasive carcinoma | Female | >=65 | I/II | Hormone Therapy | tamoxiphen | SD | |
| IRF1 | SNV | Missense_Mutation | c.454N>T | p.Leu152Phe | p.L152F | P10914 | protein_coding | tolerated(0.1) | probably_damaging(0.994) | TCGA-BH-A1FN-01 | Breast | breast invasive carcinoma | Female | <65 | I/II | Unknown | Unknown | PD | |
| IRF1 | SNV | Missense_Mutation | c.778N>C | p.Glu260Gln | p.E260Q | P10914 | protein_coding | deleterious(0.03) | probably_damaging(0.986) | TCGA-C5-A1BQ-01 | Cervix | cervical & endocervical cancer | Female | >=65 | III/IV | Chemotherapy | cisplatin | CR | |
| IRF1 | SNV | Missense_Mutation | rs777589347 | c.13C>T | p.Arg5Trp | p.R5W | P10914 | protein_coding | deleterious(0) | probably_damaging(1) | TCGA-DS-A1OB-01 | Cervix | cervical & endocervical cancer | Female | <65 | I/II | Chemotherapy | carboplatin | PD |
| IRF1 | SNV | Missense_Mutation | c.39N>C | p.Glu13Asp | p.E13D | P10914 | protein_coding | deleterious(0) | probably_damaging(0.983) | TCGA-FU-A3HY-01 | Cervix | cervical & endocervical cancer | Female | <65 | I/II | Chemotherapy | cisplatin | CR | |
| IRF1 | SNV | Missense_Mutation | novel | c.78N>C | p.Trp26Cys | p.W26C | P10914 | protein_coding | deleterious(0) | probably_damaging(1) | TCGA-HM-A4S6-01 | Cervix | cervical & endocervical cancer | Female | <65 | III/IV | Chemotherapy | cisplatin | CR |
| IRF1 | SNV | Missense_Mutation | c.96N>C | p.Met32Ile | p.M32I | P10914 | protein_coding | deleterious(0.04) | probably_damaging(0.925) | TCGA-IR-A3LH-01 | Cervix | cervical & endocervical cancer | Female | <65 | I/II | Chemotherapy | cisplatin | CR | |
| IRF1 | SNV | Missense_Mutation | novel | c.173N>T | p.Trp58Leu | p.W58L | P10914 | protein_coding | deleterious(0) | probably_damaging(1) | TCGA-UC-A7PG-06 | Cervix | cervical & endocervical cancer | Female | <65 | III/IV | Chemotherapy | cisplatin | PD |
| IRF1 | SNV | Missense_Mutation | c.757N>C | p.Gly253Arg | p.G253R | P10914 | protein_coding | deleterious(0) | probably_damaging(0.999) | TCGA-AA-3831-01 | Colorectum | colon adenocarcinoma | Male | >=65 | I/II | Unknown | Unknown | SD | |
| IRF1 | SNV | Missense_Mutation | c.793C>T | p.Pro265Ser | p.P265S | P10914 | protein_coding | tolerated(0.75) | benign(0.073) | TCGA-CK-4951-01 | Colorectum | colon adenocarcinoma | Female | >=65 | I/II | Unknown | Unknown | PD |
| Page: 1 2 3 4 |
Top |
Related drugs of malignant transformation related genes |
| Identification of chemicals and drugs interact with genes involved in malignant transfromation |
| (DGIdb 4.0) |
| Entrez ID | Symbol | Category | Interaction Types | Drug Claim Name | Drug Name | PMIDs |
| 3659 | IRF1 | CLINICALLY ACTIONABLE, TUMOR SUPPRESSOR | CYTOKINES | 17947510 |
| Page: 1 |

Copyright 2023-Present -The University of Texas Health Science Center at Houston |