
|
|||||
|
 | |
| |
| |
| |
| |
| |
|
Gene: GRHL2 |
Gene summary for GRHL2 |
| Gene information | Species | Human | Gene symbol | GRHL2 | Gene ID | 79977 |
| Gene name | grainyhead like transcription factor 2 | |
| Gene Alias | BOM | |
| Cytomap | 8q22.3 | |
| Gene Type | protein-coding | GO ID | GO:0000003 | UniProtAcc | B4DL28 |
Top |
Malignant transformation analysis |
| Identification of the aberrant gene expression in precancerous and cancerous lesions by comparing the gene expression of stem-like cells in diseased tissues with normal stem cells |
| Entrez ID | Symbol | Replicates | Species | Organ | Tissue | Adj P-value | Log2FC | Malignancy |
| 79977 | GRHL2 | CA_HPV_3 | Human | Cervix | CC | 1.76e-03 | 1.18e-01 | 0.0414 |
| 79977 | GRHL2 | CCI_1 | Human | Cervix | CC | 1.72e-09 | 9.01e-01 | 0.528 |
| 79977 | GRHL2 | CCI_2 | Human | Cervix | CC | 1.36e-21 | 1.99e+00 | 0.5249 |
| 79977 | GRHL2 | CCI_3 | Human | Cervix | CC | 5.37e-18 | 1.27e+00 | 0.516 |
| 79977 | GRHL2 | HTA11_3410_2000001011 | Human | Colorectum | AD | 6.60e-15 | -4.93e-01 | 0.0155 |
| 79977 | GRHL2 | HTA11_347_2000001011 | Human | Colorectum | AD | 3.63e-04 | 4.47e-01 | -0.1954 |
| 79977 | GRHL2 | HTA11_3361_2000001011 | Human | Colorectum | AD | 1.35e-05 | -5.45e-01 | -0.1207 |
| 79977 | GRHL2 | HTA11_696_2000001011 | Human | Colorectum | AD | 3.37e-03 | -2.17e-01 | -0.1464 |
| 79977 | GRHL2 | HTA11_866_3004761011 | Human | Colorectum | AD | 1.67e-02 | -3.64e-01 | 0.096 |
| 79977 | GRHL2 | HTA11_8622_2000001021 | Human | Colorectum | SER | 4.81e-02 | -5.19e-01 | 0.0528 |
| 79977 | GRHL2 | HTA11_7696_3000711011 | Human | Colorectum | AD | 6.33e-08 | -3.51e-01 | 0.0674 |
| 79977 | GRHL2 | HTA11_99999974143_84620 | Human | Colorectum | MSS | 1.64e-20 | -5.89e-01 | 0.3005 |
| 79977 | GRHL2 | F007 | Human | Colorectum | FAP | 4.18e-05 | -2.27e-01 | 0.1176 |
| 79977 | GRHL2 | A001-C-207 | Human | Colorectum | FAP | 1.15e-06 | -1.90e-01 | 0.1278 |
| 79977 | GRHL2 | A015-C-203 | Human | Colorectum | FAP | 4.56e-39 | -5.13e-01 | -0.1294 |
| 79977 | GRHL2 | A015-C-204 | Human | Colorectum | FAP | 2.16e-10 | -2.73e-01 | -0.0228 |
| 79977 | GRHL2 | A014-C-040 | Human | Colorectum | FAP | 4.25e-10 | -4.95e-01 | -0.1184 |
| 79977 | GRHL2 | A002-C-201 | Human | Colorectum | FAP | 1.91e-25 | -4.01e-01 | 0.0324 |
| 79977 | GRHL2 | A001-C-119 | Human | Colorectum | FAP | 1.15e-14 | -5.12e-01 | -0.1557 |
| 79977 | GRHL2 | A001-C-108 | Human | Colorectum | FAP | 2.84e-21 | -3.71e-01 | -0.0272 |
| Page: 1 2 3 4 5 6 7 8 9 |
| Tissue | Expression Dynamics | Abbreviation |
| Cervix | 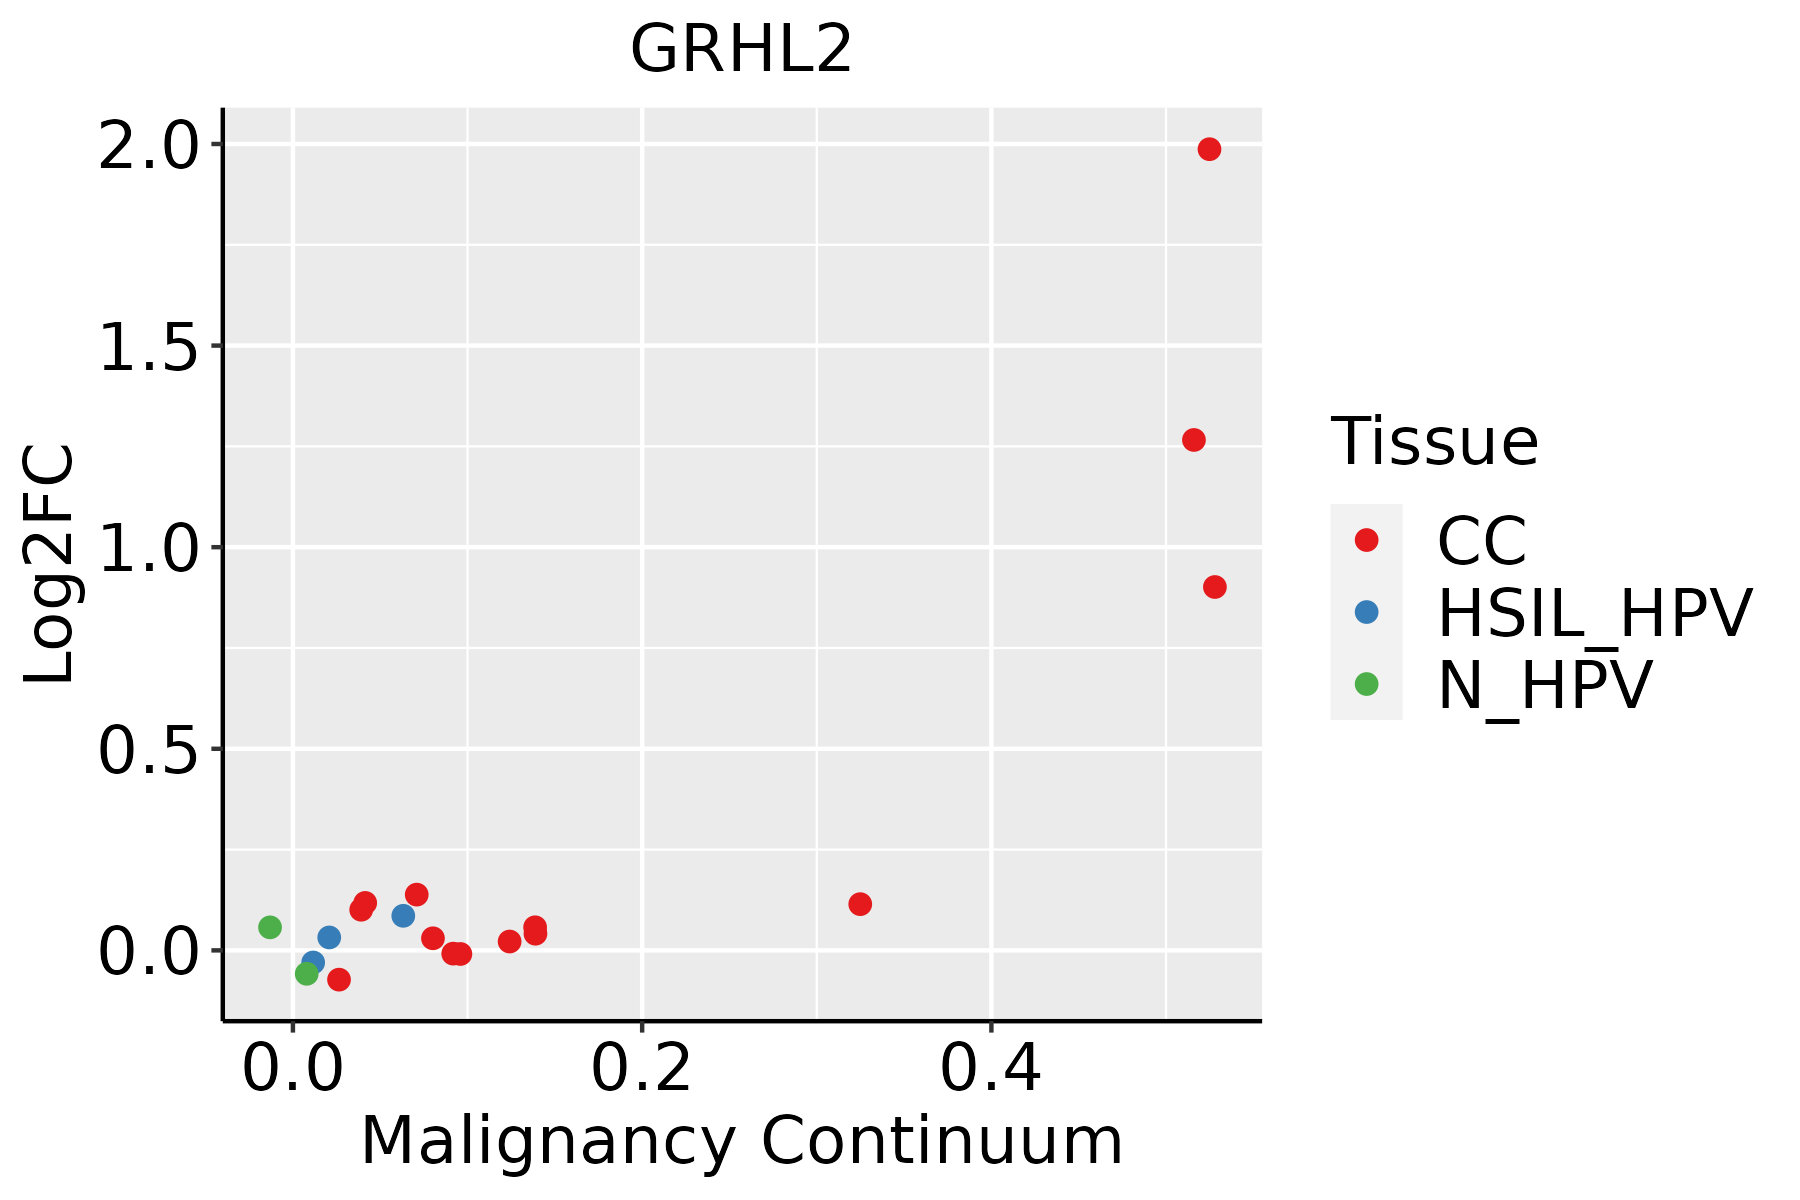 | CC: Cervix cancer |
| HSIL_HPV: HPV-infected high-grade squamous intraepithelial lesions | ||
| N_HPV: HPV-infected normal cervix | ||
| Colorectum (GSE201348) |  | FAP: Familial adenomatous polyposis |
| CRC: Colorectal cancer | ||
| Colorectum (HTA11) |  | AD: Adenomas |
| SER: Sessile serrated lesions | ||
| MSI-H: Microsatellite-high colorectal cancer | ||
| MSS: Microsatellite stable colorectal cancer | ||
| Endometrium | 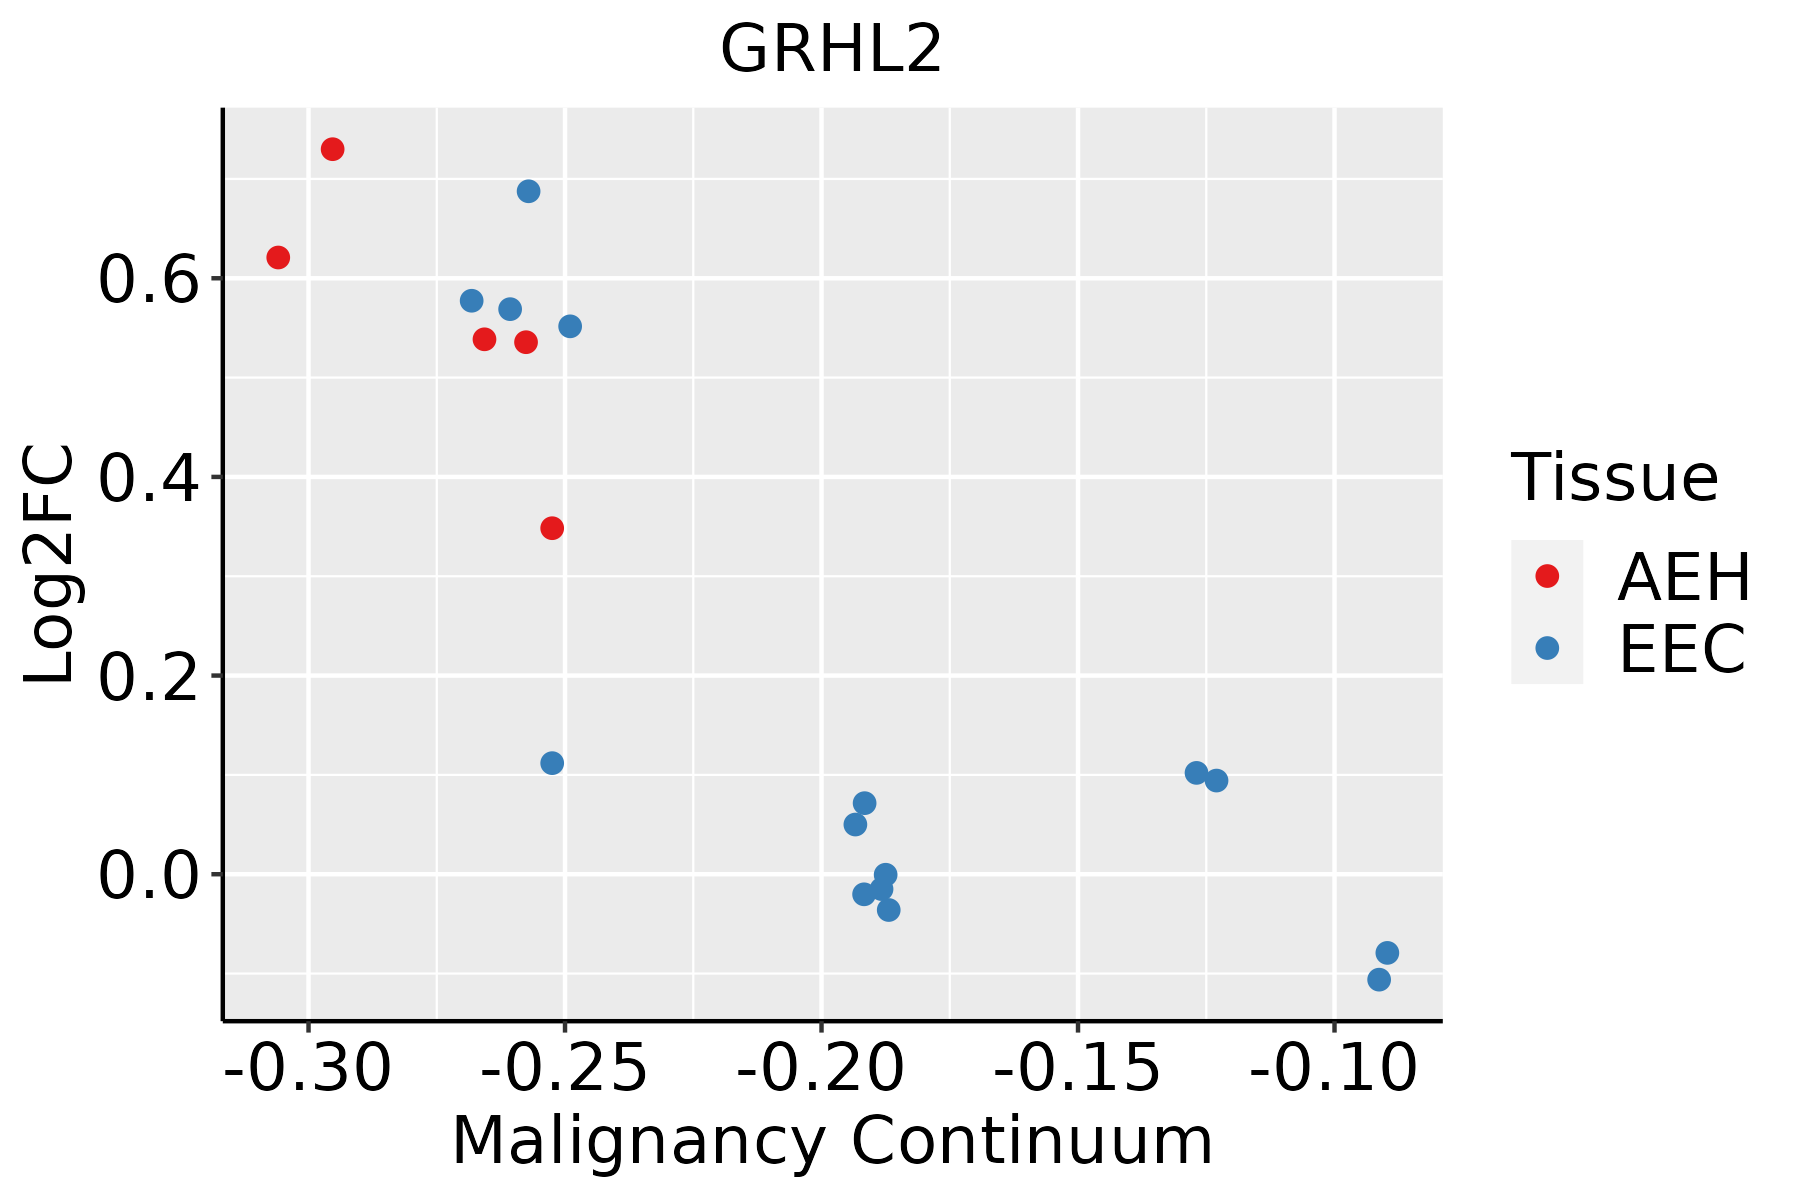 | AEH: Atypical endometrial hyperplasia |
| EEC: Endometrioid Cancer | ||
| Esophagus | 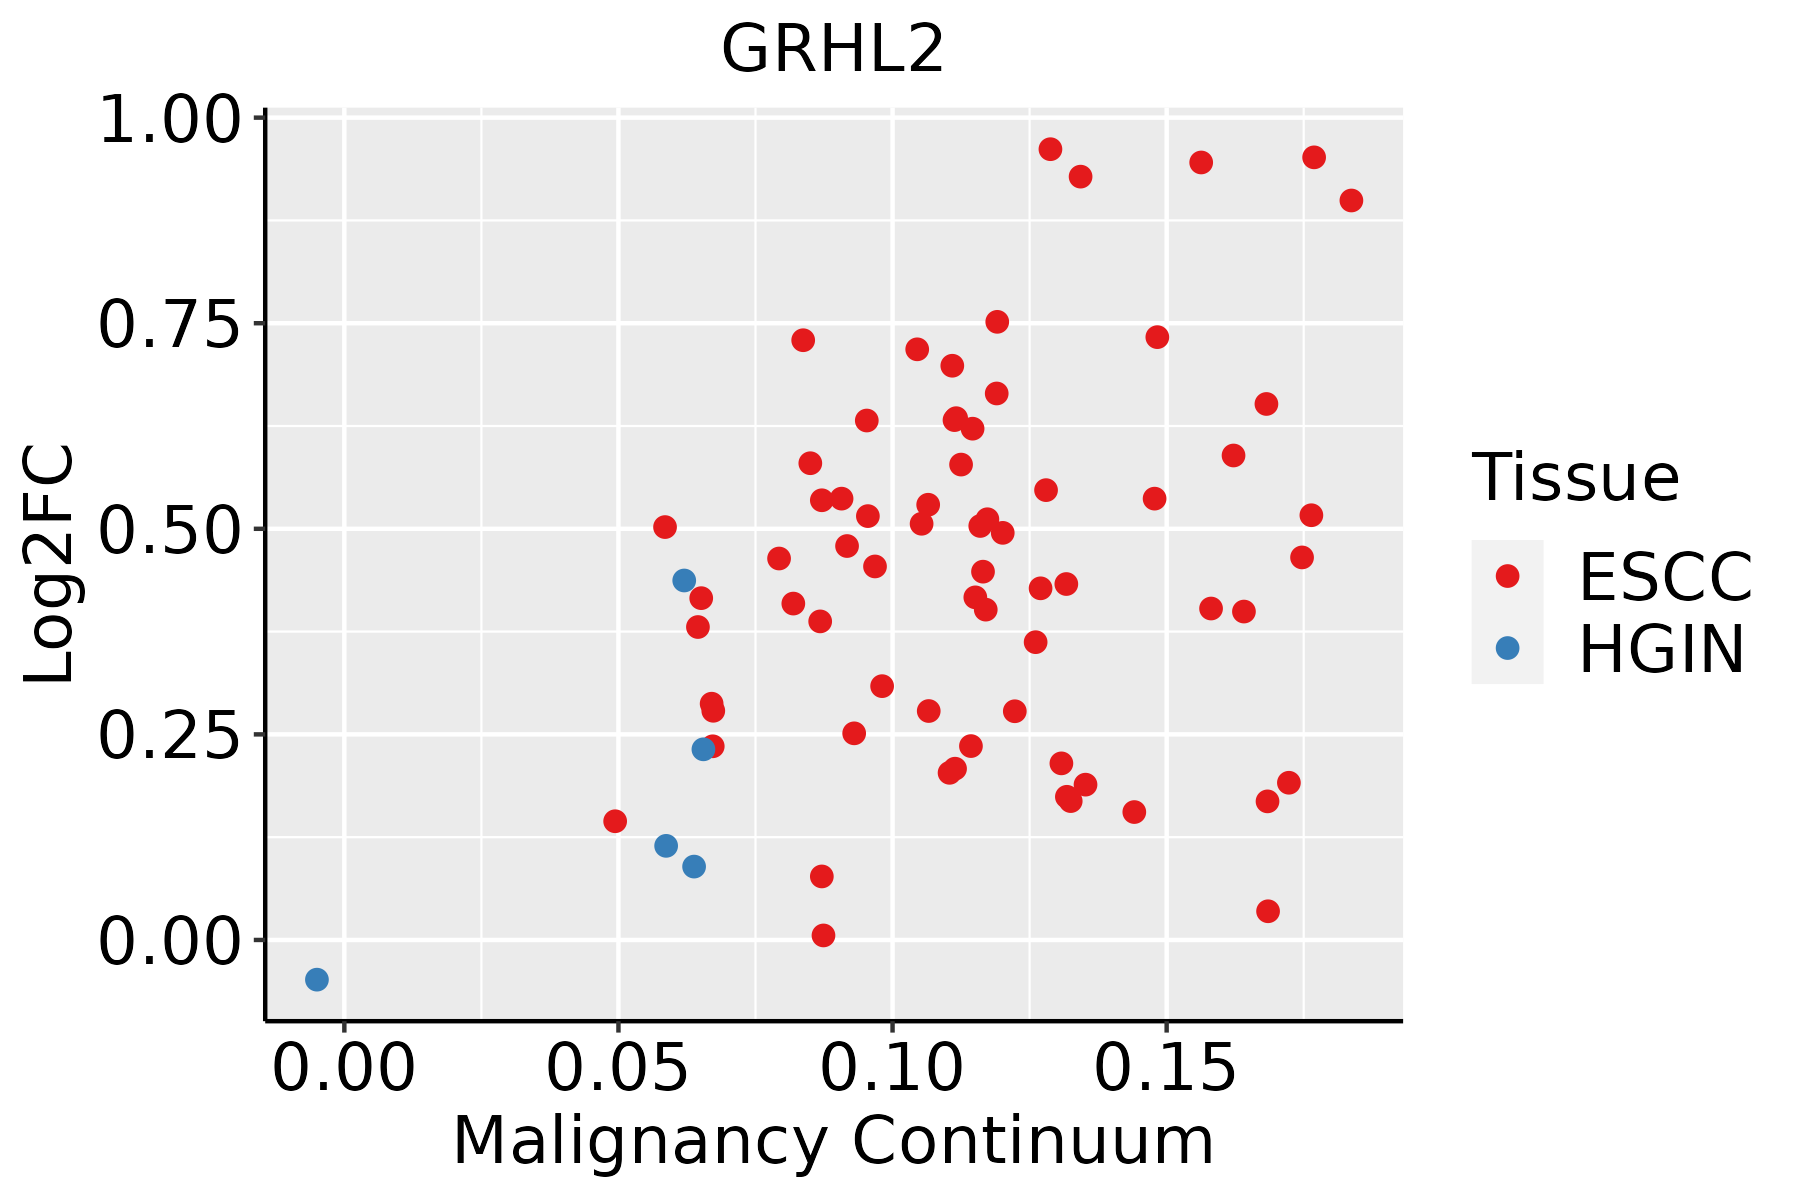 | ESCC: Esophageal squamous cell carcinoma |
| HGIN: High-grade intraepithelial neoplasias | ||
| LGIN: Low-grade intraepithelial neoplasias | ||
| Lung | 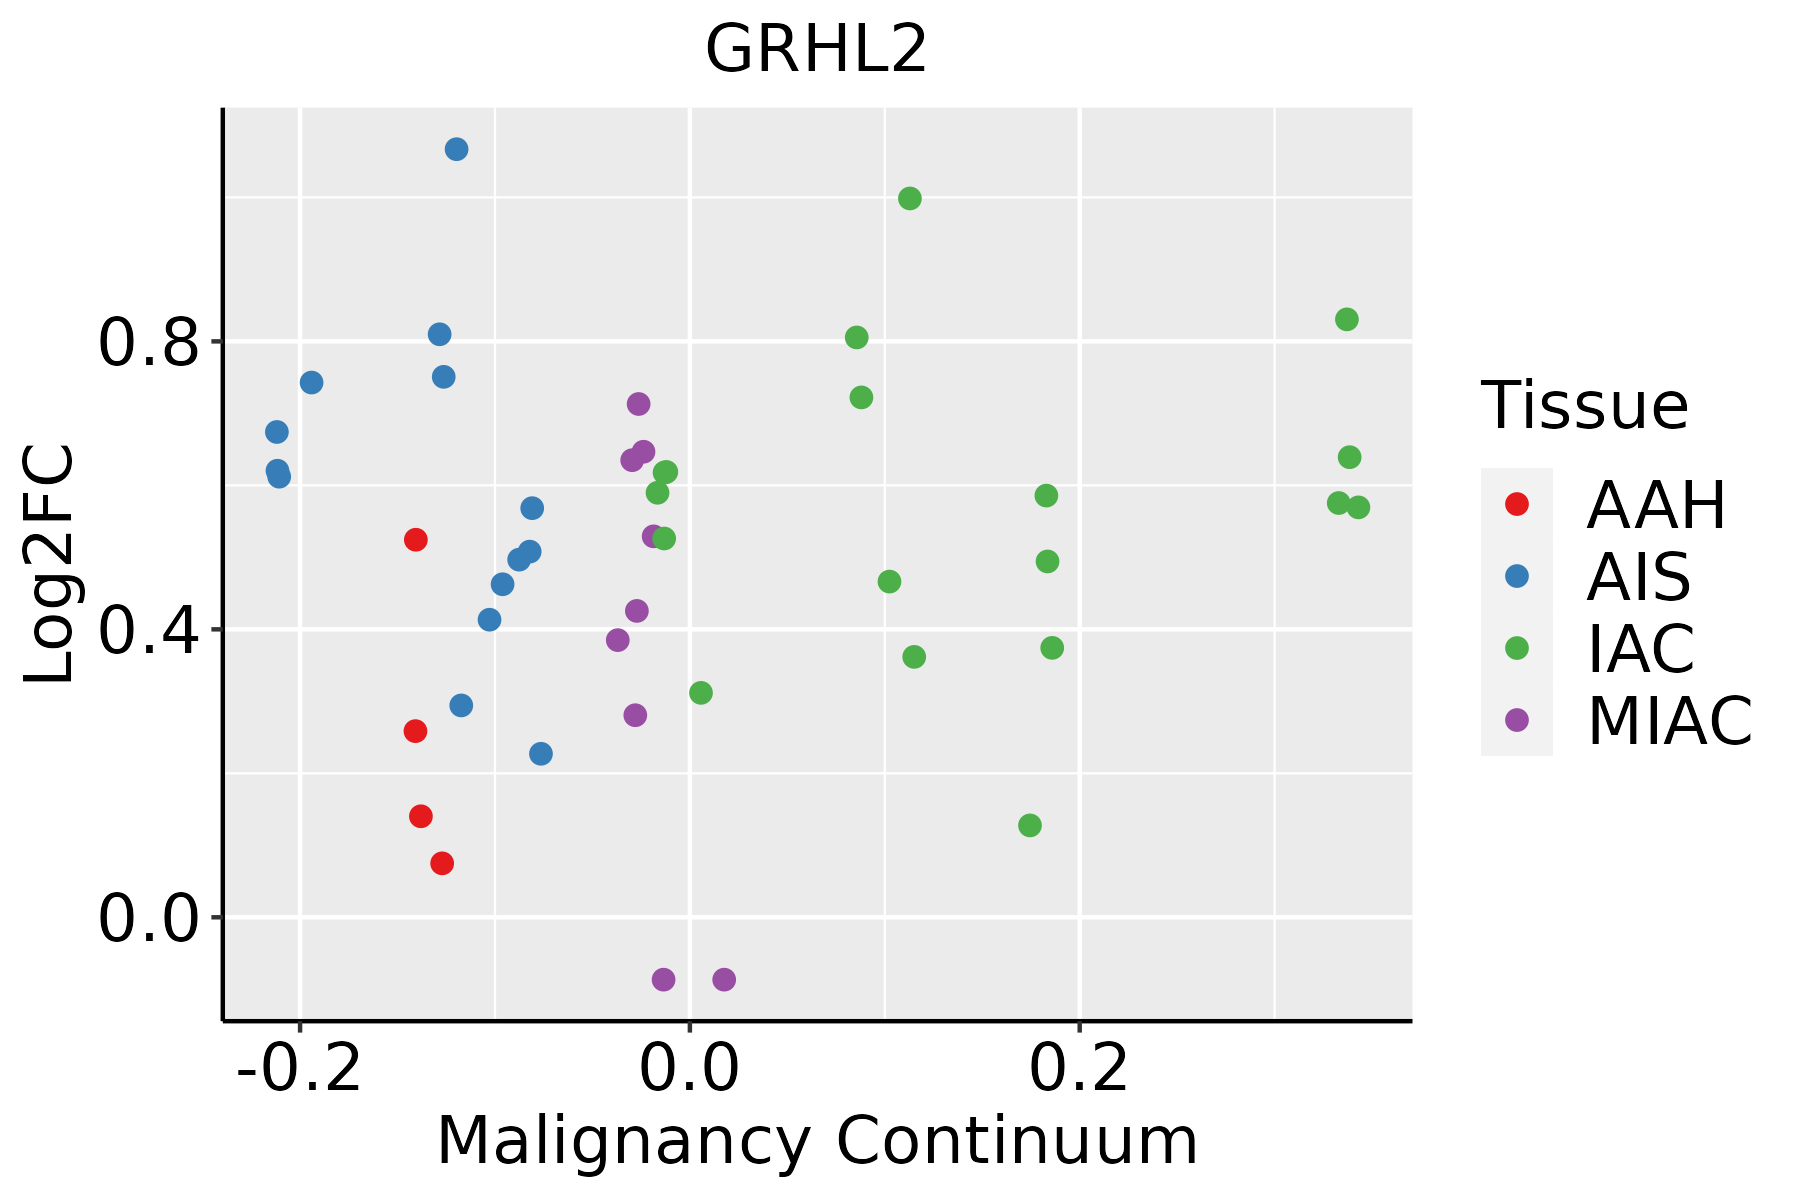 | AAH: Atypical adenomatous hyperplasia |
| AIS: Adenocarcinoma in situ | ||
| IAC: Invasive lung adenocarcinoma | ||
| MIA: Minimally invasive adenocarcinoma | ||
| Oral Cavity | 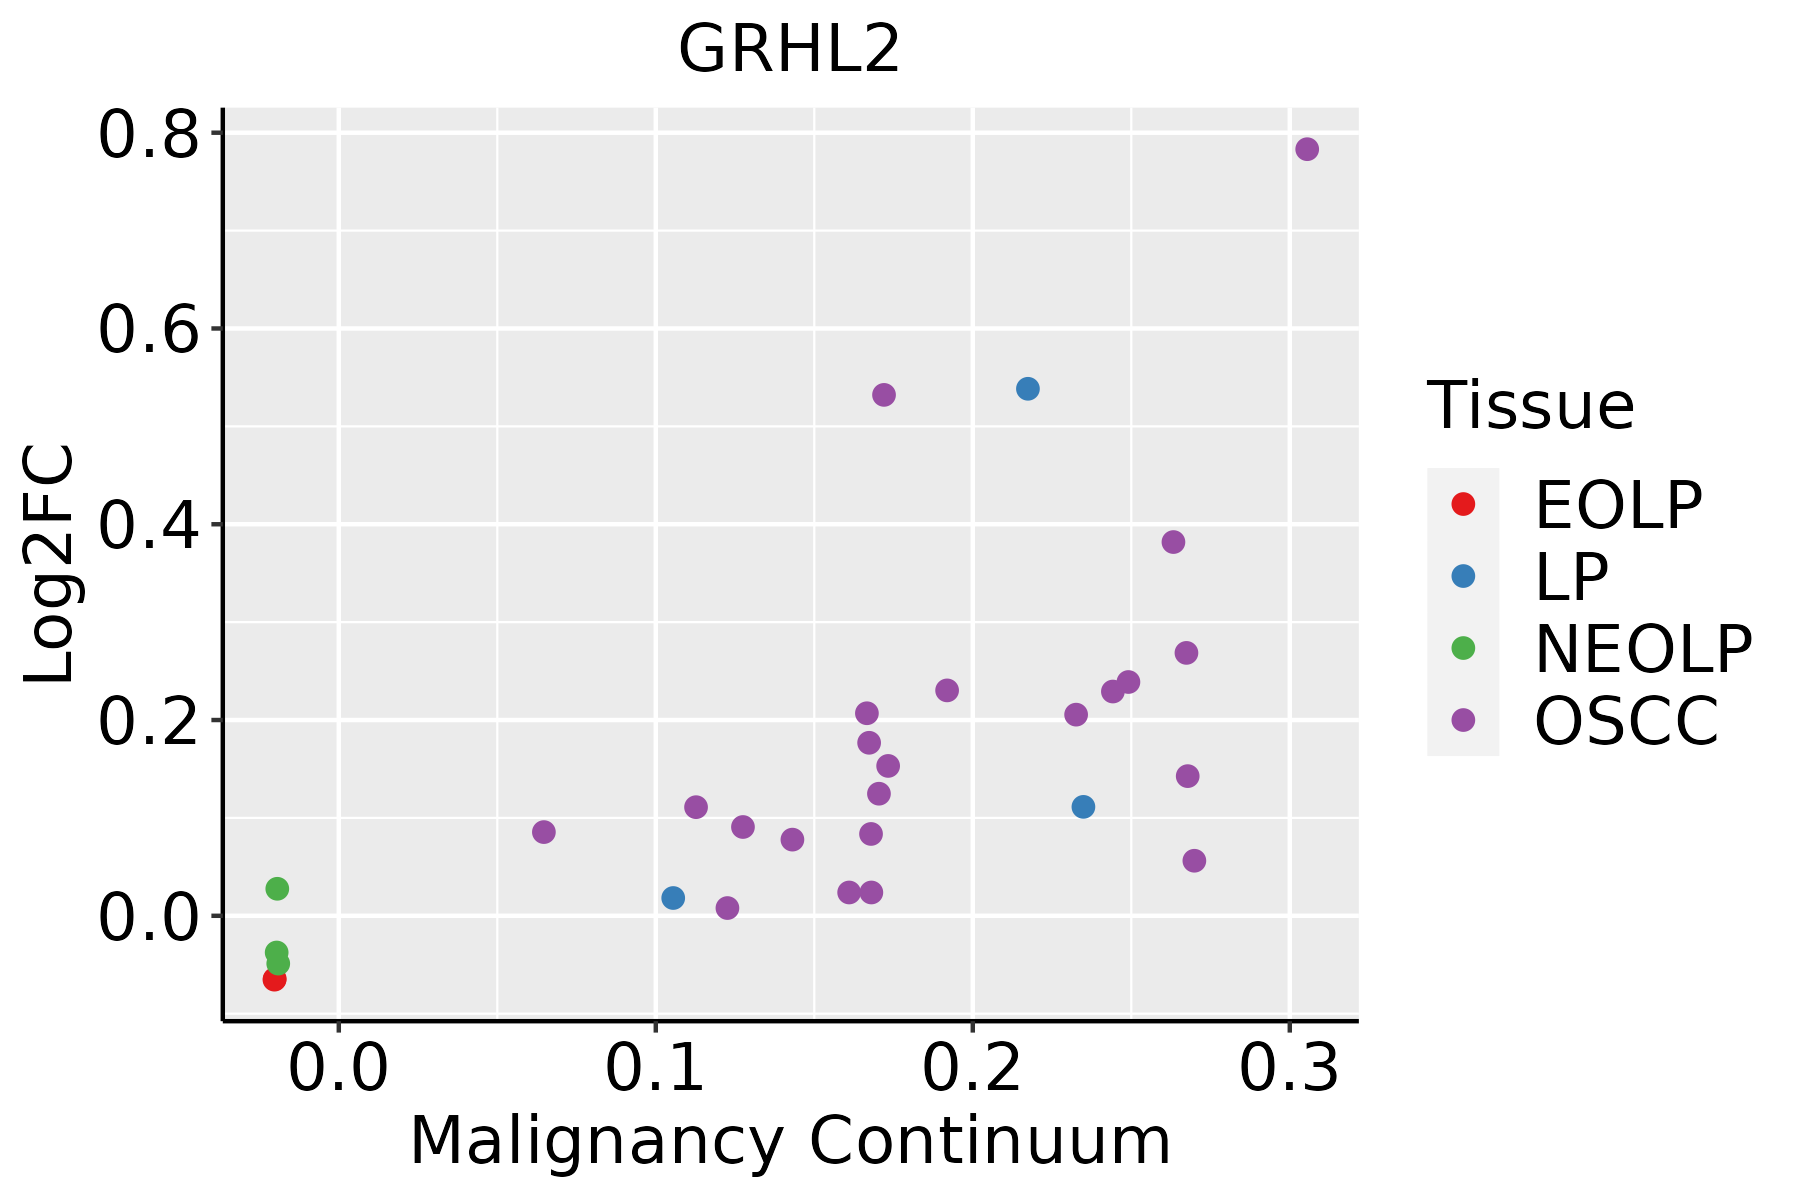 | EOLP: Erosive Oral lichen planus |
| LP: leukoplakia | ||
| NEOLP: Non-erosive oral lichen planus | ||
| OSCC: Oral squamous cell carcinoma | ||
| Prostate | 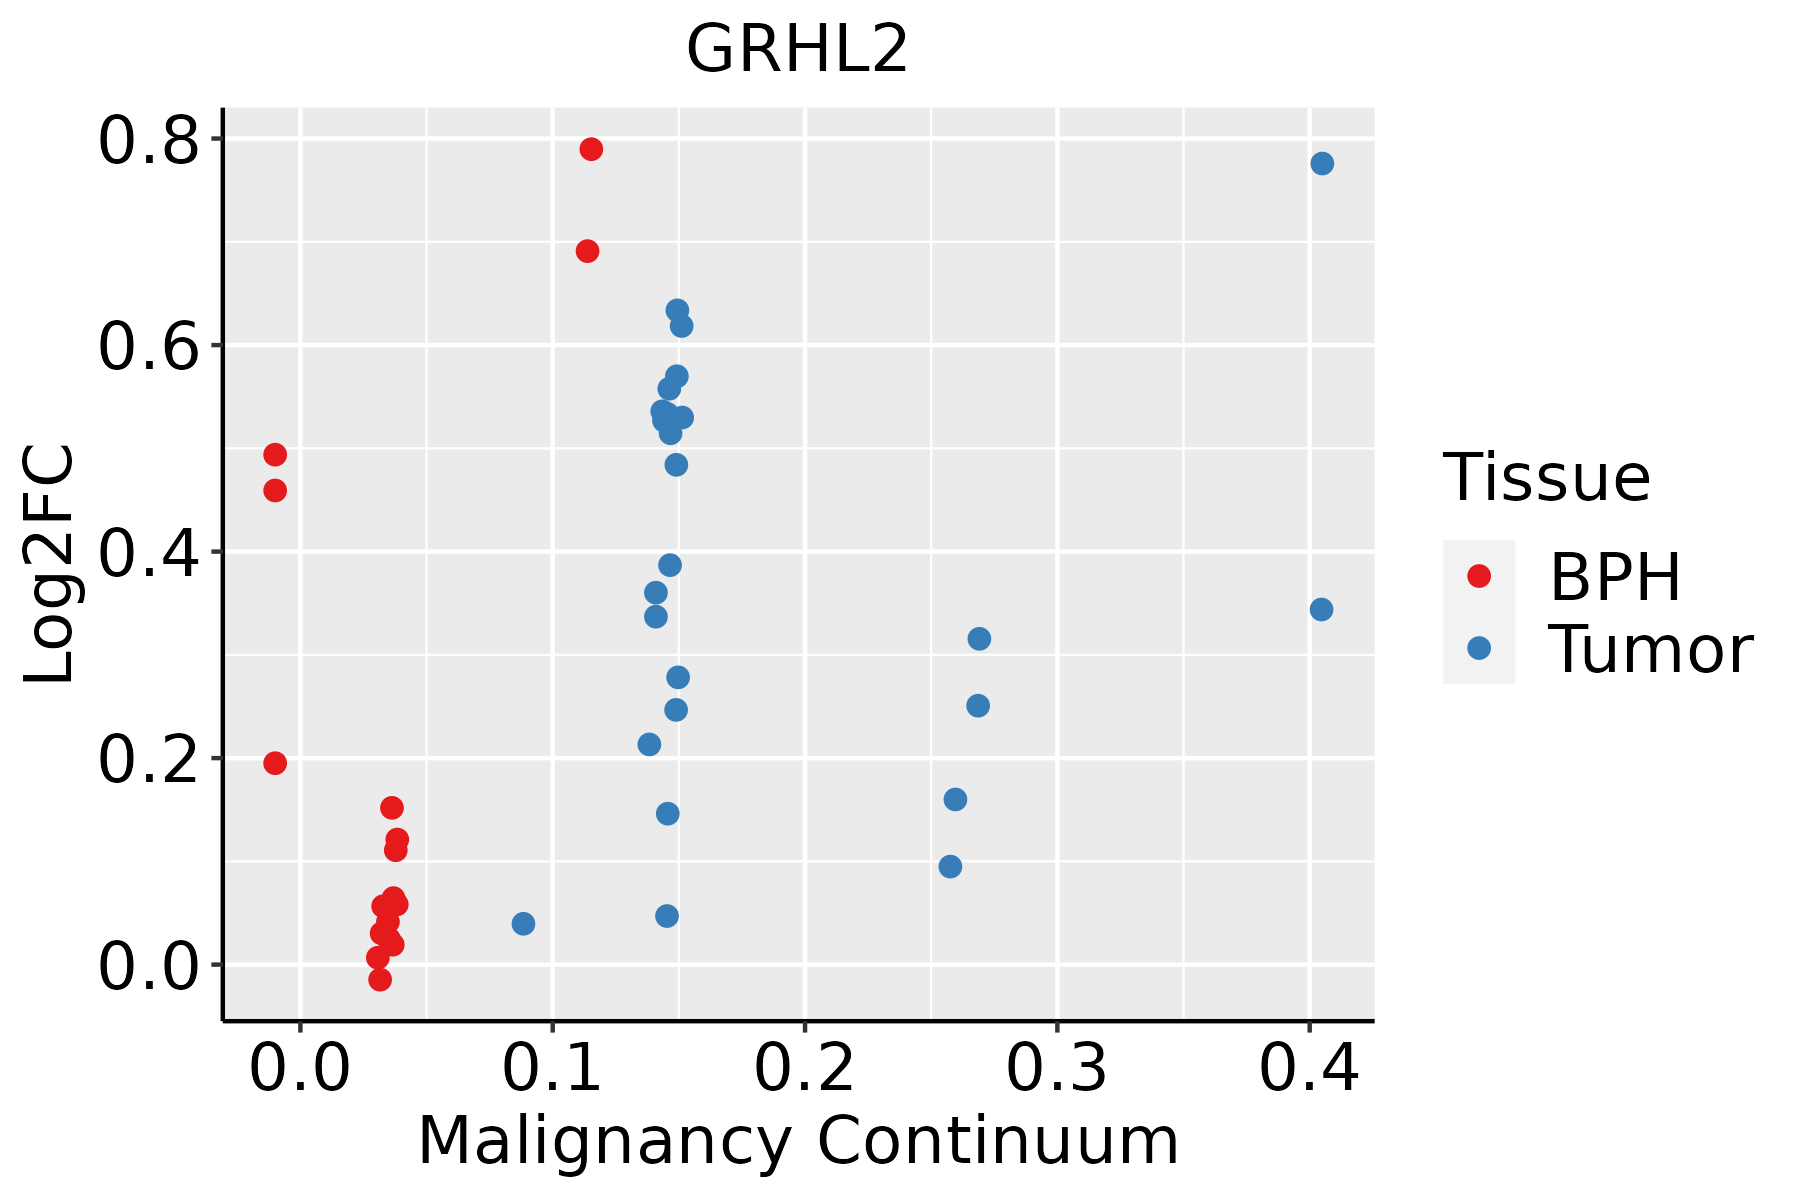 | BPH: Benign Prostatic Hyperplasia |
| ∗log2FC in expression of this searched gene in stem-like cells from each diseased tissue sample relative to stem-like cells in normal samples in each tissue plotted against the malignancy continuum. Samples are colored based on if they are from different disease stage. |
Top |
Malignant transformation related pathway analysis |
| Find out the enriched GO biological processes and KEGG pathways involved in transition from healthy to precancer to cancer |
| Tissue | Disease Stage | Enriched GO biological Processes |
| Colorectum | AD |  |
| Colorectum | SER |  |
| Colorectum | MSS |  |
| Colorectum | MSI-H |  |
| Colorectum | FAP |  |
| ∗Top 15 enriched GO BP terms are showed in the bar plot of each disease state in each tissue. Each row represents a significant GO biological process which is colored according to the -log10(p.adjust). |
| Page: 1 2 3 4 5 6 7 8 9 |
| GO ID | Tissue | Disease Stage | Description | Gene Ratio | Bg Ratio | pvalue | p.adjust | Count |
| GO:00018926 | Lung | IAC | embryonic placenta development | 22/2061 | 82/18723 | 5.36e-05 | 1.21e-03 | 22 |
| GO:00308562 | Lung | IAC | regulation of epithelial cell differentiation | 34/2061 | 154/18723 | 5.40e-05 | 1.21e-03 | 34 |
| GO:0045616 | Lung | IAC | regulation of keratinocyte differentiation | 13/2061 | 37/18723 | 9.33e-05 | 1.87e-03 | 13 |
| GO:01201926 | Lung | IAC | tight junction assembly | 20/2061 | 74/18723 | 1.03e-04 | 2.02e-03 | 20 |
| GO:01201936 | Lung | IAC | tight junction organization | 21/2061 | 80/18723 | 1.11e-04 | 2.14e-03 | 21 |
| GO:00435882 | Lung | IAC | skin development | 49/2061 | 263/18723 | 1.56e-04 | 2.82e-03 | 49 |
| GO:00017634 | Lung | IAC | morphogenesis of a branching structure | 39/2061 | 196/18723 | 1.75e-04 | 3.10e-03 | 39 |
| GO:00018416 | Lung | IAC | neural tube formation | 24/2061 | 102/18723 | 2.35e-04 | 4.04e-03 | 24 |
| GO:00070438 | Lung | IAC | cell-cell junction assembly | 31/2061 | 146/18723 | 2.38e-04 | 4.06e-03 | 31 |
| GO:0045604 | Lung | IAC | regulation of epidermal cell differentiation | 16/2061 | 58/18723 | 3.85e-04 | 5.87e-03 | 16 |
| GO:00708305 | Lung | IAC | bicellular tight junction assembly | 18/2061 | 70/18723 | 4.40e-04 | 6.51e-03 | 18 |
| GO:00140205 | Lung | IAC | primary neural tube formation | 22/2061 | 94/18723 | 4.55e-04 | 6.70e-03 | 22 |
| GO:0045682 | Lung | IAC | regulation of epidermis development | 17/2061 | 65/18723 | 5.07e-04 | 7.33e-03 | 17 |
| GO:00018434 | Lung | IAC | neural tube closure | 20/2061 | 88/18723 | 1.20e-03 | 1.38e-02 | 20 |
| GO:00606695 | Lung | IAC | embryonic placenta morphogenesis | 9/2061 | 26/18723 | 1.27e-03 | 1.45e-02 | 9 |
| GO:00099135 | Lung | IAC | epidermal cell differentiation | 37/2061 | 202/18723 | 1.29e-03 | 1.45e-02 | 37 |
| GO:00018385 | Lung | IAC | embryonic epithelial tube formation | 25/2061 | 121/18723 | 1.38e-03 | 1.53e-02 | 25 |
| GO:00606064 | Lung | IAC | tube closure | 20/2061 | 89/18723 | 1.39e-03 | 1.53e-02 | 20 |
| GO:00611382 | Lung | IAC | morphogenesis of a branching epithelium | 34/2061 | 182/18723 | 1.41e-03 | 1.54e-02 | 34 |
| GO:00351485 | Lung | IAC | tube formation | 29/2061 | 148/18723 | 1.44e-03 | 1.55e-02 | 29 |
| Page: 1 2 3 4 5 6 7 8 9 10 11 12 13 14 15 16 17 18 19 20 21 22 23 24 25 26 27 28 29 30 31 32 33 34 35 36 |
| Pathway ID | Tissue | Disease Stage | Description | Gene Ratio | Bg Ratio | pvalue | p.adjust | qvalue | Count |
| Page: 1 |
Top |
Cell-cell communication analysis |
| Identification of potential cell-cell interactions between two cell types and their ligand-receptor pairs for different disease states |
| Ligand | Receptor | LRpair | Pathway | Tissue | Disease Stage |
| Page: 1 |
Top |
Single-cell gene regulatory network inference analysis |
| Find out the significant the regulons (TFs) and the target genes of each regulon across cell types for different disease states |
| TF | Cell Type | Tissue | Disease Stage | Target Gene | RSS | Regulon Activity |
| GRHL2 | TH1 | Colorectum | FAP | PIGR,DSP,KLF5, etc. | 9.69e-02 |  |
| GRHL2 | INCAF | Colorectum | AD | NXPE1,LINC02086,ATP10B, etc. | 3.36e-01 |  |
| GRHL2 | STM | Endometrium | ADJ | NFIA,NCALD,PKHD1L1, etc. | 6.45e-01 |  |
| GRHL2 | STM | Endometrium | AEH | NFIA,NCALD,PKHD1L1, etc. | 5.03e-01 |  |
| GRHL2 | CILIA | Endometrium | EEC | NFIA,NCALD,PKHD1L1, etc. | 1.22e-01 |  |
| ∗The dot plots of a searched regulon are shown for all cell subpopulations in each disease state of each tissue based on the regulon specific score inferred using pySCENIC and by calculating the average expression. |
| Page: 1 |
Top |
Somatic mutation of malignant transformation related genes |
| Annotation of somatic variants for genes involved in malignant transformation |
| Hugo Symbol | Variant Class | Variant Classification | dbSNP RS | HGVSc | HGVSp | HGVSp Short | SWISSPROT | BIOTYPE | SIFT | PolyPhen | Tumor Sample Barcode | Tissue | Histology | Sex | Age | Stage | Therapy Types | Drugs | Outcome |
| GRHL2 | SNV | Missense_Mutation | c.1627N>T | p.Arg543Trp | p.R543W | Q6ISB3 | protein_coding | deleterious(0) | probably_damaging(0.998) | TCGA-A2-A0CQ-01 | Breast | breast invasive carcinoma | Female | <65 | I/II | Chemotherapy | adriamycin | SD | |
| GRHL2 | SNV | Missense_Mutation | novel | c.1129N>T | p.Asp377Tyr | p.D377Y | Q6ISB3 | protein_coding | deleterious(0) | probably_damaging(1) | TCGA-A2-A25C-01 | Breast | breast invasive carcinoma | Female | <65 | I/II | Chemotherapy | taxotere | SD |
| GRHL2 | SNV | Missense_Mutation | c.610N>T | p.Leu204Phe | p.L204F | Q6ISB3 | protein_coding | tolerated(0.73) | benign(0.321) | TCGA-A8-A06Z-01 | Breast | breast invasive carcinoma | Female | >=65 | I/II | Unknown | Unknown | SD | |
| GRHL2 | SNV | Missense_Mutation | c.1006G>T | p.Asp336Tyr | p.D336Y | Q6ISB3 | protein_coding | deleterious(0) | probably_damaging(1) | TCGA-AR-A5QQ-01 | Breast | breast invasive carcinoma | Female | >=65 | III/IV | Chemotherapy | carboplatin | PD | |
| GRHL2 | SNV | Missense_Mutation | c.1219N>G | p.His407Asp | p.H407D | Q6ISB3 | protein_coding | deleterious(0) | probably_damaging(0.999) | TCGA-D8-A27G-01 | Breast | breast invasive carcinoma | Female | >=65 | I/II | Unknown | Unknown | SD | |
| GRHL2 | SNV | Missense_Mutation | c.667N>A | p.Ala223Thr | p.A223T | Q6ISB3 | protein_coding | tolerated(0.41) | benign(0.01) | TCGA-E2-A15L-01 | Breast | breast invasive carcinoma | Female | >=65 | I/II | Hormone Therapy | arimidex | SD | |
| GRHL2 | insertion | In_Frame_Ins | novel | c.426_427insGCCTGGCCTCGTTTTGTTTTTGTTTTTTACAGTGAGACTGAG | p.Ser142_Phe143insAlaTrpProArgPheValPheValPheTyrSerGluThrGlu | p.S142_F143insAWPRFVFVFYSETE | Q6ISB3 | protein_coding | TCGA-A2-A0D1-01 | Breast | breast invasive carcinoma | Female | >=65 | I/II | Chemotherapy | taxotere | SD | ||
| GRHL2 | insertion | Frame_Shift_Ins | novel | c.458_459insCGTGGTCCTACTTCTAGTGACGCAAGGATCCCATT | p.Gly154ValfsTer17 | p.G154Vfs*17 | Q6ISB3 | protein_coding | TCGA-A2-A0EM-01 | Breast | breast invasive carcinoma | Female | >=65 | I/II | Hormone Therapy | tamoxiphen | SD | ||
| GRHL2 | insertion | Frame_Shift_Ins | novel | c.606_607insGGGTTTCAACACACAGAAACTGCCTTGGCACCAGTGAAGCCCAGAG | p.Tyr203GlyfsTer49 | p.Y203Gfs*49 | Q6ISB3 | protein_coding | TCGA-A7-A0CE-01 | Breast | breast invasive carcinoma | Female | <65 | I/II | Chemotherapy | adriamycin | SD | ||
| GRHL2 | insertion | Frame_Shift_Ins | novel | c.1602_1603insCTCCAGATATTTCTATGCACTCTAAAGTTTGAAAAACATGCTCT | p.Thr535LeufsTer23 | p.T535Lfs*23 | Q6ISB3 | protein_coding | TCGA-A8-A07J-01 | Breast | breast invasive carcinoma | Female | <65 | I/II | Chemotherapy | 5-fluorouracil | CR |
| Page: 1 2 3 4 5 6 7 8 |
Top |
Related drugs of malignant transformation related genes |
| Identification of chemicals and drugs interact with genes involved in malignant transfromation |
| (DGIdb 4.0) |
| Entrez ID | Symbol | Category | Interaction Types | Drug Claim Name | Drug Name | PMIDs |
| Page: 1 |

Copyright 2023-Present -The University of Texas Health Science Center at Houston |