
|
|||||
|
 | |
| |
| |
| |
| |
| |
|
Gene: EXOSC1 |
Gene summary for EXOSC1 |
| Gene information | Species | Human | Gene symbol | EXOSC1 | Gene ID | 51013 |
| Gene name | exosome component 1 | |
| Gene Alias | CGI-108 | |
| Cytomap | 10q24.1 | |
| Gene Type | protein-coding | GO ID | GO:0006139 | UniProtAcc | B1AMU3 |
Top |
Malignant transformation analysis |
| Identification of the aberrant gene expression in precancerous and cancerous lesions by comparing the gene expression of stem-like cells in diseased tissues with normal stem cells |
| Entrez ID | Symbol | Replicates | Species | Organ | Tissue | Adj P-value | Log2FC | Malignancy |
| 51013 | EXOSC1 | LZE4T | Human | Esophagus | ESCC | 1.12e-13 | 2.48e-01 | 0.0811 |
| 51013 | EXOSC1 | LZE5T | Human | Esophagus | ESCC | 1.42e-04 | 2.83e-01 | 0.0514 |
| 51013 | EXOSC1 | LZE20T | Human | Esophagus | ESCC | 6.29e-07 | 1.55e-01 | 0.0662 |
| 51013 | EXOSC1 | LZE24T | Human | Esophagus | ESCC | 1.20e-23 | 7.23e-01 | 0.0596 |
| 51013 | EXOSC1 | LZE21T | Human | Esophagus | ESCC | 3.96e-04 | 2.60e-01 | 0.0655 |
| 51013 | EXOSC1 | LZE6T | Human | Esophagus | ESCC | 7.06e-05 | 1.90e-01 | 0.0845 |
| 51013 | EXOSC1 | P2T-E | Human | Esophagus | ESCC | 2.08e-35 | 5.82e-01 | 0.1177 |
| 51013 | EXOSC1 | P4T-E | Human | Esophagus | ESCC | 4.12e-34 | 9.35e-01 | 0.1323 |
| 51013 | EXOSC1 | P5T-E | Human | Esophagus | ESCC | 2.72e-38 | 7.29e-01 | 0.1327 |
| 51013 | EXOSC1 | P8T-E | Human | Esophagus | ESCC | 2.73e-28 | 4.59e-01 | 0.0889 |
| 51013 | EXOSC1 | P9T-E | Human | Esophagus | ESCC | 1.19e-18 | 3.46e-01 | 0.1131 |
| 51013 | EXOSC1 | P10T-E | Human | Esophagus | ESCC | 1.91e-14 | 1.78e-01 | 0.116 |
| 51013 | EXOSC1 | P11T-E | Human | Esophagus | ESCC | 4.26e-18 | 5.24e-01 | 0.1426 |
| 51013 | EXOSC1 | P12T-E | Human | Esophagus | ESCC | 1.67e-28 | 5.28e-01 | 0.1122 |
| 51013 | EXOSC1 | P15T-E | Human | Esophagus | ESCC | 2.21e-20 | 5.96e-01 | 0.1149 |
| 51013 | EXOSC1 | P16T-E | Human | Esophagus | ESCC | 2.51e-26 | 3.72e-01 | 0.1153 |
| 51013 | EXOSC1 | P17T-E | Human | Esophagus | ESCC | 1.68e-08 | 4.42e-01 | 0.1278 |
| 51013 | EXOSC1 | P19T-E | Human | Esophagus | ESCC | 1.74e-08 | 4.66e-01 | 0.1662 |
| 51013 | EXOSC1 | P20T-E | Human | Esophagus | ESCC | 2.34e-23 | 5.43e-01 | 0.1124 |
| 51013 | EXOSC1 | P21T-E | Human | Esophagus | ESCC | 5.54e-30 | 5.50e-01 | 0.1617 |
| Page: 1 2 3 4 5 6 |
| Tissue | Expression Dynamics | Abbreviation |
| Esophagus | 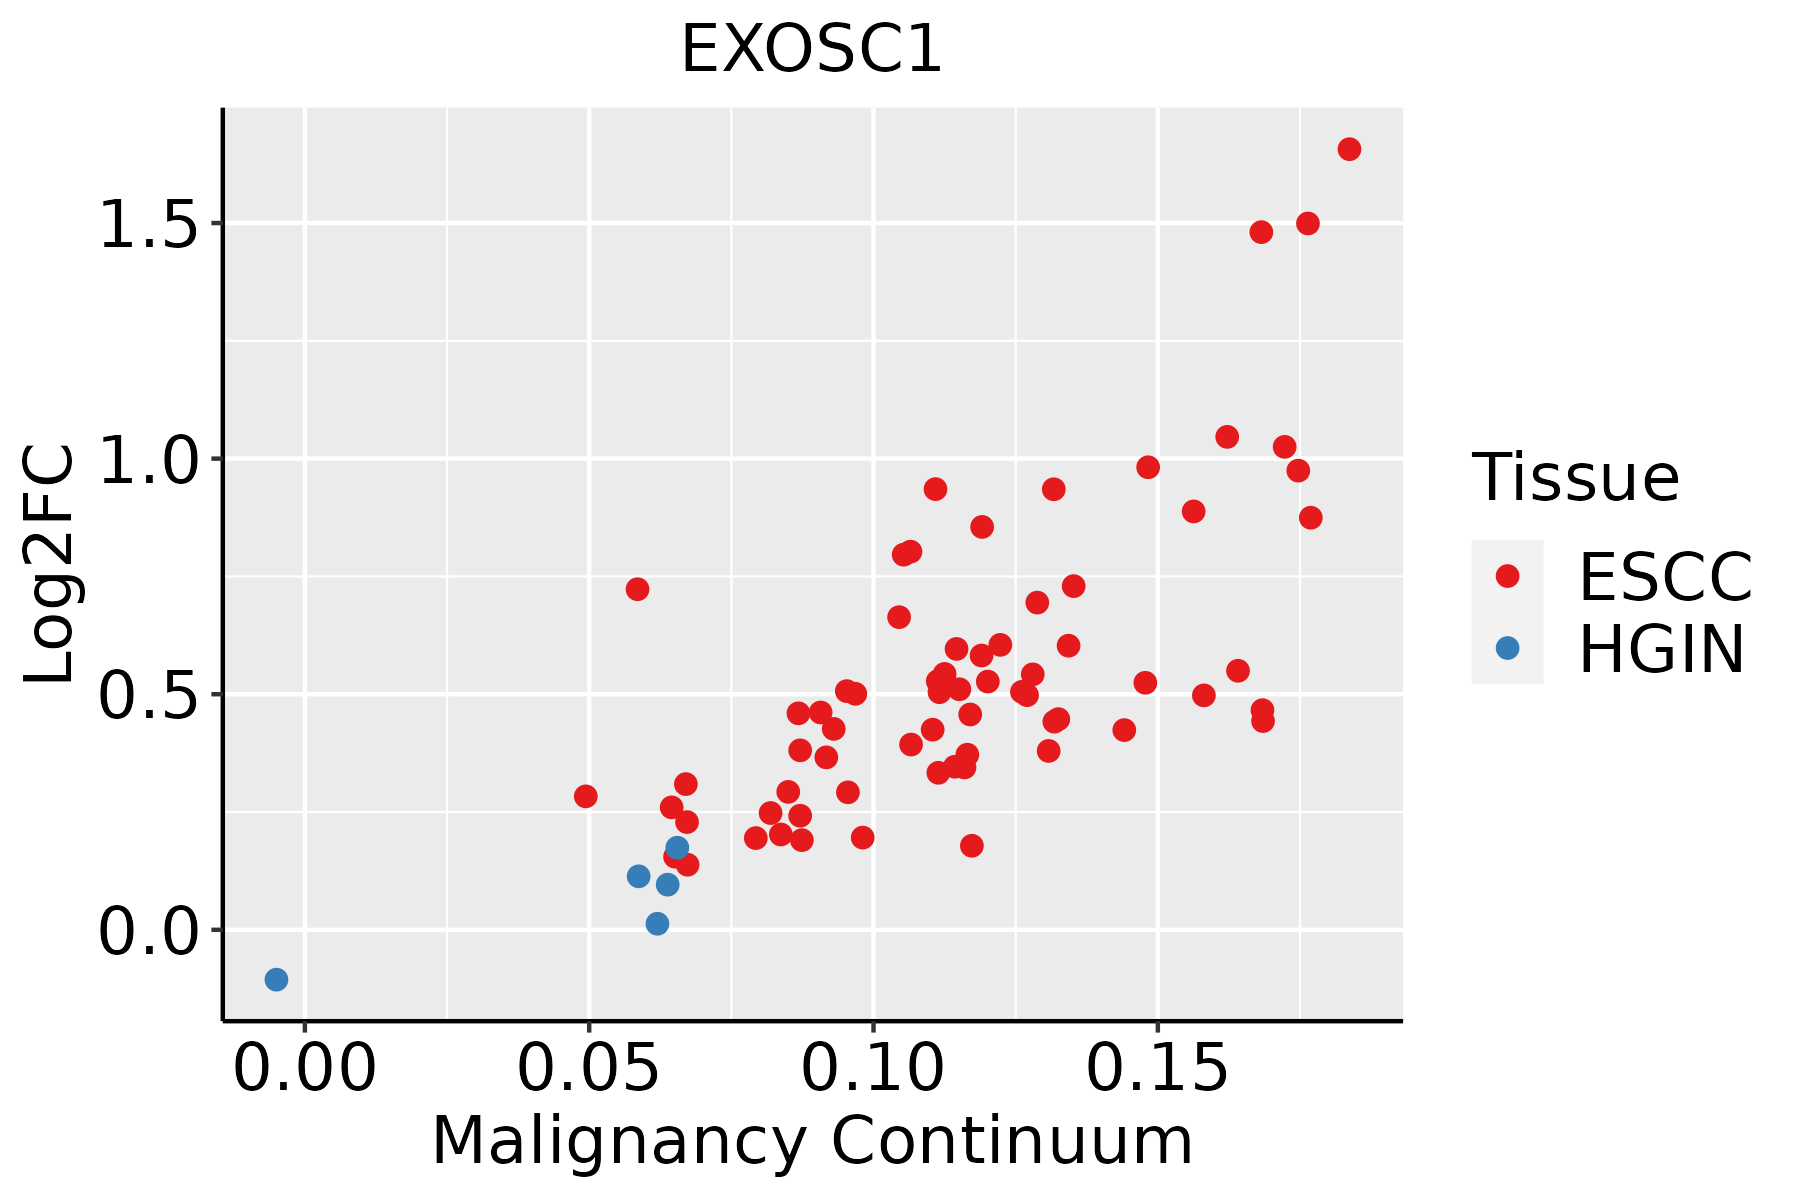 | ESCC: Esophageal squamous cell carcinoma |
| HGIN: High-grade intraepithelial neoplasias | ||
| LGIN: Low-grade intraepithelial neoplasias | ||
| Liver |  | HCC: Hepatocellular carcinoma |
| NAFLD: Non-alcoholic fatty liver disease | ||
| Oral Cavity | 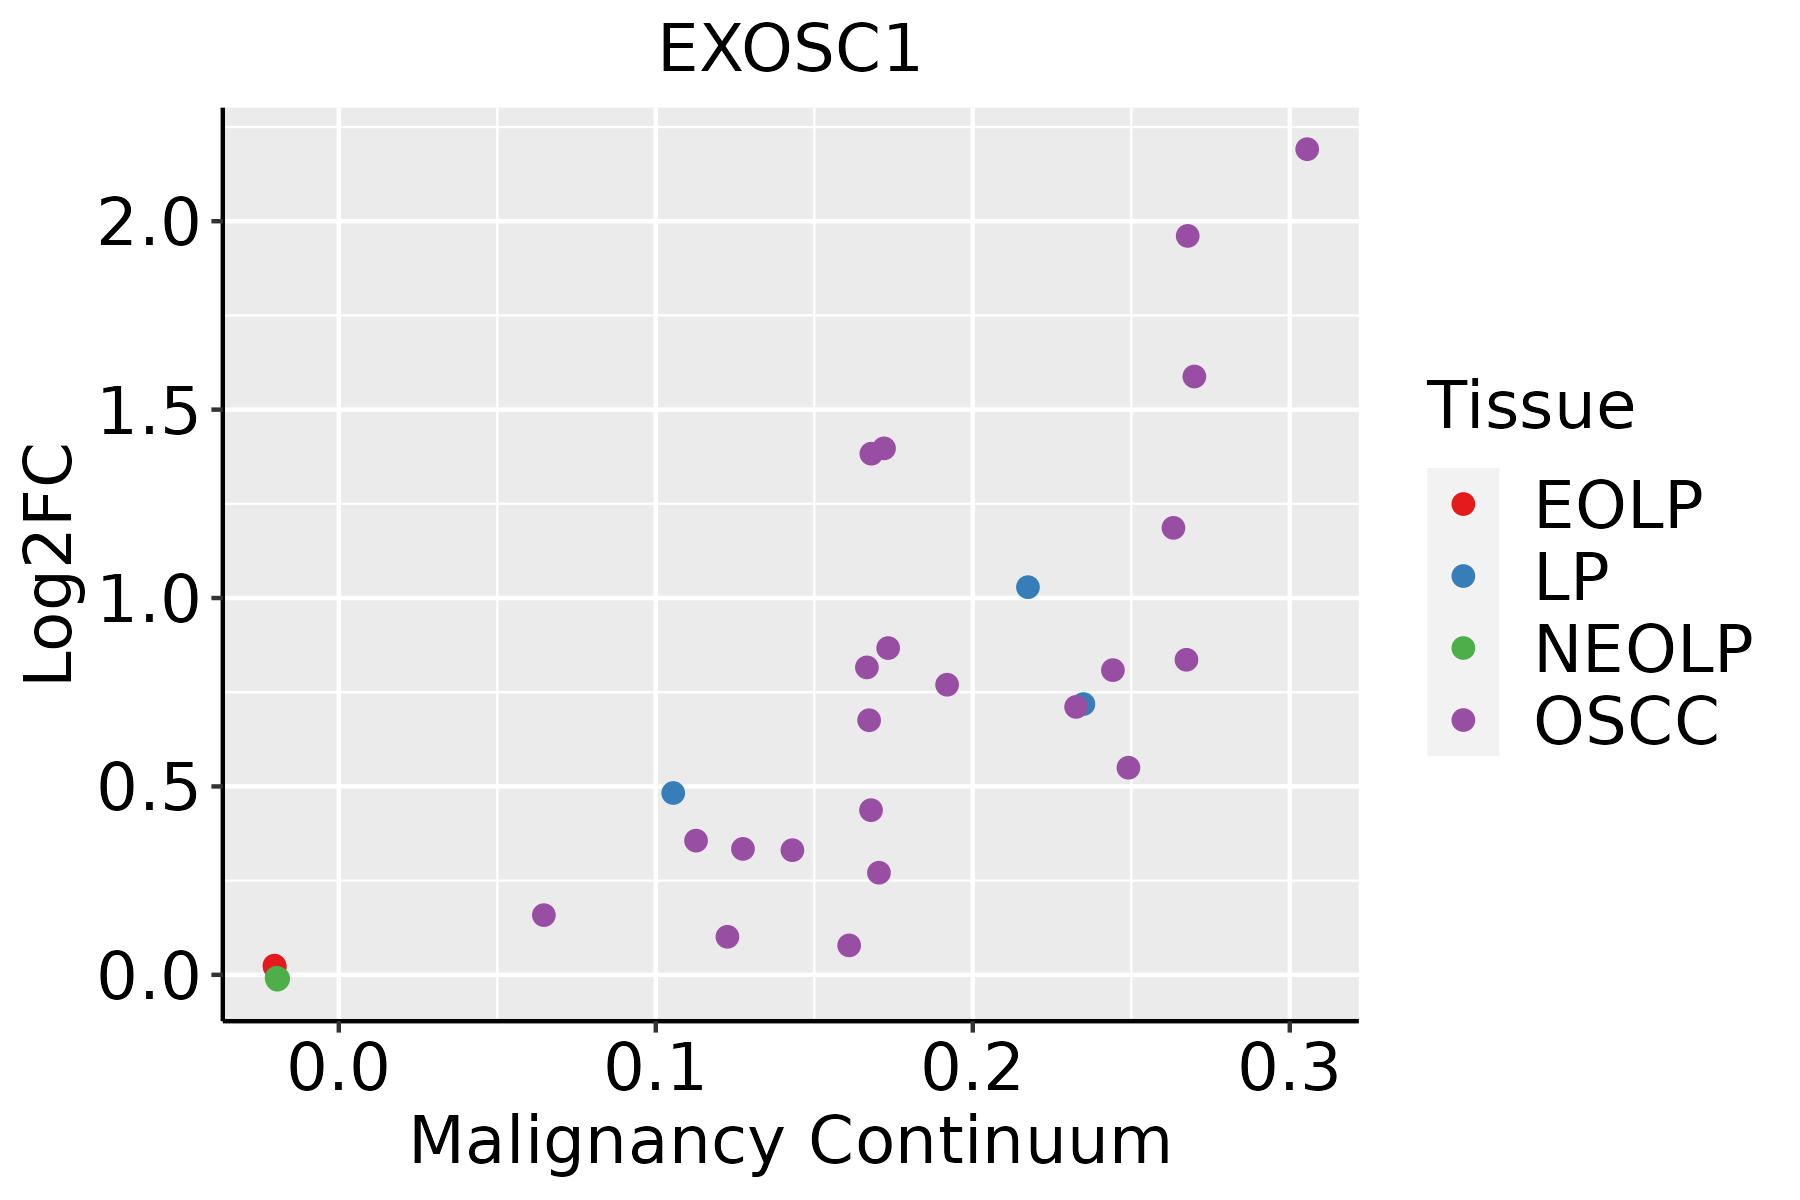 | EOLP: Erosive Oral lichen planus |
| LP: leukoplakia | ||
| NEOLP: Non-erosive oral lichen planus | ||
| OSCC: Oral squamous cell carcinoma | ||
| Skin |  | AK: Actinic keratosis |
| cSCC: Cutaneous squamous cell carcinoma | ||
| SCCIS:squamous cell carcinoma in situ | ||
| Thyroid |  | ATC: Anaplastic thyroid cancer |
| HT: Hashimoto's thyroiditis | ||
| PTC: Papillary thyroid cancer |
| ∗log2FC in expression of this searched gene in stem-like cells from each diseased tissue sample relative to stem-like cells in normal samples in each tissue plotted against the malignancy continuum. Samples are colored based on if they are from different disease stage. |
Top |
Malignant transformation related pathway analysis |
| Find out the enriched GO biological processes and KEGG pathways involved in transition from healthy to precancer to cancer |
| Tissue | Disease Stage | Enriched GO biological Processes |
| Colorectum | AD |  |
| Colorectum | SER |  |
| Colorectum | MSS |  |
| Colorectum | MSI-H |  |
| Colorectum | FAP |  |
| ∗Top 15 enriched GO BP terms are showed in the bar plot of each disease state in each tissue. Each row represents a significant GO biological process which is colored according to the -log10(p.adjust). |
| Page: 1 2 3 4 5 6 7 8 9 |
| GO ID | Tissue | Disease Stage | Description | Gene Ratio | Bg Ratio | pvalue | p.adjust | Count |
| GO:009067121 | Thyroid | ATC | telomerase RNA localization to Cajal body | 16/6293 | 19/18723 | 8.15e-06 | 8.27e-05 | 16 |
| GO:009067221 | Thyroid | ATC | telomerase RNA localization | 16/6293 | 19/18723 | 8.15e-06 | 8.27e-05 | 16 |
| GO:009068521 | Thyroid | ATC | RNA localization to nucleus | 16/6293 | 19/18723 | 8.15e-06 | 8.27e-05 | 16 |
| GO:004002913 | Thyroid | ATC | regulation of gene expression, epigenetic | 57/6293 | 105/18723 | 1.01e-05 | 1.00e-04 | 57 |
| GO:1904356110 | Thyroid | ATC | regulation of telomere maintenance via telomere lengthening | 37/6293 | 61/18723 | 1.35e-05 | 1.29e-04 | 37 |
| GO:009050112 | Thyroid | ATC | RNA phosphodiester bond hydrolysis | 76/6293 | 152/18723 | 2.07e-05 | 1.86e-04 | 76 |
| GO:000046012 | Thyroid | ATC | maturation of 5.8S rRNA | 24/6293 | 35/18723 | 2.49e-05 | 2.16e-04 | 24 |
| GO:009050312 | Thyroid | ATC | RNA phosphodiester bond hydrolysis, exonucleolytic | 27/6293 | 42/18723 | 4.62e-05 | 3.70e-04 | 27 |
| GO:003466111 | Thyroid | ATC | ncRNA catabolic process | 27/6293 | 43/18723 | 8.44e-05 | 6.30e-04 | 27 |
| GO:007104411 | Thyroid | ATC | histone mRNA catabolic process | 10/6293 | 11/18723 | 1.40e-04 | 9.75e-04 | 10 |
| GO:003220016 | Thyroid | ATC | telomere organization | 76/6293 | 159/18723 | 1.40e-04 | 9.75e-04 | 76 |
| GO:000829811 | Thyroid | ATC | intracellular mRNA localization | 11/6293 | 13/18723 | 2.30e-04 | 1.49e-03 | 11 |
| GO:007102711 | Thyroid | ATC | nuclear RNA surveillance | 11/6293 | 13/18723 | 2.30e-04 | 1.49e-03 | 11 |
| GO:007102811 | Thyroid | ATC | nuclear mRNA surveillance | 11/6293 | 13/18723 | 2.30e-04 | 1.49e-03 | 11 |
| GO:000833411 | Thyroid | ATC | histone mRNA metabolic process | 13/6293 | 17/18723 | 3.73e-04 | 2.28e-03 | 13 |
| GO:003112611 | Thyroid | ATC | sno(s)RNA 3'-end processing | 10/6293 | 12/18723 | 5.84e-04 | 3.34e-03 | 10 |
| GO:007102511 | Thyroid | ATC | RNA surveillance | 11/6293 | 15/18723 | 1.94e-03 | 9.41e-03 | 11 |
| GO:001607511 | Thyroid | ATC | rRNA catabolic process | 14/6293 | 21/18723 | 1.99e-03 | 9.54e-03 | 14 |
| GO:00510531 | Thyroid | ATC | negative regulation of DNA metabolic process | 57/6293 | 125/18723 | 3.47e-03 | 1.55e-02 | 57 |
| GO:000046611 | Thyroid | ATC | maturation of 5.8S rRNA from tricistronic rRNA transcript (SSU-rRNA, 5.8S rRNA, LSU-rRNA) | 15/6293 | 24/18723 | 3.52e-03 | 1.56e-02 | 15 |
| Page: 1 2 3 4 5 6 7 8 9 10 11 12 13 14 15 16 17 18 19 20 21 22 23 24 |
| Pathway ID | Tissue | Disease Stage | Description | Gene Ratio | Bg Ratio | pvalue | p.adjust | qvalue | Count |
| hsa0301824 | Esophagus | ESCC | RNA degradation | 62/4205 | 79/8465 | 1.18e-07 | 9.39e-07 | 4.81e-07 | 62 |
| hsa0301834 | Esophagus | ESCC | RNA degradation | 62/4205 | 79/8465 | 1.18e-07 | 9.39e-07 | 4.81e-07 | 62 |
| hsa03018 | Liver | Cirrhotic | RNA degradation | 44/2530 | 79/8465 | 1.43e-06 | 1.65e-05 | 1.02e-05 | 44 |
| hsa030181 | Liver | Cirrhotic | RNA degradation | 44/2530 | 79/8465 | 1.43e-06 | 1.65e-05 | 1.02e-05 | 44 |
| hsa030182 | Liver | HCC | RNA degradation | 58/4020 | 79/8465 | 2.29e-06 | 2.19e-05 | 1.22e-05 | 58 |
| hsa030183 | Liver | HCC | RNA degradation | 58/4020 | 79/8465 | 2.29e-06 | 2.19e-05 | 1.22e-05 | 58 |
| hsa030189 | Oral cavity | OSCC | RNA degradation | 59/3704 | 79/8465 | 2.05e-08 | 1.91e-07 | 9.70e-08 | 59 |
| hsa0301814 | Oral cavity | OSCC | RNA degradation | 59/3704 | 79/8465 | 2.05e-08 | 1.91e-07 | 9.70e-08 | 59 |
| hsa0301823 | Oral cavity | LP | RNA degradation | 39/2418 | 79/8465 | 6.98e-05 | 4.38e-04 | 2.83e-04 | 39 |
| hsa0301833 | Oral cavity | LP | RNA degradation | 39/2418 | 79/8465 | 6.98e-05 | 4.38e-04 | 2.83e-04 | 39 |
| Page: 1 |
Top |
Cell-cell communication analysis |
| Identification of potential cell-cell interactions between two cell types and their ligand-receptor pairs for different disease states |
| Ligand | Receptor | LRpair | Pathway | Tissue | Disease Stage |
| Page: 1 |
Top |
Single-cell gene regulatory network inference analysis |
| Find out the significant the regulons (TFs) and the target genes of each regulon across cell types for different disease states |
| TF | Cell Type | Tissue | Disease Stage | Target Gene | RSS | Regulon Activity |
| ∗The dot plots of a searched regulon are shown for all cell subpopulations in each disease state of each tissue based on the regulon specific score inferred using pySCENIC and by calculating the average expression. |
| Page: 1 |
Top |
Somatic mutation of malignant transformation related genes |
| Annotation of somatic variants for genes involved in malignant transformation |
| Hugo Symbol | Variant Class | Variant Classification | dbSNP RS | HGVSc | HGVSp | HGVSp Short | SWISSPROT | BIOTYPE | SIFT | PolyPhen | Tumor Sample Barcode | Tissue | Histology | Sex | Age | Stage | Therapy Types | Drugs | Outcome |
| EXOSC1 | deletion | Frame_Shift_Del | novel | c.540delA | p.Glu181AsnfsTer5 | p.E181Nfs*5 | Q9Y3B2 | protein_coding | TCGA-EW-A2FV-01 | Breast | breast invasive carcinoma | Female | <65 | III/IV | Chemotherapy | docetaxel | SD | ||
| EXOSC1 | SNV | Missense_Mutation | rs762016854 | c.170N>C | p.Arg57Thr | p.R57T | Q9Y3B2 | protein_coding | tolerated(0.25) | benign(0.278) | TCGA-C5-A1MK-01 | Cervix | cervical & endocervical cancer | Female | >=65 | III/IV | Chemotherapy | carboplatin | PD |
| EXOSC1 | SNV | Missense_Mutation | novel | c.241C>T | p.Arg81Cys | p.R81C | Q9Y3B2 | protein_coding | deleterious(0) | benign(0.015) | TCGA-EA-A3HS-01 | Cervix | cervical & endocervical cancer | Female | <65 | I/II | Unknown | Unknown | SD |
| EXOSC1 | SNV | Missense_Mutation | novel | c.289A>G | p.Asn97Asp | p.N97D | Q9Y3B2 | protein_coding | tolerated(0.36) | benign(0) | TCGA-D5-6930-01 | Colorectum | colon adenocarcinoma | Male | >=65 | I/II | Unknown | Unknown | SD |
| EXOSC1 | SNV | Missense_Mutation | novel | c.350N>G | p.Glu117Gly | p.E117G | Q9Y3B2 | protein_coding | deleterious(0) | probably_damaging(0.999) | TCGA-A5-A0G2-01 | Endometrium | uterine corpus endometrioid carcinoma | Female | <65 | III/IV | Unknown | Unknown | SD |
| EXOSC1 | SNV | Missense_Mutation | novel | c.401C>T | p.Ser134Phe | p.S134F | Q9Y3B2 | protein_coding | deleterious(0.01) | probably_damaging(0.999) | TCGA-AP-A1DK-01 | Endometrium | uterine corpus endometrioid carcinoma | Female | <65 | I/II | Unknown | Unknown | SD |
| EXOSC1 | SNV | Missense_Mutation | novel | c.354N>G | p.Ile118Met | p.I118M | Q9Y3B2 | protein_coding | tolerated(1) | benign(0.018) | TCGA-BK-A6W3-01 | Endometrium | uterine corpus endometrioid carcinoma | Female | <65 | I/II | Unknown | Unknown | SD |
| EXOSC1 | SNV | Missense_Mutation | c.322N>A | p.Val108Ile | p.V108I | Q9Y3B2 | protein_coding | tolerated(0.3) | benign(0.003) | TCGA-55-A490-01 | Lung | lung adenocarcinoma | Male | >=65 | I/II | Chemotherapy | carboplatin | SD | |
| EXOSC1 | deletion | Frame_Shift_Del | novel | c.166delN | p.Val56Ter | p.V56* | Q9Y3B2 | protein_coding | TCGA-MP-A4T2-01 | Lung | lung adenocarcinoma | Male | >=65 | I/II | Unknown | Unknown | PD | ||
| EXOSC1 | SNV | Missense_Mutation | c.546N>G | p.Phe182Leu | p.F182L | Q9Y3B2 | protein_coding | tolerated(0.7) | benign(0) | TCGA-BR-6563-01 | Stomach | stomach adenocarcinoma | Male | <65 | I/II | Chemotherapy | doxorubicin | CR |
| Page: 1 2 |
Top |
Related drugs of malignant transformation related genes |
| Identification of chemicals and drugs interact with genes involved in malignant transfromation |
| (DGIdb 4.0) |
| Entrez ID | Symbol | Category | Interaction Types | Drug Claim Name | Drug Name | PMIDs |
| Page: 1 |

Copyright 2023-Present -The University of Texas Health Science Center at Houston |