
|
|||||
|
 | |
| |
| |
| |
| |
| |
|
Gene: CRK |
Gene summary for CRK |
| Gene information | Species | Human | Gene symbol | CRK | Gene ID | 1398 |
| Gene name | CRK proto-oncogene, adaptor protein | |
| Gene Alias | CRKII | |
| Cytomap | 17p13.3 | |
| Gene Type | protein-coding | GO ID | GO:0000302 | UniProtAcc | A0A0S2Z3K9 |
Top |
Malignant transformation analysis |
| Identification of the aberrant gene expression in precancerous and cancerous lesions by comparing the gene expression of stem-like cells in diseased tissues with normal stem cells |
| Entrez ID | Symbol | Replicates | Species | Organ | Tissue | Adj P-value | Log2FC | Malignancy |
| 1398 | CRK | HTA11_3410_2000001011 | Human | Colorectum | AD | 2.52e-02 | -1.71e-01 | 0.0155 |
| 1398 | CRK | HTA11_347_2000001011 | Human | Colorectum | AD | 5.62e-11 | 5.00e-01 | -0.1954 |
| 1398 | CRK | HTA11_411_2000001011 | Human | Colorectum | SER | 8.31e-05 | 8.78e-01 | -0.2602 |
| 1398 | CRK | HTA11_83_2000001011 | Human | Colorectum | SER | 4.62e-02 | 4.63e-01 | -0.1526 |
| 1398 | CRK | HTA11_1391_2000001011 | Human | Colorectum | AD | 1.13e-05 | 6.12e-01 | -0.059 |
| 1398 | CRK | HTA11_99999971662_82457 | Human | Colorectum | MSS | 2.79e-02 | -1.96e-01 | 0.3859 |
| 1398 | CRK | A002-C-010 | Human | Colorectum | FAP | 2.08e-02 | -2.13e-01 | 0.242 |
| 1398 | CRK | A001-C-207 | Human | Colorectum | FAP | 1.95e-04 | -3.53e-01 | 0.1278 |
| 1398 | CRK | A015-C-203 | Human | Colorectum | FAP | 1.71e-22 | -3.60e-01 | -0.1294 |
| 1398 | CRK | A015-C-204 | Human | Colorectum | FAP | 7.64e-04 | -2.70e-01 | -0.0228 |
| 1398 | CRK | A014-C-040 | Human | Colorectum | FAP | 2.14e-02 | -4.20e-01 | -0.1184 |
| 1398 | CRK | A002-C-201 | Human | Colorectum | FAP | 1.76e-06 | -2.31e-01 | 0.0324 |
| 1398 | CRK | A001-C-119 | Human | Colorectum | FAP | 8.38e-04 | -3.59e-01 | -0.1557 |
| 1398 | CRK | A001-C-108 | Human | Colorectum | FAP | 1.18e-12 | -3.04e-01 | -0.0272 |
| 1398 | CRK | A002-C-205 | Human | Colorectum | FAP | 2.60e-13 | -3.06e-01 | -0.1236 |
| 1398 | CRK | A001-C-104 | Human | Colorectum | FAP | 5.59e-03 | -2.08e-01 | 0.0184 |
| 1398 | CRK | A015-C-005 | Human | Colorectum | FAP | 2.05e-05 | -3.24e-01 | -0.0336 |
| 1398 | CRK | A015-C-006 | Human | Colorectum | FAP | 4.68e-10 | -4.21e-01 | -0.0994 |
| 1398 | CRK | A015-C-106 | Human | Colorectum | FAP | 8.27e-09 | -1.98e-01 | -0.0511 |
| 1398 | CRK | A002-C-114 | Human | Colorectum | FAP | 5.30e-10 | -2.53e-01 | -0.1561 |
| Page: 1 2 3 4 5 6 7 8 |
| Tissue | Expression Dynamics | Abbreviation |
| Colorectum (GSE201348) |  | FAP: Familial adenomatous polyposis |
| CRC: Colorectal cancer | ||
| Colorectum (HTA11) | 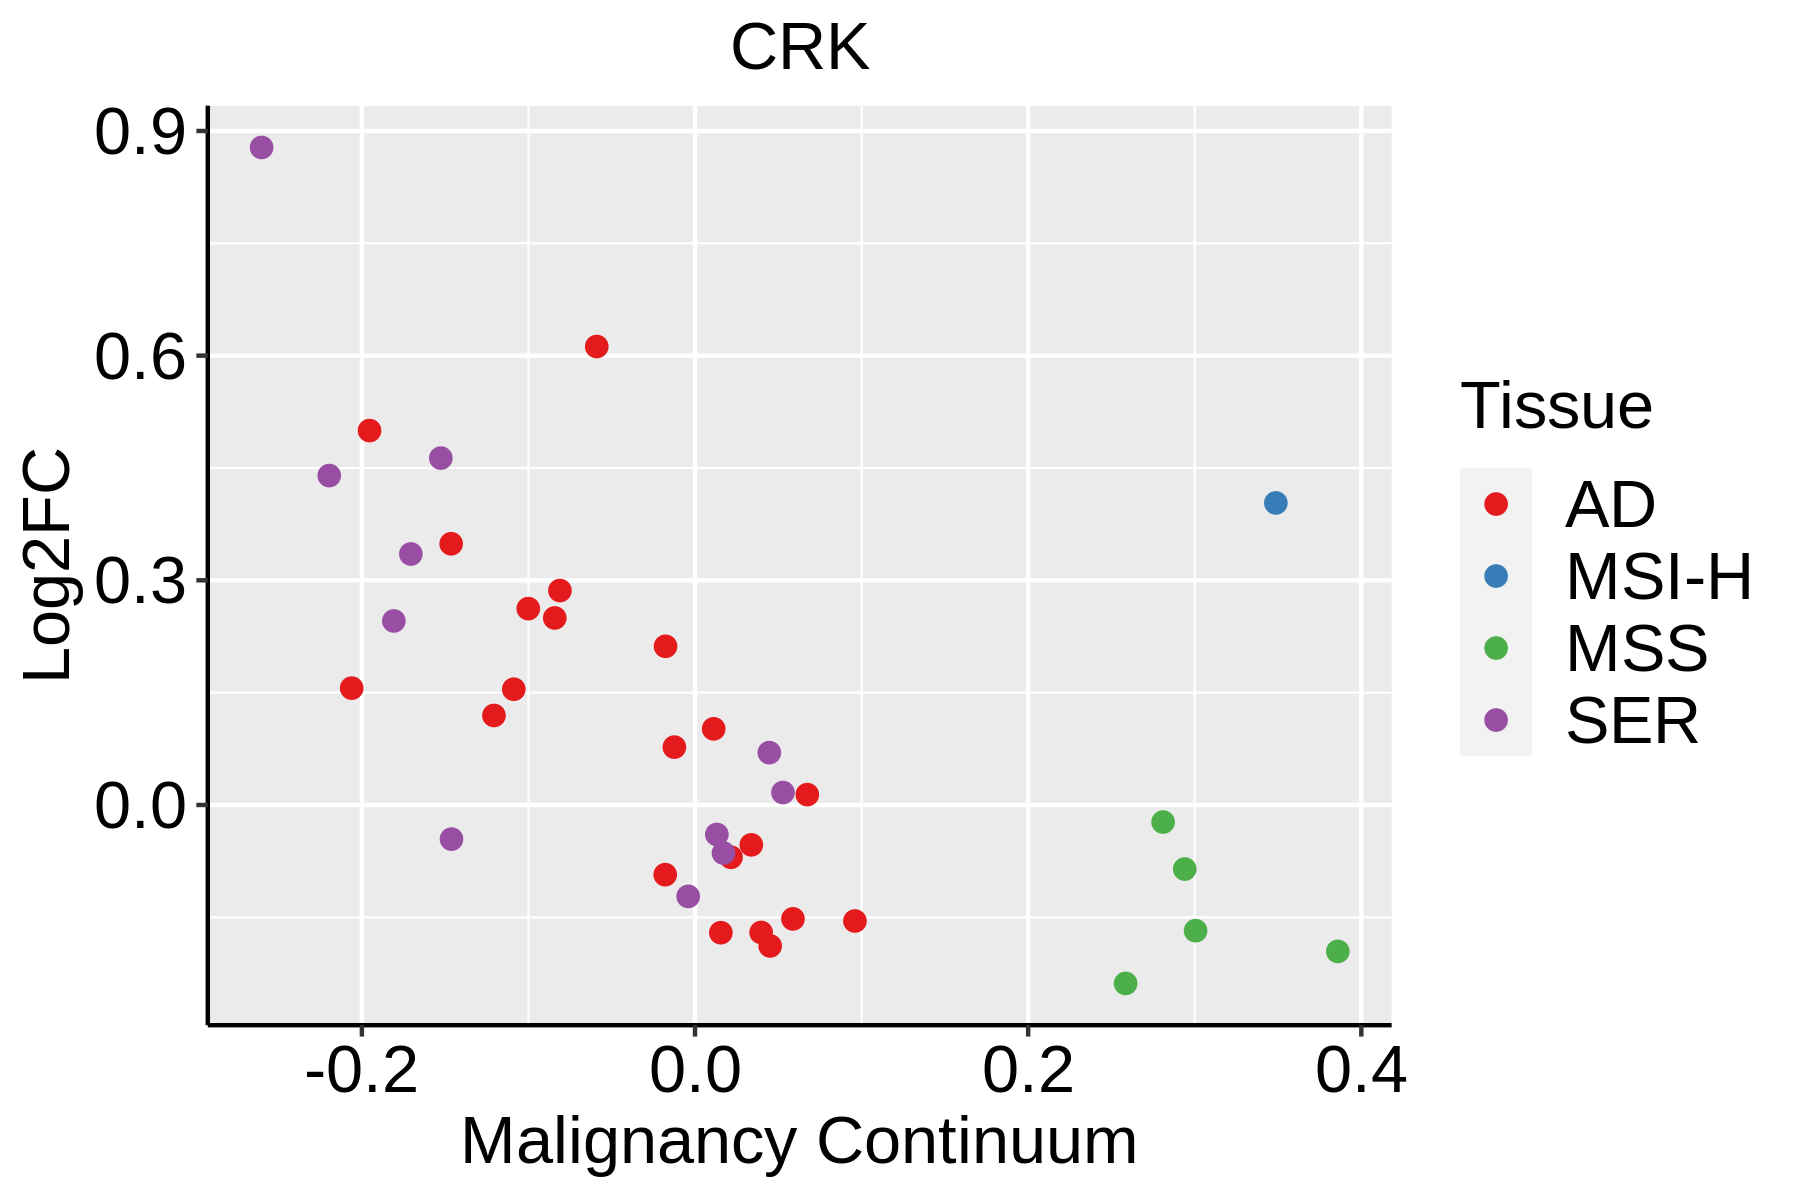 | AD: Adenomas |
| SER: Sessile serrated lesions | ||
| MSI-H: Microsatellite-high colorectal cancer | ||
| MSS: Microsatellite stable colorectal cancer | ||
| Esophagus | 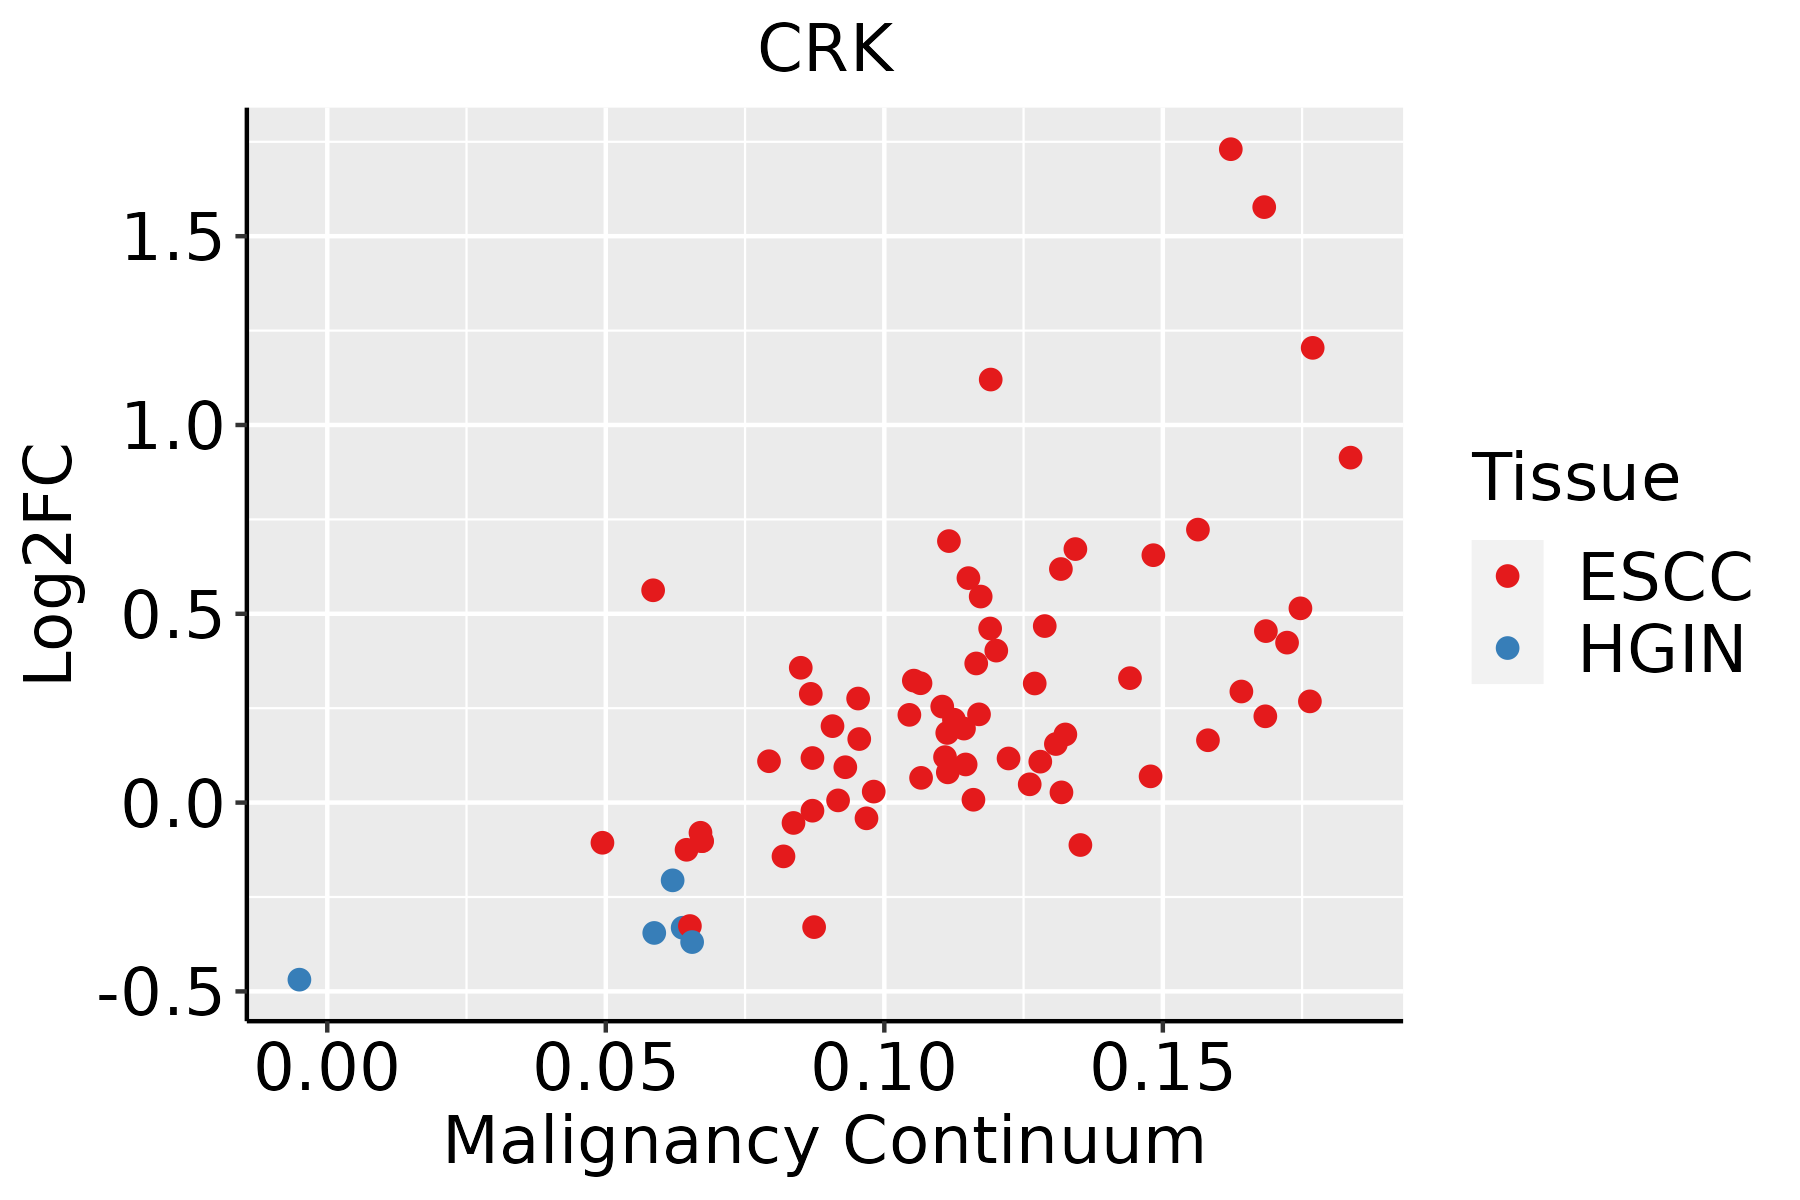 | ESCC: Esophageal squamous cell carcinoma |
| HGIN: High-grade intraepithelial neoplasias | ||
| LGIN: Low-grade intraepithelial neoplasias | ||
| Liver | 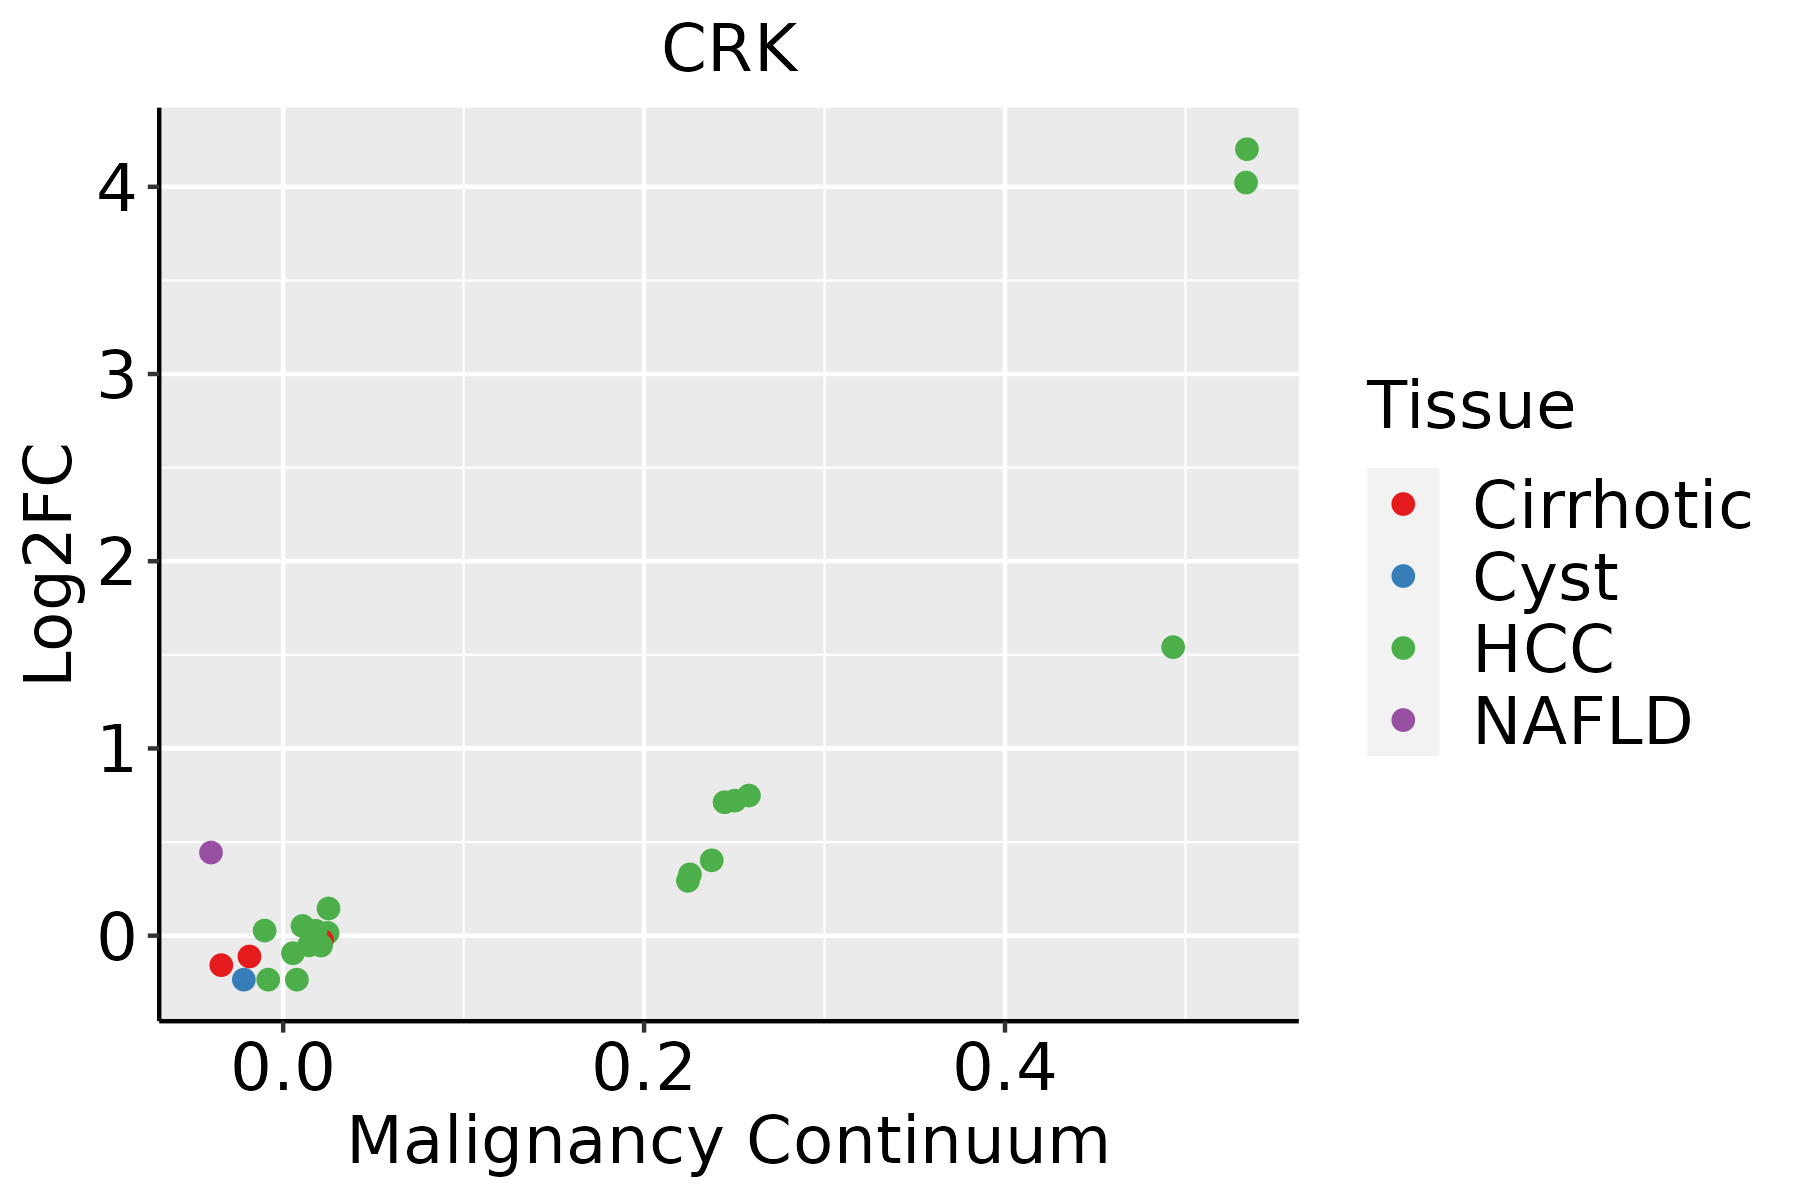 | HCC: Hepatocellular carcinoma |
| NAFLD: Non-alcoholic fatty liver disease | ||
| Oral Cavity | 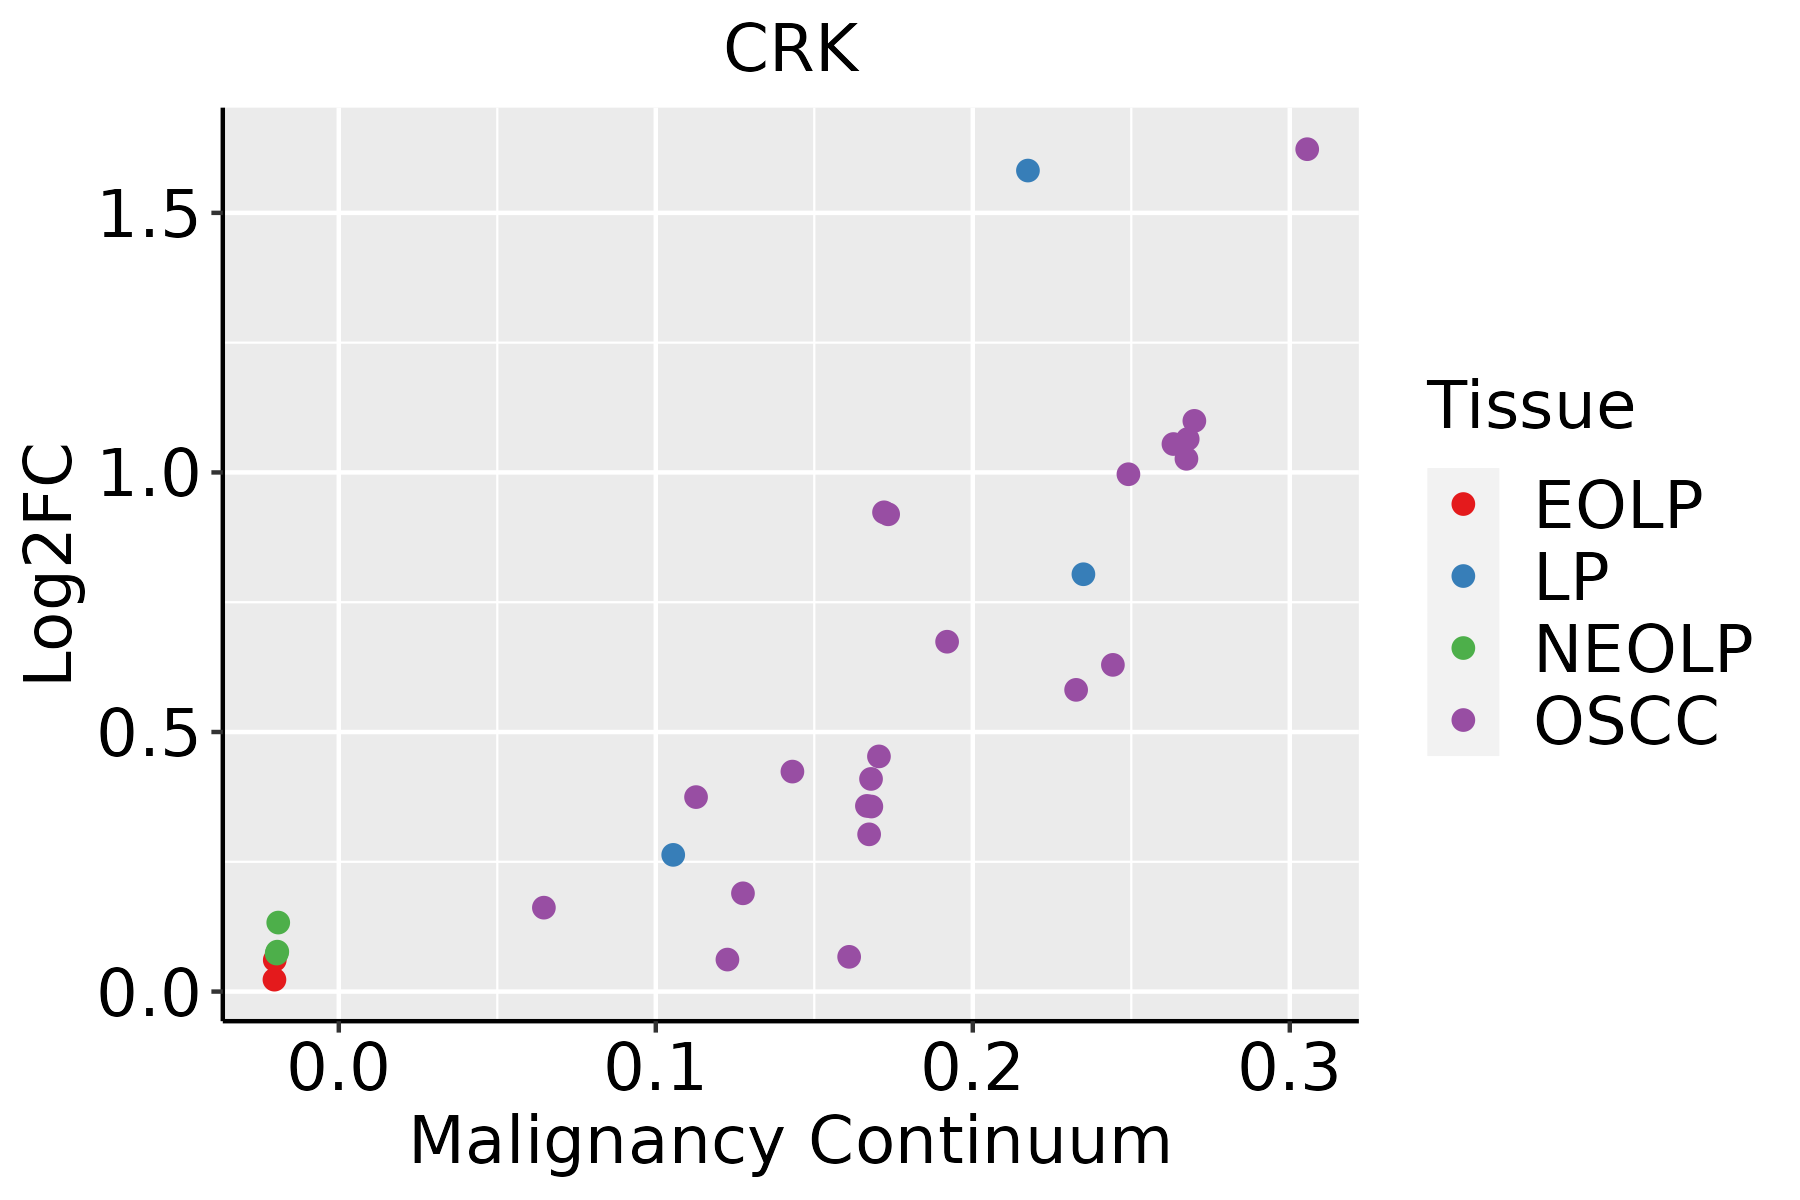 | EOLP: Erosive Oral lichen planus |
| LP: leukoplakia | ||
| NEOLP: Non-erosive oral lichen planus | ||
| OSCC: Oral squamous cell carcinoma | ||
| Skin | 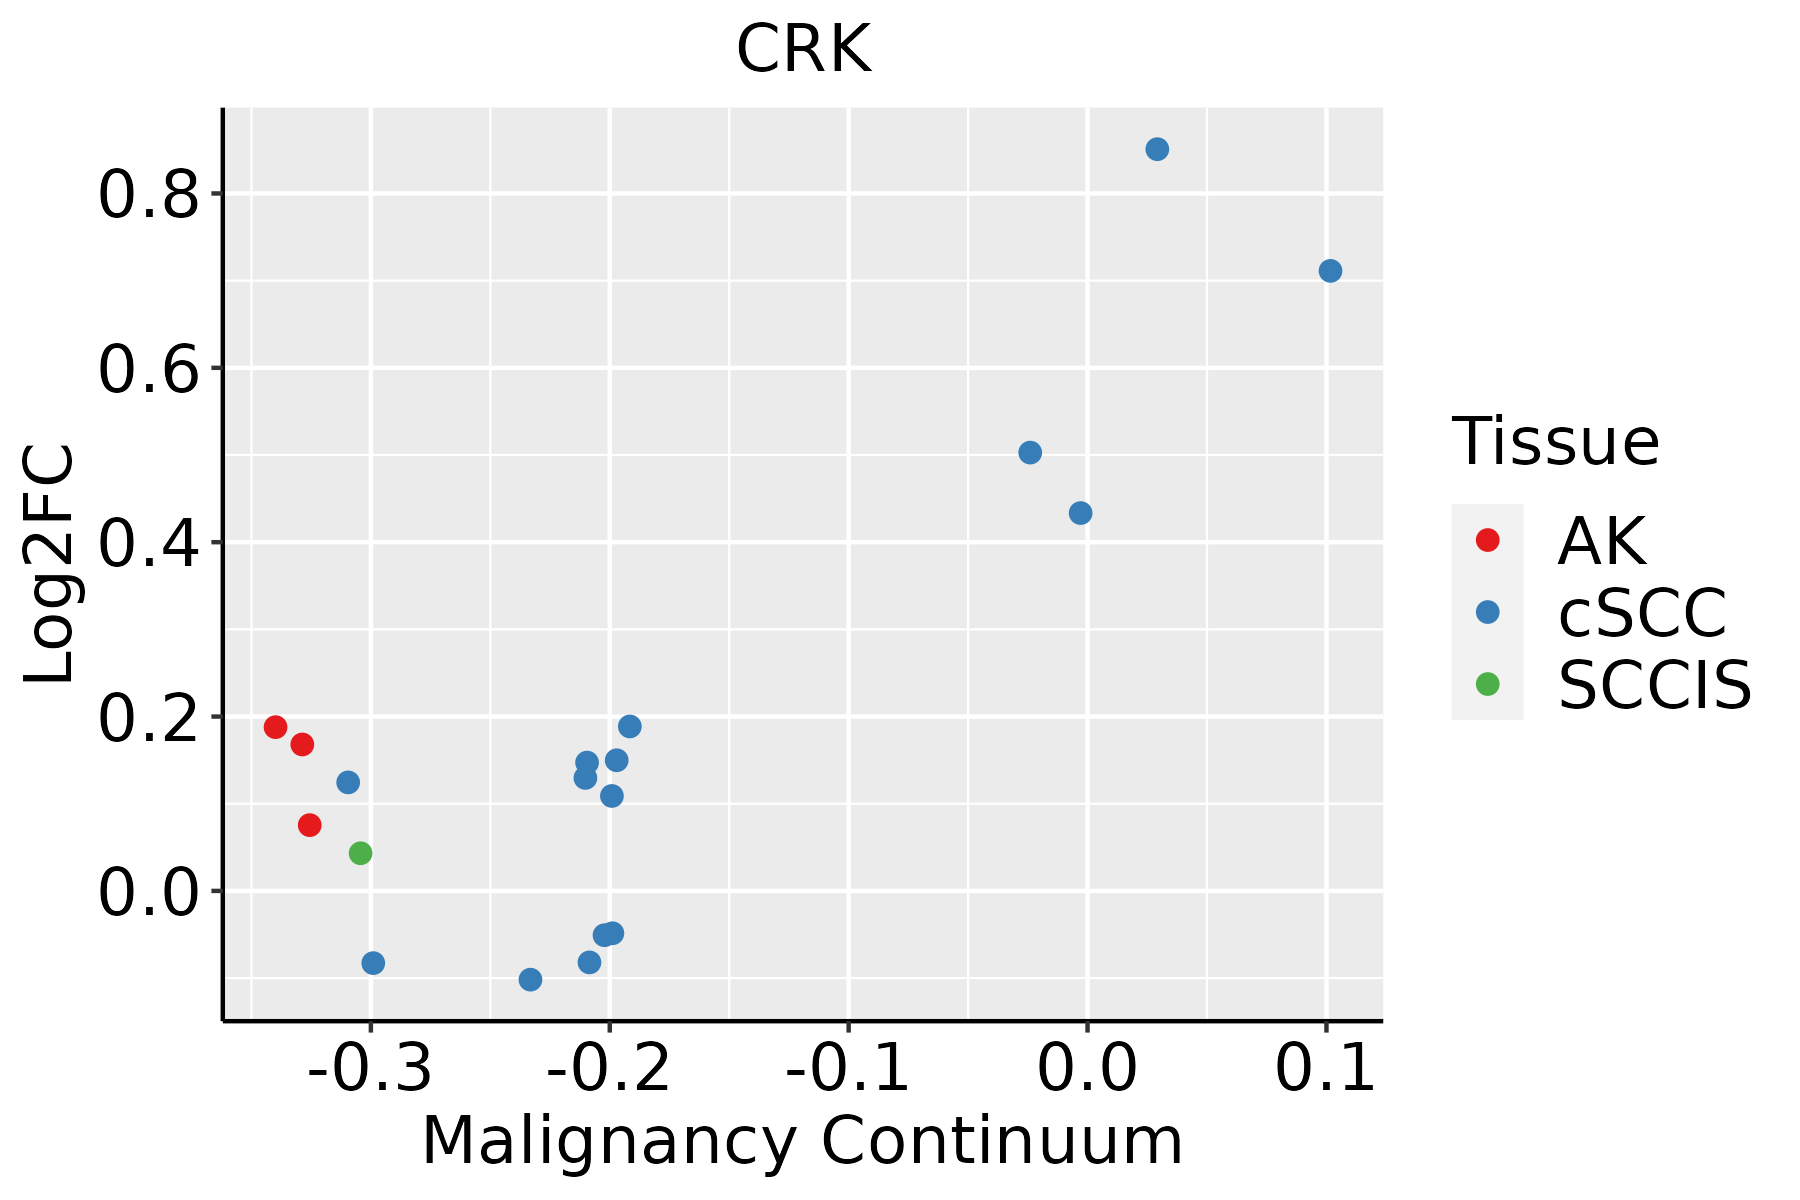 | AK: Actinic keratosis |
| cSCC: Cutaneous squamous cell carcinoma | ||
| SCCIS:squamous cell carcinoma in situ | ||
| Thyroid | 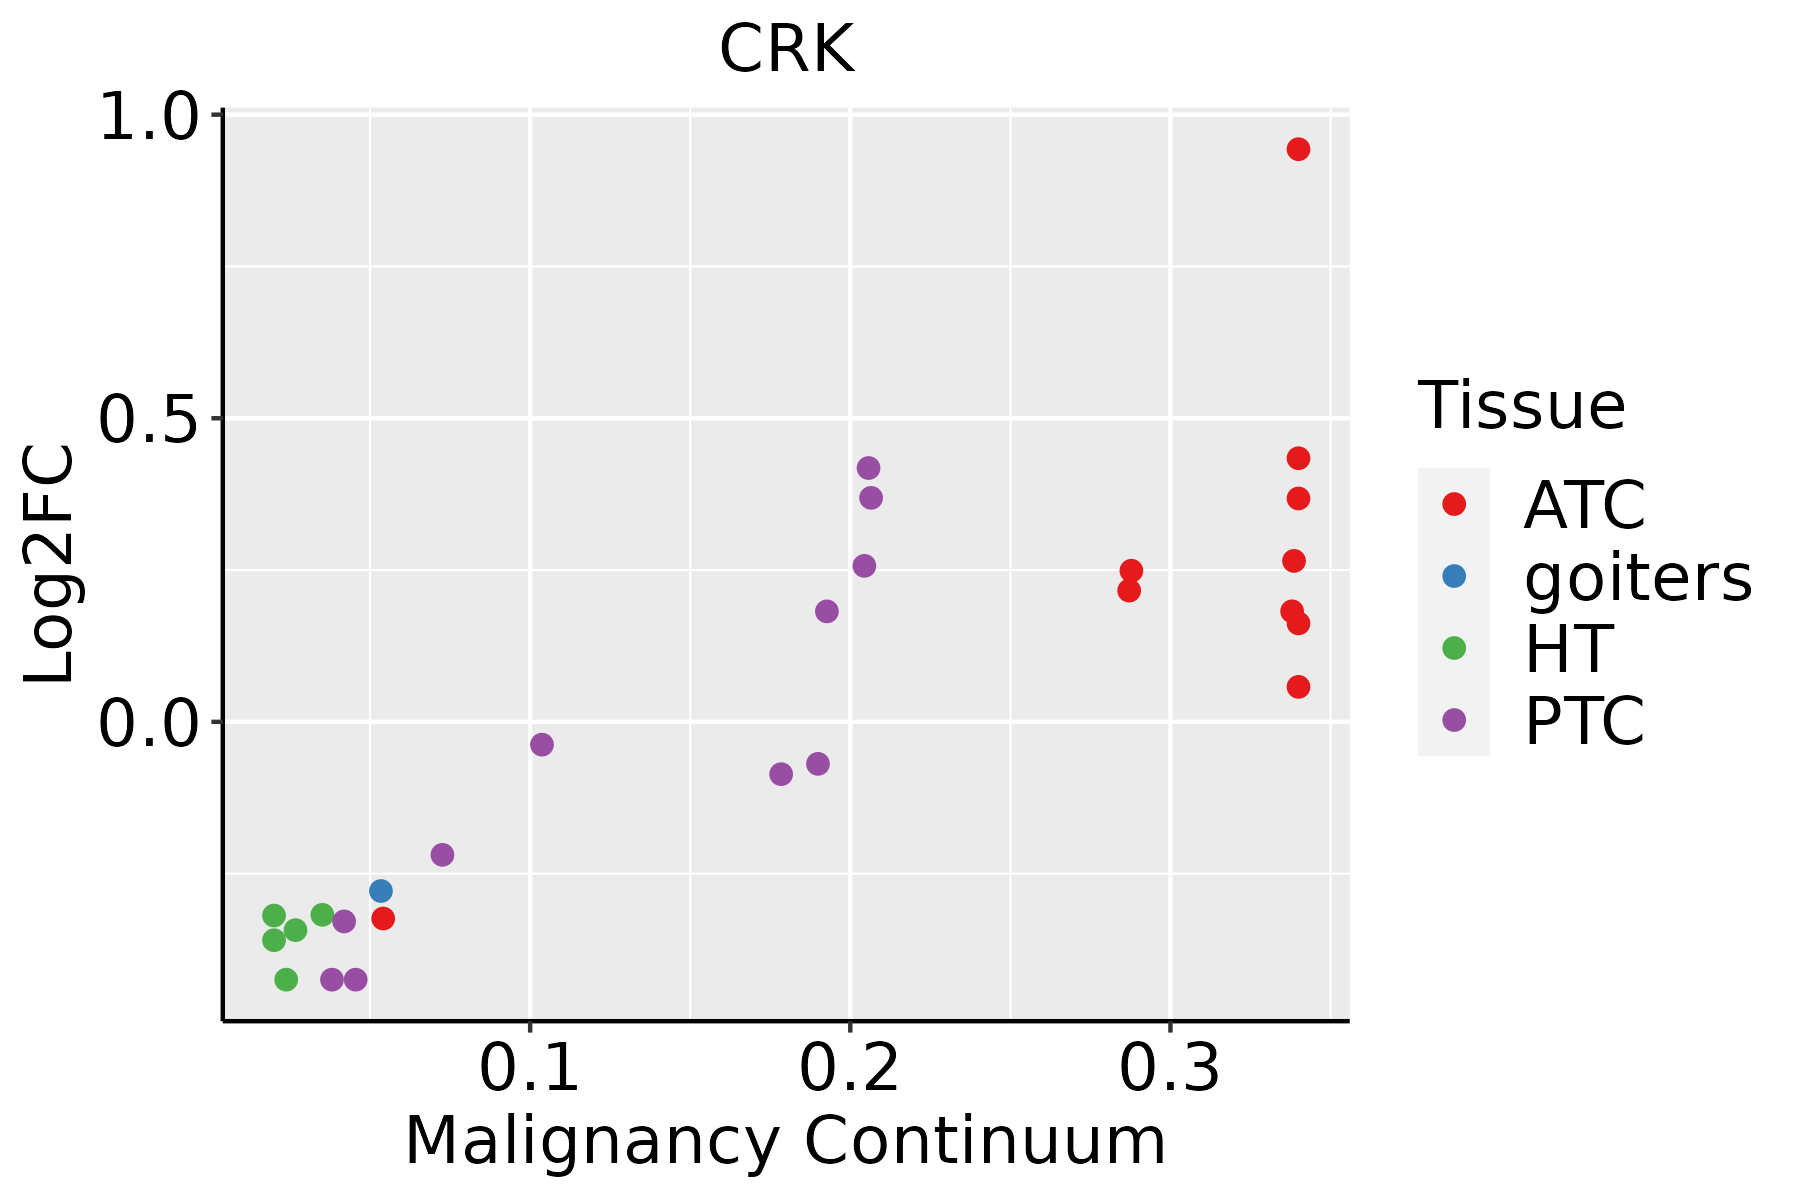 | ATC: Anaplastic thyroid cancer |
| HT: Hashimoto's thyroiditis | ||
| PTC: Papillary thyroid cancer |
| ∗log2FC in expression of this searched gene in stem-like cells from each diseased tissue sample relative to stem-like cells in normal samples in each tissue plotted against the malignancy continuum. Samples are colored based on if they are from different disease stage. |
Top |
Malignant transformation related pathway analysis |
| Find out the enriched GO biological processes and KEGG pathways involved in transition from healthy to precancer to cancer |
| Tissue | Disease Stage | Enriched GO biological Processes |
| Colorectum | AD |  |
| Colorectum | SER |  |
| Colorectum | MSS |  |
| Colorectum | MSI-H |  |
| Colorectum | FAP |  |
| ∗Top 15 enriched GO BP terms are showed in the bar plot of each disease state in each tissue. Each row represents a significant GO biological process which is colored according to the -log10(p.adjust). |
| Page: 1 2 3 4 5 6 7 8 9 |
| GO ID | Tissue | Disease Stage | Description | Gene Ratio | Bg Ratio | pvalue | p.adjust | Count |
| GO:003052218 | Oral cavity | OSCC | intracellular receptor signaling pathway | 149/7305 | 265/18723 | 8.69e-09 | 1.81e-07 | 149 |
| GO:190547516 | Oral cavity | OSCC | regulation of protein localization to membrane | 105/7305 | 175/18723 | 1.42e-08 | 2.85e-07 | 105 |
| GO:00028317 | Oral cavity | OSCC | regulation of response to biotic stimulus | 177/7305 | 327/18723 | 1.73e-08 | 3.43e-07 | 177 |
| GO:003297020 | Oral cavity | OSCC | regulation of actin filament-based process | 209/7305 | 397/18723 | 1.89e-08 | 3.72e-07 | 209 |
| GO:003158917 | Oral cavity | OSCC | cell-substrate adhesion | 193/7305 | 363/18723 | 2.48e-08 | 4.82e-07 | 193 |
| GO:004873220 | Oral cavity | OSCC | gland development | 226/7305 | 436/18723 | 2.78e-08 | 5.39e-07 | 226 |
| GO:001081019 | Oral cavity | OSCC | regulation of cell-substrate adhesion | 126/7305 | 221/18723 | 4.02e-08 | 7.55e-07 | 126 |
| GO:005140316 | Oral cavity | OSCC | stress-activated MAPK cascade | 134/7305 | 239/18723 | 6.02e-08 | 1.09e-06 | 134 |
| GO:004578520 | Oral cavity | OSCC | positive regulation of cell adhesion | 225/7305 | 437/18723 | 6.06e-08 | 1.09e-06 | 225 |
| GO:003295620 | Oral cavity | OSCC | regulation of actin cytoskeleton organization | 189/7305 | 358/18723 | 6.81e-08 | 1.21e-06 | 189 |
| GO:00715598 | Oral cavity | OSCC | response to transforming growth factor beta | 140/7305 | 256/18723 | 2.34e-07 | 3.70e-06 | 140 |
| GO:00715608 | Oral cavity | OSCC | cellular response to transforming growth factor beta stimulus | 137/7305 | 250/18723 | 2.68e-07 | 4.15e-06 | 137 |
| GO:00107209 | Oral cavity | OSCC | positive regulation of cell development | 159/7305 | 298/18723 | 3.06e-07 | 4.66e-06 | 159 |
| GO:006145817 | Oral cavity | OSCC | reproductive system development | 217/7305 | 427/18723 | 3.75e-07 | 5.63e-06 | 217 |
| GO:002260419 | Oral cavity | OSCC | regulation of cell morphogenesis | 163/7305 | 309/18723 | 5.66e-07 | 8.19e-06 | 163 |
| GO:004860816 | Oral cavity | OSCC | reproductive structure development | 214/7305 | 424/18723 | 8.58e-07 | 1.18e-05 | 214 |
| GO:007137510 | Oral cavity | OSCC | cellular response to peptide hormone stimulus | 153/7305 | 290/18723 | 1.23e-06 | 1.63e-05 | 153 |
| GO:004343419 | Oral cavity | OSCC | response to peptide hormone | 208/7305 | 414/18723 | 1.83e-06 | 2.35e-05 | 208 |
| GO:000836016 | Oral cavity | OSCC | regulation of cell shape | 88/7305 | 154/18723 | 3.73e-06 | 4.42e-05 | 88 |
| GO:003001016 | Oral cavity | OSCC | establishment of cell polarity | 82/7305 | 143/18723 | 6.56e-06 | 7.24e-05 | 82 |
| Page: 1 2 3 4 5 6 7 8 9 10 11 12 13 14 15 16 17 18 19 20 21 22 23 24 25 26 27 28 29 30 31 32 33 34 35 36 37 |
| Pathway ID | Tissue | Disease Stage | Description | Gene Ratio | Bg Ratio | pvalue | p.adjust | qvalue | Count |
| hsa05131 | Colorectum | AD | Shigellosis | 109/2092 | 247/8465 | 1.09e-11 | 2.44e-10 | 1.55e-10 | 109 |
| hsa05100 | Colorectum | AD | Bacterial invasion of epithelial cells | 44/2092 | 77/8465 | 1.13e-09 | 2.22e-08 | 1.42e-08 | 44 |
| hsa04666 | Colorectum | AD | Fc gamma R-mediated phagocytosis | 46/2092 | 97/8465 | 9.10e-07 | 1.22e-05 | 7.77e-06 | 46 |
| hsa05135 | Colorectum | AD | Yersinia infection | 58/2092 | 137/8465 | 3.90e-06 | 4.35e-05 | 2.78e-05 | 58 |
| hsa04722 | Colorectum | AD | Neurotrophin signaling pathway | 50/2092 | 119/8465 | 2.28e-05 | 2.24e-04 | 1.43e-04 | 50 |
| hsa05170 | Colorectum | AD | Human immunodeficiency virus 1 infection | 72/2092 | 212/8465 | 1.40e-03 | 8.46e-03 | 5.39e-03 | 72 |
| hsa05220 | Colorectum | AD | Chronic myeloid leukemia | 31/2092 | 76/8465 | 1.41e-03 | 8.46e-03 | 5.39e-03 | 31 |
| hsa04015 | Colorectum | AD | Rap1 signaling pathway | 71/2092 | 210/8465 | 1.72e-03 | 9.68e-03 | 6.18e-03 | 71 |
| hsa05163 | Colorectum | AD | Human cytomegalovirus infection | 75/2092 | 225/8465 | 2.00e-03 | 1.10e-02 | 7.01e-03 | 75 |
| hsa05211 | Colorectum | AD | Renal cell carcinoma | 28/2092 | 69/8465 | 2.58e-03 | 1.37e-02 | 8.75e-03 | 28 |
| hsa04810 | Colorectum | AD | Regulation of actin cytoskeleton | 75/2092 | 229/8465 | 3.36e-03 | 1.76e-02 | 1.12e-02 | 75 |
| hsa04510 | Colorectum | AD | Focal adhesion | 67/2092 | 203/8465 | 4.40e-03 | 2.17e-02 | 1.38e-02 | 67 |
| hsa04012 | Colorectum | AD | ErbB signaling pathway | 31/2092 | 85/8465 | 1.02e-02 | 3.91e-02 | 2.50e-02 | 31 |
| hsa051311 | Colorectum | AD | Shigellosis | 109/2092 | 247/8465 | 1.09e-11 | 2.44e-10 | 1.55e-10 | 109 |
| hsa051001 | Colorectum | AD | Bacterial invasion of epithelial cells | 44/2092 | 77/8465 | 1.13e-09 | 2.22e-08 | 1.42e-08 | 44 |
| hsa046661 | Colorectum | AD | Fc gamma R-mediated phagocytosis | 46/2092 | 97/8465 | 9.10e-07 | 1.22e-05 | 7.77e-06 | 46 |
| hsa051351 | Colorectum | AD | Yersinia infection | 58/2092 | 137/8465 | 3.90e-06 | 4.35e-05 | 2.78e-05 | 58 |
| hsa047221 | Colorectum | AD | Neurotrophin signaling pathway | 50/2092 | 119/8465 | 2.28e-05 | 2.24e-04 | 1.43e-04 | 50 |
| hsa051701 | Colorectum | AD | Human immunodeficiency virus 1 infection | 72/2092 | 212/8465 | 1.40e-03 | 8.46e-03 | 5.39e-03 | 72 |
| hsa052201 | Colorectum | AD | Chronic myeloid leukemia | 31/2092 | 76/8465 | 1.41e-03 | 8.46e-03 | 5.39e-03 | 31 |
| Page: 1 2 3 4 5 6 7 8 9 10 11 12 13 |
Top |
Cell-cell communication analysis |
| Identification of potential cell-cell interactions between two cell types and their ligand-receptor pairs for different disease states |
| Ligand | Receptor | LRpair | Pathway | Tissue | Disease Stage |
| Page: 1 |
Top |
Single-cell gene regulatory network inference analysis |
| Find out the significant the regulons (TFs) and the target genes of each regulon across cell types for different disease states |
| TF | Cell Type | Tissue | Disease Stage | Target Gene | RSS | Regulon Activity |
| ∗The dot plots of a searched regulon are shown for all cell subpopulations in each disease state of each tissue based on the regulon specific score inferred using pySCENIC and by calculating the average expression. |
| Page: 1 |
Top |
Somatic mutation of malignant transformation related genes |
| Annotation of somatic variants for genes involved in malignant transformation |
| Hugo Symbol | Variant Class | Variant Classification | dbSNP RS | HGVSc | HGVSp | HGVSp Short | SWISSPROT | BIOTYPE | SIFT | PolyPhen | Tumor Sample Barcode | Tissue | Histology | Sex | Age | Stage | Therapy Types | Drugs | Outcome |
| CRK | SNV | Missense_Mutation | novel | c.608N>A | p.Gly203Asp | p.G203D | P46108 | protein_coding | deleterious(0.03) | benign(0.006) | TCGA-BH-A0HF-01 | Breast | breast invasive carcinoma | Female | >=65 | I/II | Hormone Therapy | arimidex | SD |
| CRK | SNV | Missense_Mutation | novel | c.777G>T | p.Glu259Asp | p.E259D | P46108 | protein_coding | tolerated(0.07) | benign(0.118) | TCGA-AJ-A8CW-01 | Endometrium | uterine corpus endometrioid carcinoma | Female | <65 | I/II | Unknown | Unknown | SD |
| CRK | SNV | Missense_Mutation | rs145983279 | c.562G>A | p.Glu188Lys | p.E188K | P46108 | protein_coding | deleterious(0.02) | benign(0.438) | TCGA-AX-A06F-01 | Endometrium | uterine corpus endometrioid carcinoma | Female | <65 | III/IV | Chemotherapy | carboplatin | SD |
| CRK | SNV | Missense_Mutation | novel | c.795N>T | p.Lys265Asn | p.K265N | P46108 | protein_coding | deleterious(0.02) | probably_damaging(0.955) | TCGA-AX-A1CE-01 | Endometrium | uterine corpus endometrioid carcinoma | Female | <65 | I/II | Unspecific | Paclitaxel | SD |
| CRK | SNV | Missense_Mutation | rs748897674 | c.686N>T | p.Pro229Leu | p.P229L | P46108 | protein_coding | deleterious(0.02) | benign(0.157) | TCGA-D1-A16R-01 | Endometrium | uterine corpus endometrioid carcinoma | Female | <65 | I/II | Unknown | Unknown | SD |
| CRK | SNV | Missense_Mutation | novel | c.385N>A | p.Leu129Ile | p.L129I | P46108 | protein_coding | tolerated(0.23) | benign(0) | TCGA-E6-A1M0-01 | Endometrium | uterine corpus endometrioid carcinoma | Female | <65 | III/IV | Chemotherapy | carboplatin | SD |
| CRK | SNV | Missense_Mutation | novel | c.721N>G | p.Arg241Gly | p.R241G | P46108 | protein_coding | deleterious(0) | probably_damaging(0.95) | TCGA-FI-A2F4-01 | Endometrium | uterine corpus endometrioid carcinoma | Female | <65 | I/II | Unknown | Unknown | SD |
| CRK | deletion | Frame_Shift_Del | c.818delN | p.Gly273ValfsTer66 | p.G273Vfs*66 | P46108 | protein_coding | TCGA-55-7725-01 | Lung | lung adenocarcinoma | Female | >=65 | I/II | Unknown | Unknown | SD | |||
| CRK | SNV | Missense_Mutation | rs776920144 | c.559N>A | p.Val187Ile | p.V187I | P46108 | protein_coding | tolerated(0.09) | possibly_damaging(0.63) | TCGA-CN-5365-01 | Oral cavity | head & neck squamous cell carcinoma | Male | <65 | I/II | Unknown | Unknown | PD |
| CRK | SNV | Missense_Mutation | c.172N>G | p.Ser58Ala | p.S58A | P46108 | protein_coding | deleterious(0.01) | probably_damaging(0.998) | TCGA-CH-5748-01 | Prostate | prostate adenocarcinoma | Male | <65 | 7 | Unknown | Unknown | SD |
| Page: 1 |
Top |
Related drugs of malignant transformation related genes |
| Identification of chemicals and drugs interact with genes involved in malignant transfromation |
| (DGIdb 4.0) |
| Entrez ID | Symbol | Category | Interaction Types | Drug Claim Name | Drug Name | PMIDs |
| Page: 1 |

Copyright 2023-Present -The University of Texas Health Science Center at Houston |