
|
|||||
|
 | |
| |
| |
| |
| |
| |
|
Gene: CHD2 |
Gene summary for CHD2 |
| Gene information | Species | Human | Gene symbol | CHD2 | Gene ID | 1106 |
| Gene name | chromodomain helicase DNA binding protein 2 | |
| Gene Alias | DEE94 | |
| Cytomap | 15q26.1 | |
| Gene Type | protein-coding | GO ID | GO:0002244 | UniProtAcc | O14647 |
Top |
Malignant transformation analysis |
| Identification of the aberrant gene expression in precancerous and cancerous lesions by comparing the gene expression of stem-like cells in diseased tissues with normal stem cells |
| Entrez ID | Symbol | Replicates | Species | Organ | Tissue | Adj P-value | Log2FC | Malignancy |
| 1106 | CHD2 | CA_HPV_1 | Human | Cervix | CC | 2.61e-05 | 7.68e-02 | 0.0264 |
| 1106 | CHD2 | CCI_2 | Human | Cervix | CC | 1.15e-03 | 7.06e-01 | 0.5249 |
| 1106 | CHD2 | CCI_3 | Human | Cervix | CC | 4.45e-08 | 7.91e-01 | 0.516 |
| 1106 | CHD2 | T1 | Human | Cervix | CC | 1.66e-02 | 2.75e-01 | 0.0918 |
| 1106 | CHD2 | AEH-subject1 | Human | Endometrium | AEH | 2.61e-29 | 6.75e-01 | -0.3059 |
| 1106 | CHD2 | AEH-subject2 | Human | Endometrium | AEH | 8.27e-05 | 3.44e-01 | -0.2525 |
| 1106 | CHD2 | AEH-subject3 | Human | Endometrium | AEH | 1.43e-09 | 3.08e-01 | -0.2576 |
| 1106 | CHD2 | AEH-subject4 | Human | Endometrium | AEH | 1.97e-20 | 7.31e-01 | -0.2657 |
| 1106 | CHD2 | AEH-subject5 | Human | Endometrium | AEH | 7.30e-36 | 8.60e-01 | -0.2953 |
| 1106 | CHD2 | EEC-subject1 | Human | Endometrium | EEC | 1.09e-37 | 7.29e-01 | -0.2682 |
| 1106 | CHD2 | EEC-subject2 | Human | Endometrium | EEC | 4.34e-13 | 4.62e-01 | -0.2607 |
| 1106 | CHD2 | EEC-subject3 | Human | Endometrium | EEC | 1.86e-18 | 3.56e-01 | -0.2525 |
| 1106 | CHD2 | EEC-subject4 | Human | Endometrium | EEC | 5.38e-20 | 5.63e-01 | -0.2571 |
| 1106 | CHD2 | EEC-subject5 | Human | Endometrium | EEC | 8.58e-22 | 6.40e-01 | -0.249 |
| 1106 | CHD2 | GSM6177620_NYU_UCEC1_lib1_lib1 | Human | Endometrium | EEC | 3.12e-12 | 7.81e-02 | -0.1869 |
| 1106 | CHD2 | GSM6177620_NYU_UCEC1_lib2_lib2 | Human | Endometrium | EEC | 6.40e-12 | -5.28e-02 | -0.1875 |
| 1106 | CHD2 | GSM6177620_NYU_UCEC1_lib3_lib3 | Human | Endometrium | EEC | 6.89e-15 | 5.05e-02 | -0.1883 |
| 1106 | CHD2 | GSM6177621_NYU_UCEC2_lib1_lib1 | Human | Endometrium | EEC | 1.38e-09 | 4.45e-02 | -0.1934 |
| 1106 | CHD2 | GSM6177622_NYU_UCEC3_lib1_lib1 | Human | Endometrium | EEC | 1.67e-25 | 9.18e-02 | -0.1917 |
| 1106 | CHD2 | GSM6177622_NYU_UCEC3_lib2_lib2 | Human | Endometrium | EEC | 1.01e-19 | 8.51e-02 | -0.1916 |
| Page: 1 2 3 4 5 6 7 8 9 10 11 |
| Tissue | Expression Dynamics | Abbreviation |
| Cervix |  | CC: Cervix cancer |
| HSIL_HPV: HPV-infected high-grade squamous intraepithelial lesions | ||
| N_HPV: HPV-infected normal cervix | ||
| Endometrium |  | AEH: Atypical endometrial hyperplasia |
| EEC: Endometrioid Cancer | ||
| Esophagus | 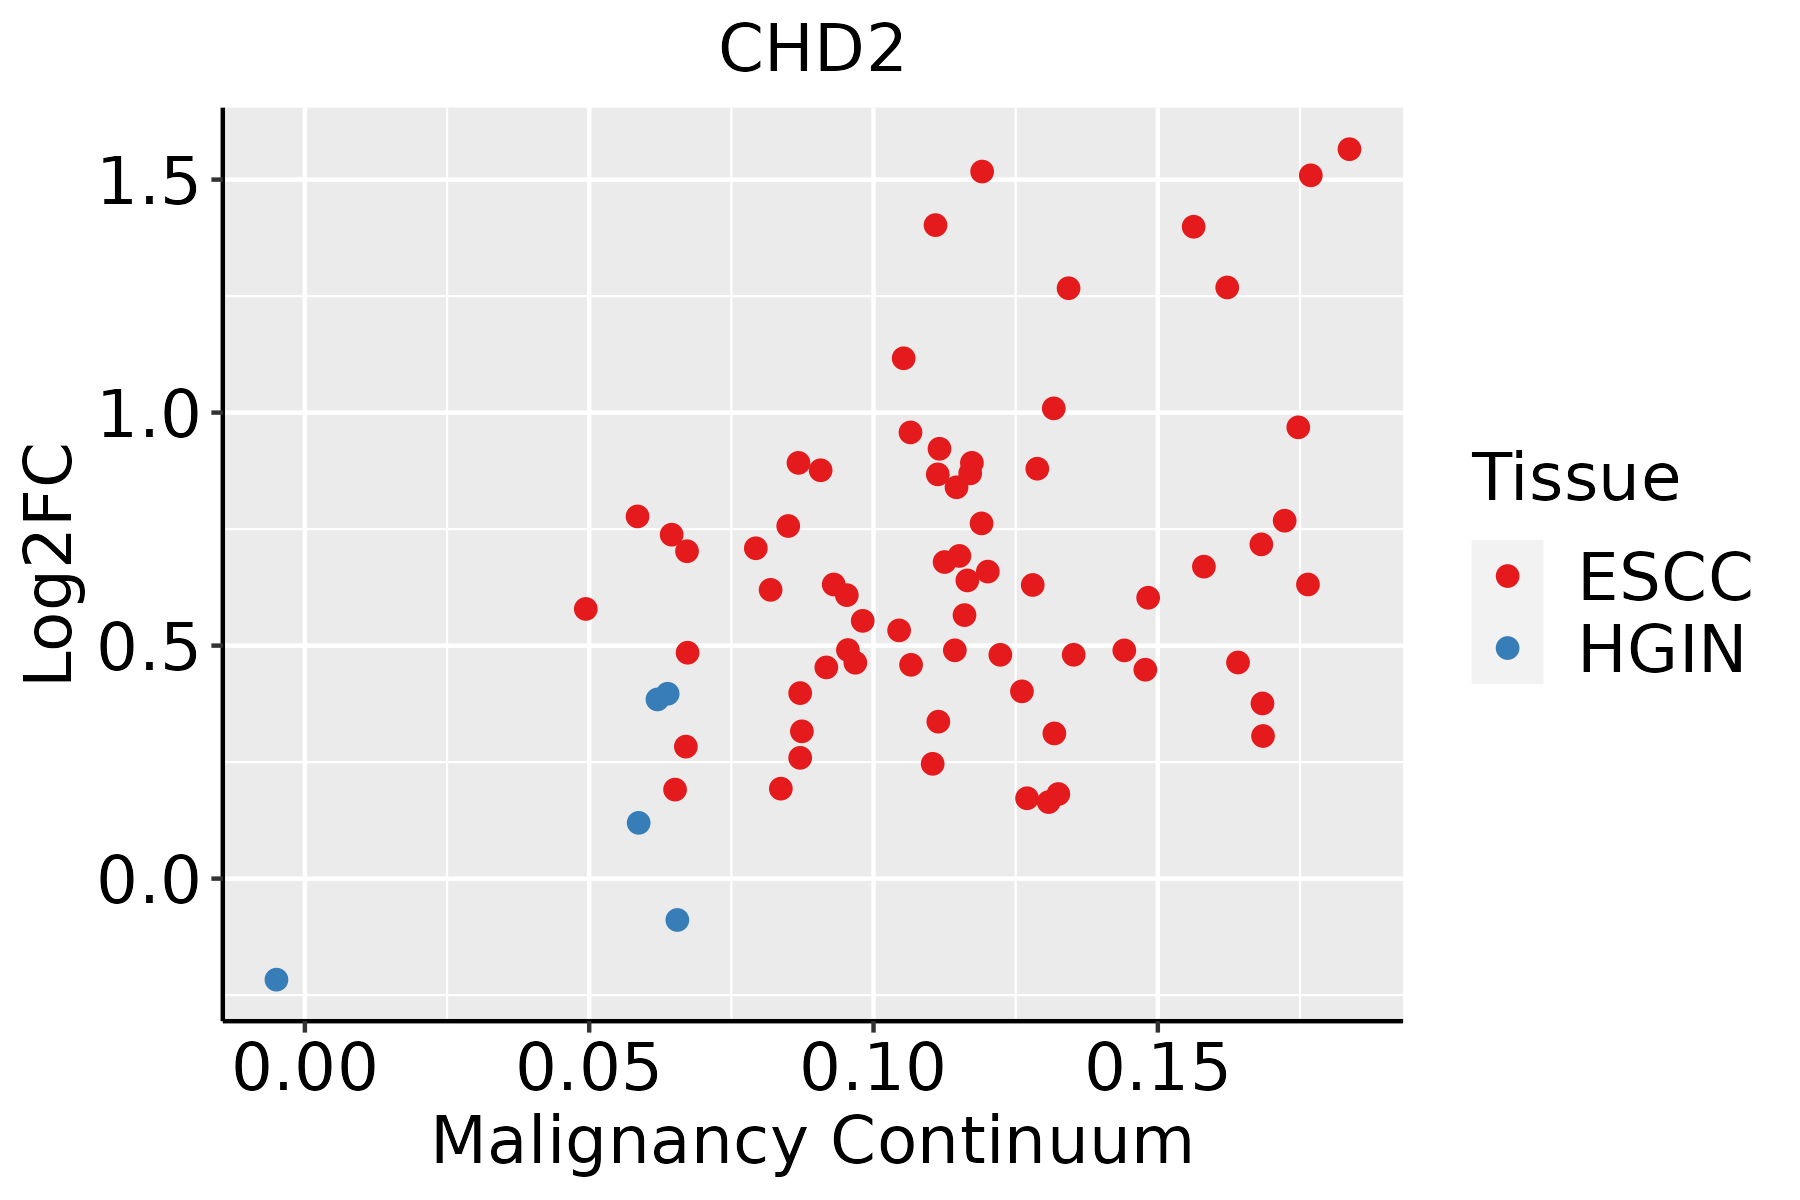 | ESCC: Esophageal squamous cell carcinoma |
| HGIN: High-grade intraepithelial neoplasias | ||
| LGIN: Low-grade intraepithelial neoplasias | ||
| Liver | 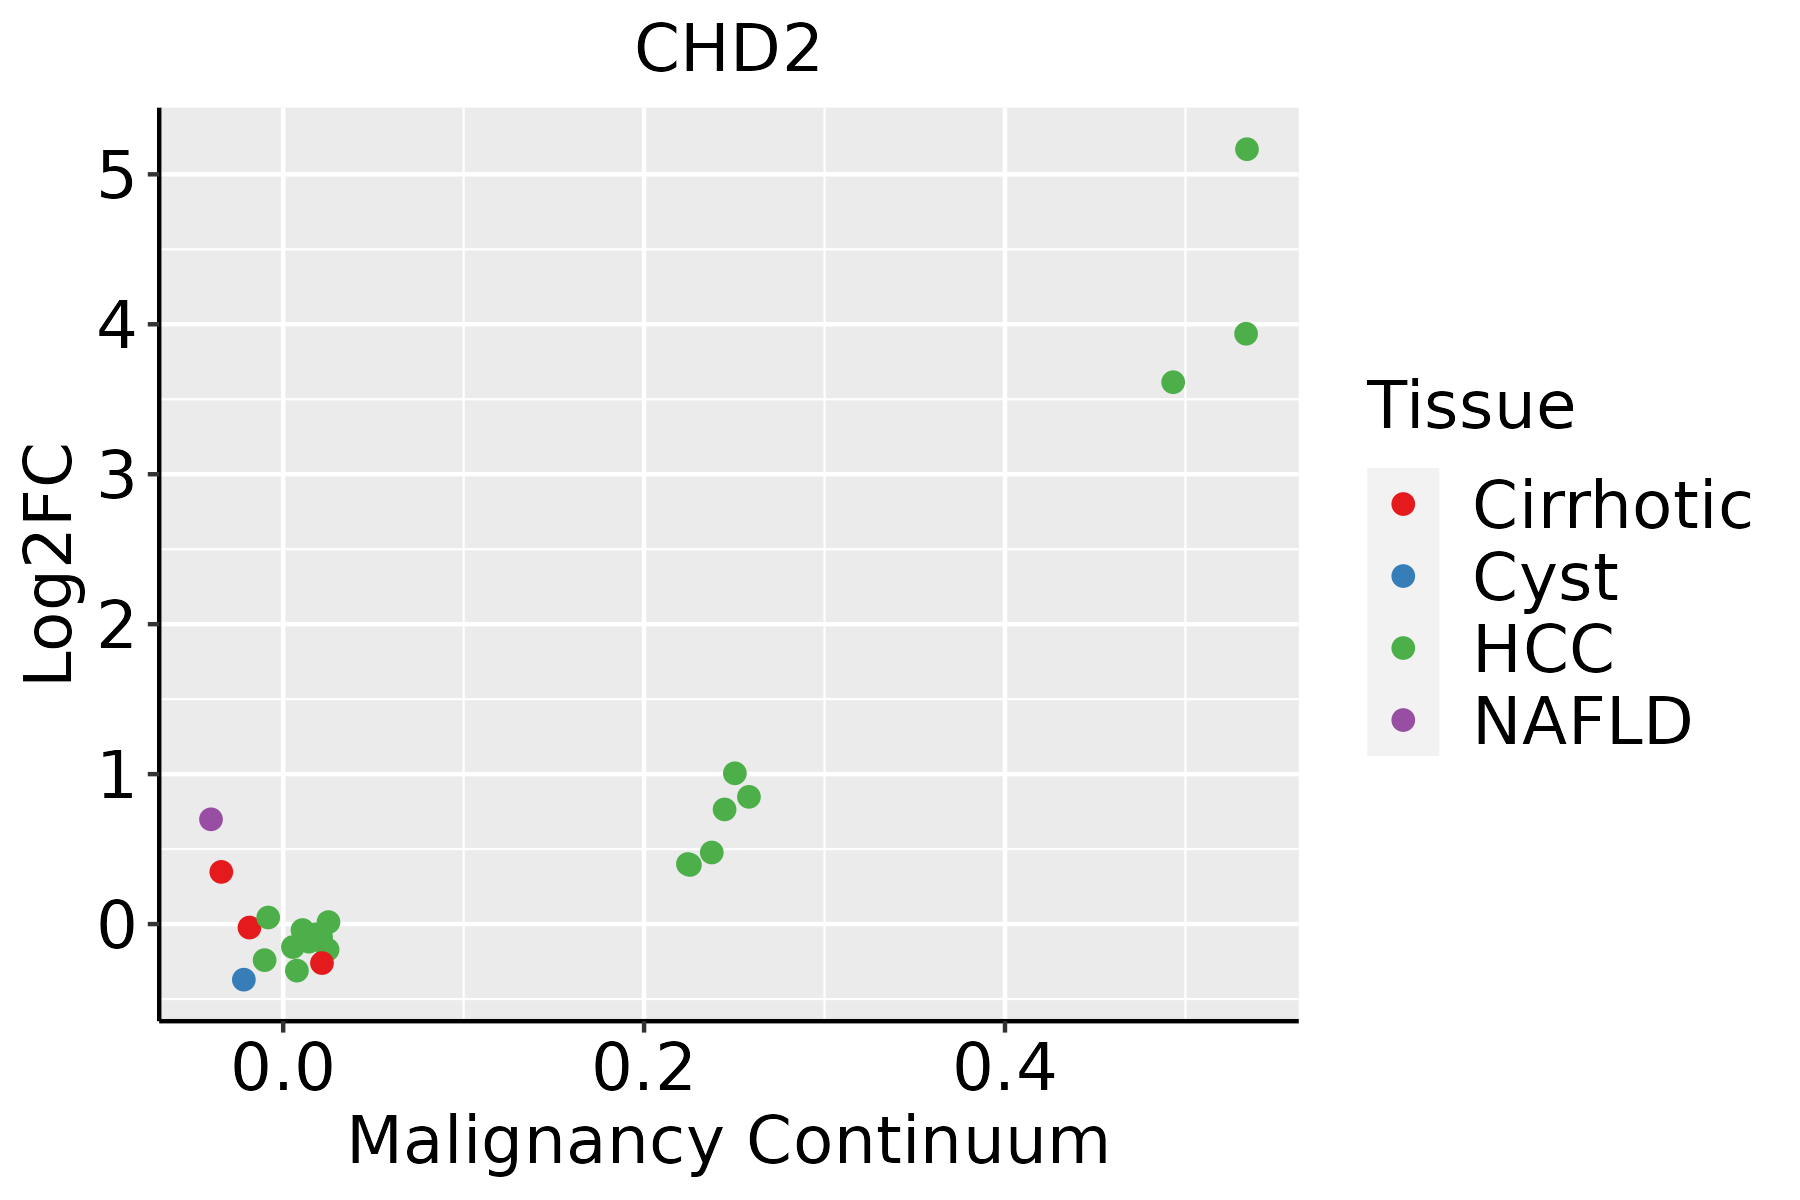 | HCC: Hepatocellular carcinoma |
| NAFLD: Non-alcoholic fatty liver disease | ||
| Lung | 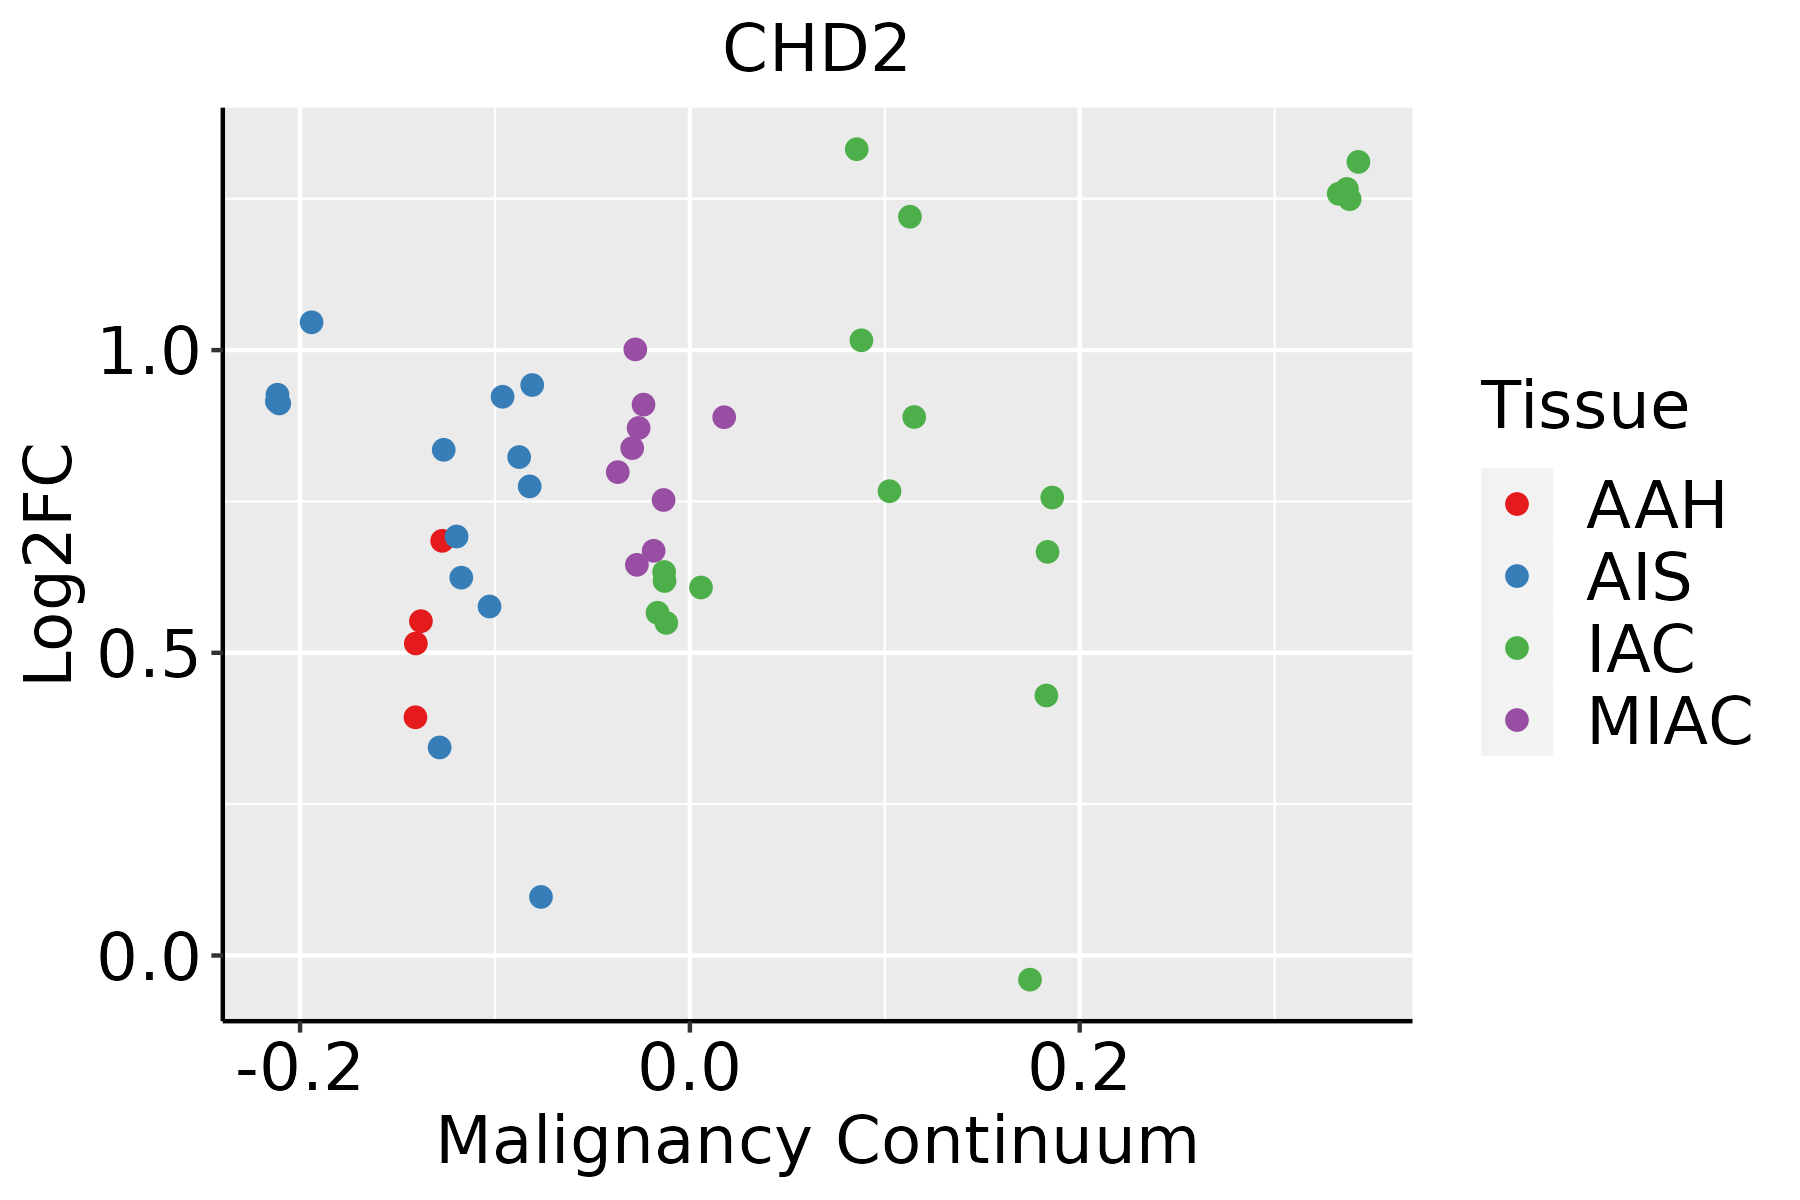 | AAH: Atypical adenomatous hyperplasia |
| AIS: Adenocarcinoma in situ | ||
| IAC: Invasive lung adenocarcinoma | ||
| MIA: Minimally invasive adenocarcinoma | ||
| Oral Cavity |  | EOLP: Erosive Oral lichen planus |
| LP: leukoplakia | ||
| NEOLP: Non-erosive oral lichen planus | ||
| OSCC: Oral squamous cell carcinoma | ||
| Prostate | 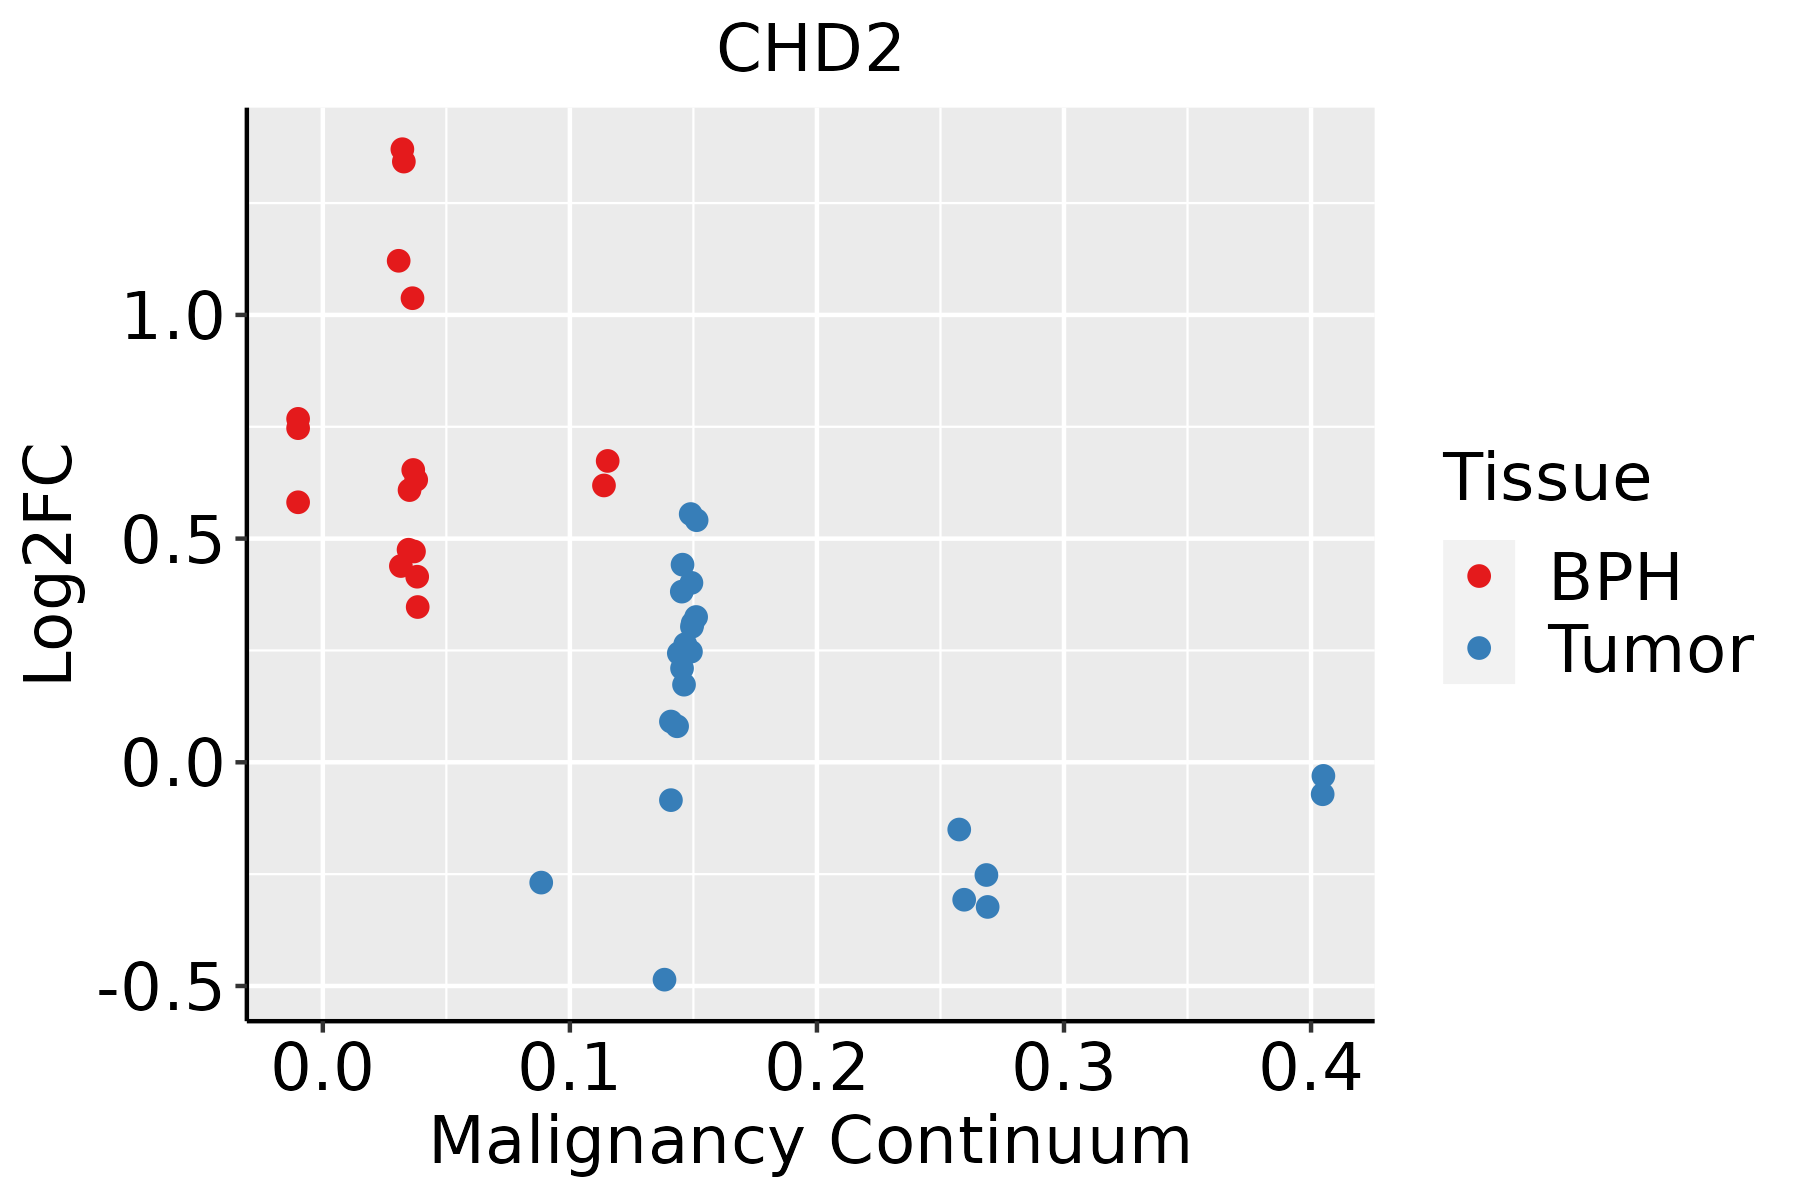 | BPH: Benign Prostatic Hyperplasia |
| Skin | 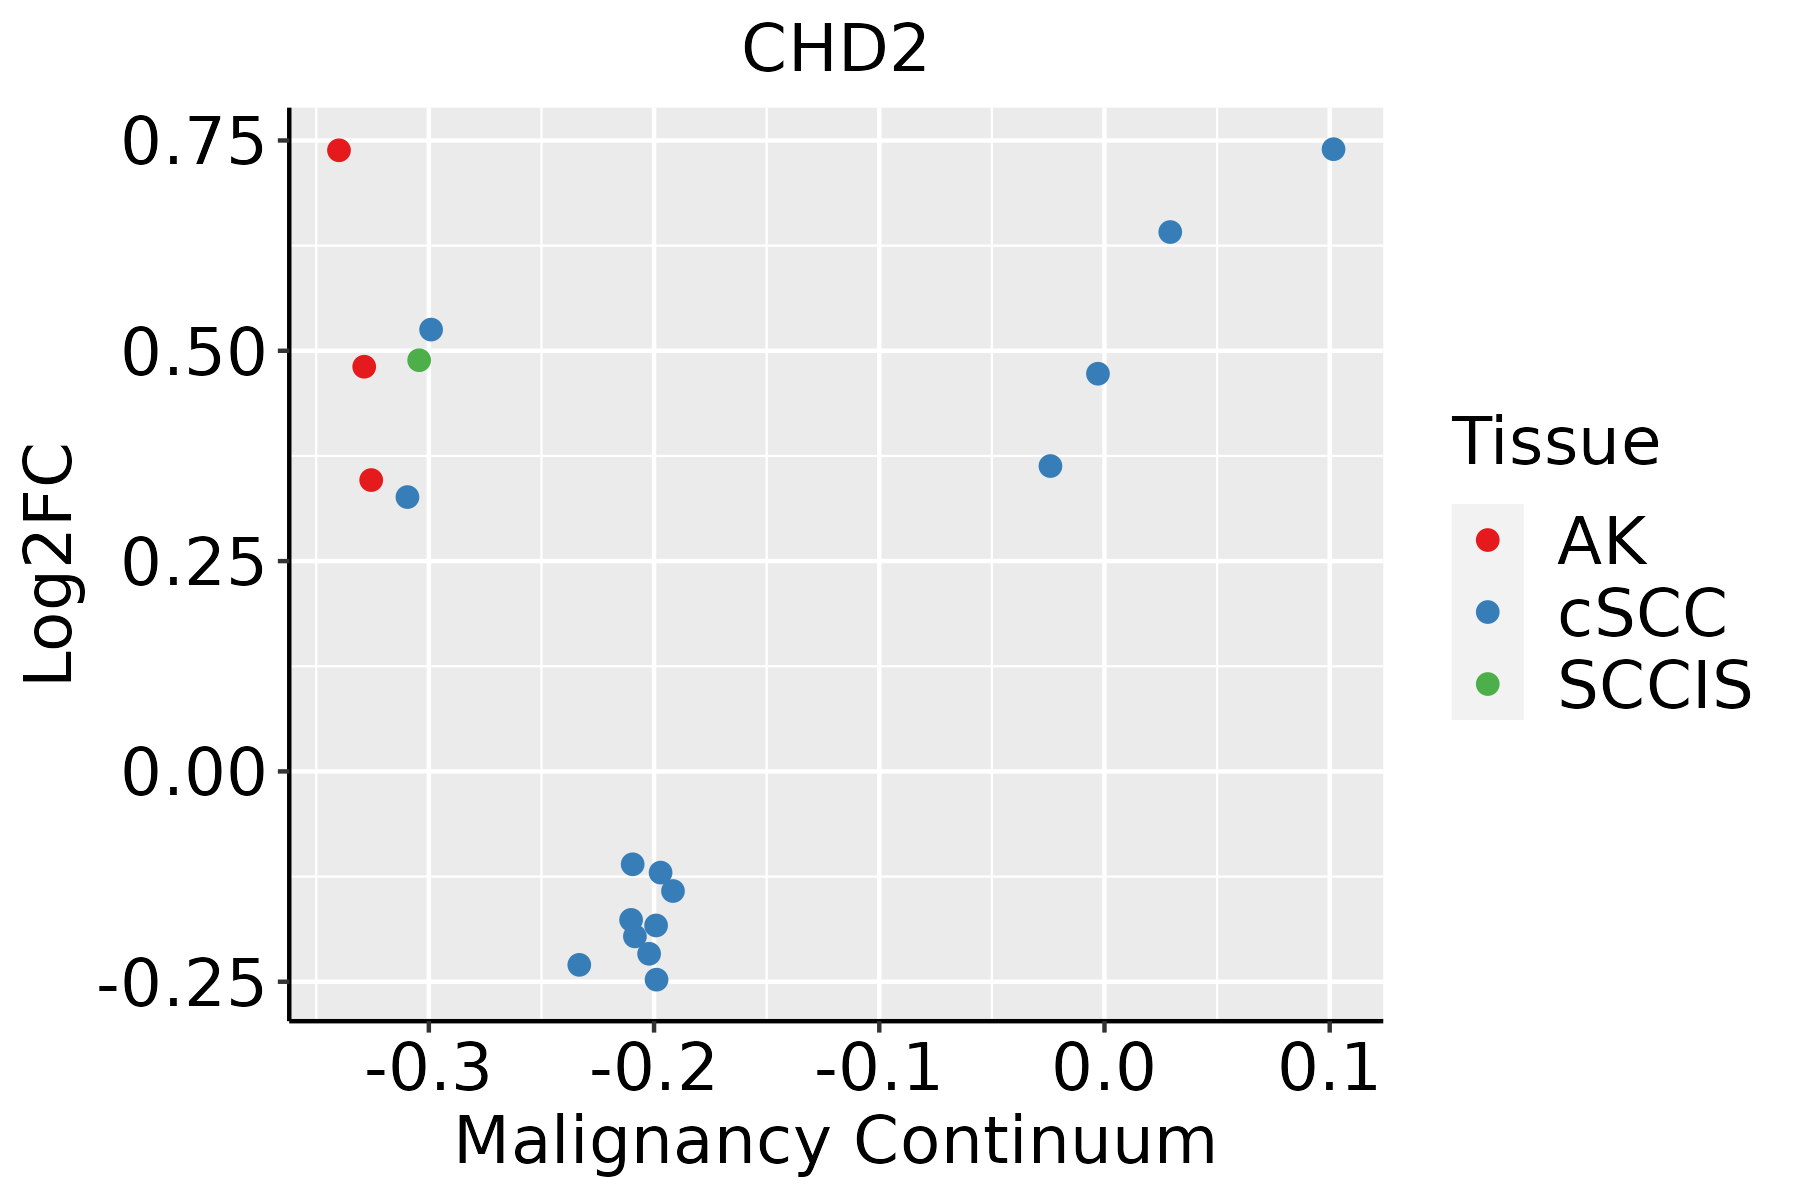 | AK: Actinic keratosis |
| cSCC: Cutaneous squamous cell carcinoma | ||
| SCCIS:squamous cell carcinoma in situ | ||
| Thyroid | 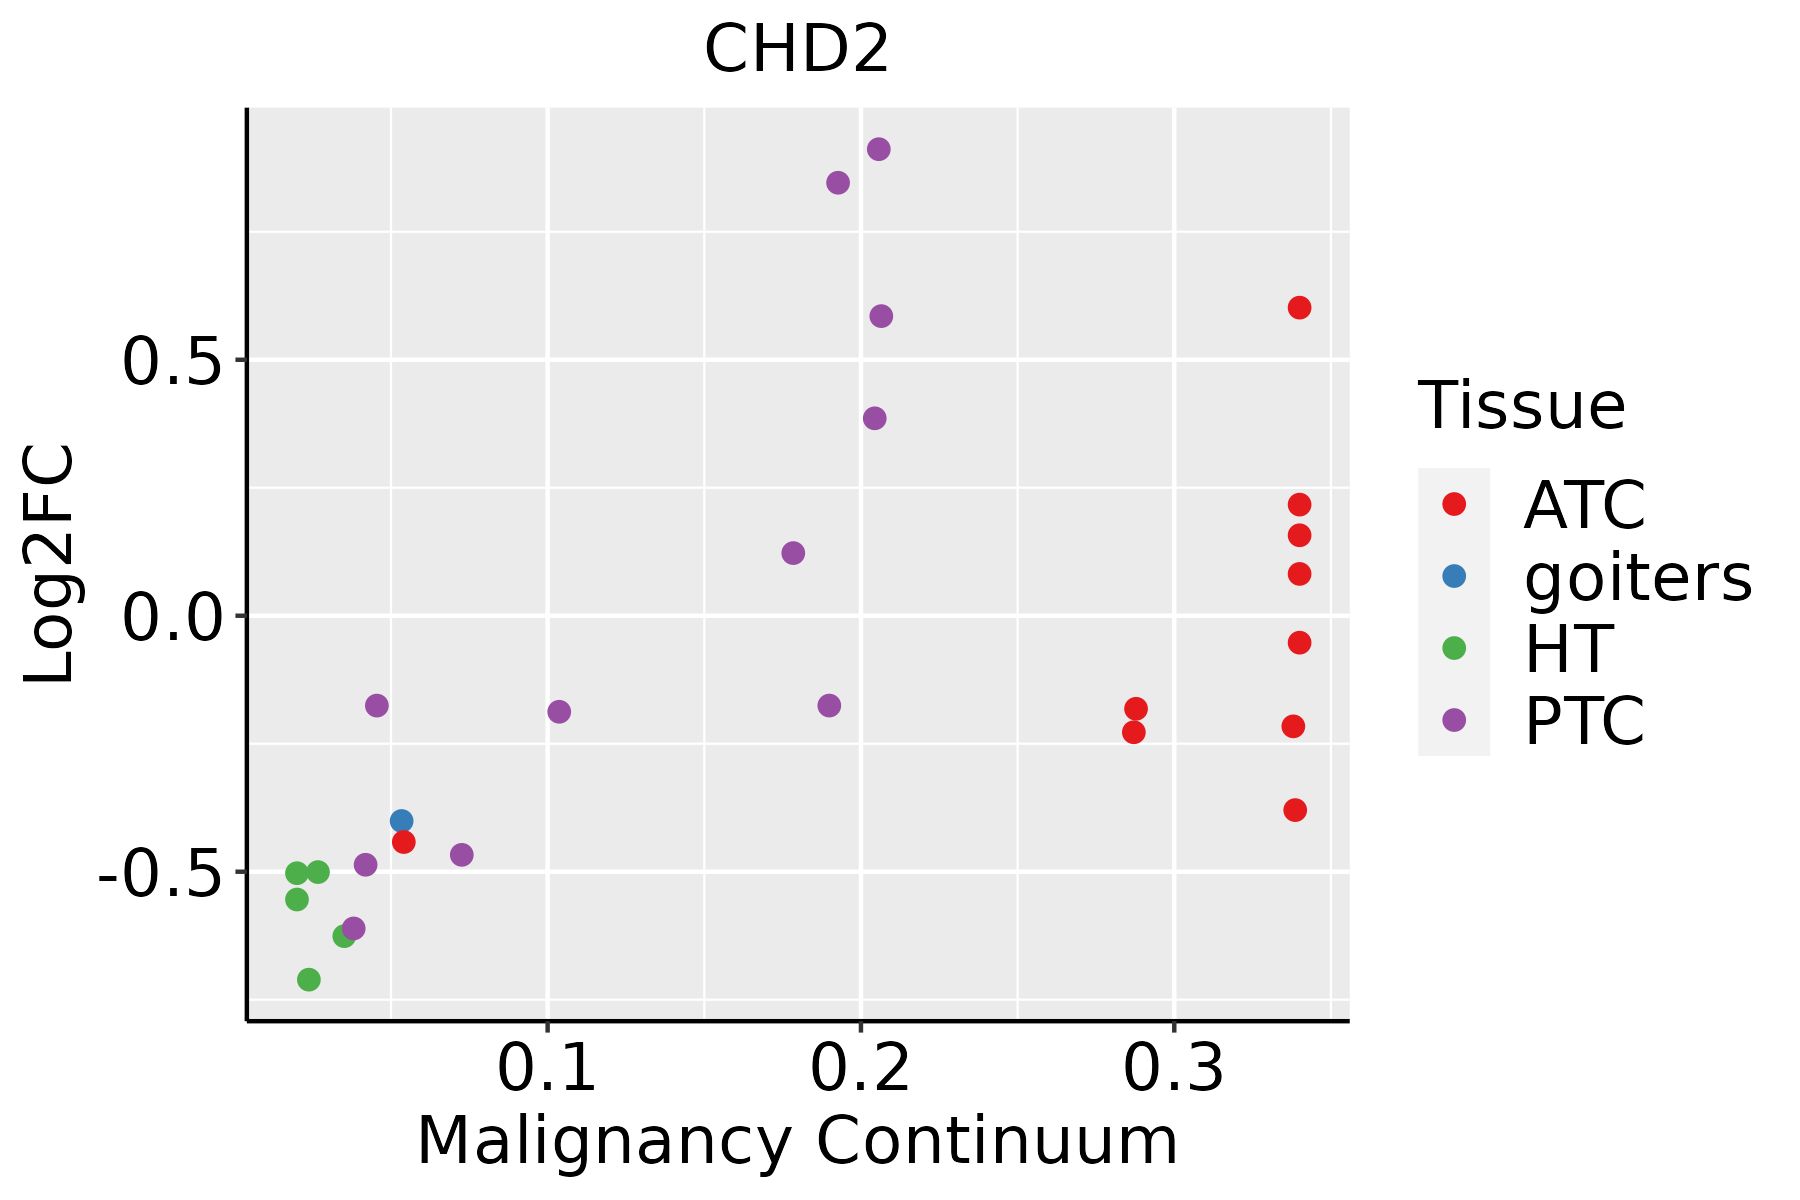 | ATC: Anaplastic thyroid cancer |
| HT: Hashimoto's thyroiditis | ||
| PTC: Papillary thyroid cancer |
| ∗log2FC in expression of this searched gene in stem-like cells from each diseased tissue sample relative to stem-like cells in normal samples in each tissue plotted against the malignancy continuum. Samples are colored based on if they are from different disease stage. |
Top |
Malignant transformation related pathway analysis |
| Find out the enriched GO biological processes and KEGG pathways involved in transition from healthy to precancer to cancer |
| Tissue | Disease Stage | Enriched GO biological Processes |
| Colorectum | AD |  |
| Colorectum | SER |  |
| Colorectum | MSS |  |
| Colorectum | MSI-H |  |
| Colorectum | FAP |  |
| ∗Top 15 enriched GO BP terms are showed in the bar plot of each disease state in each tissue. Each row represents a significant GO biological process which is colored according to the -log10(p.adjust). |
| Page: 1 2 3 4 5 6 7 8 9 |
| GO ID | Tissue | Disease Stage | Description | Gene Ratio | Bg Ratio | pvalue | p.adjust | Count |
| GO:003629317 | Prostate | BPH | response to decreased oxygen levels | 96/3107 | 322/18723 | 2.03e-09 | 8.26e-08 | 96 |
| GO:000166617 | Prostate | BPH | response to hypoxia | 92/3107 | 307/18723 | 3.29e-09 | 1.27e-07 | 92 |
| GO:007145315 | Prostate | BPH | cellular response to oxygen levels | 56/3107 | 177/18723 | 5.50e-07 | 1.09e-05 | 56 |
| GO:004346710 | Prostate | BPH | regulation of generation of precursor metabolites and energy | 44/3107 | 130/18723 | 1.16e-06 | 2.07e-05 | 44 |
| GO:003629415 | Prostate | BPH | cellular response to decreased oxygen levels | 51/3107 | 161/18723 | 1.66e-06 | 2.79e-05 | 51 |
| GO:00714568 | Prostate | BPH | cellular response to hypoxia | 47/3107 | 151/18723 | 7.09e-06 | 1.02e-04 | 47 |
| GO:00063259 | Prostate | BPH | chromatin organization | 101/3107 | 409/18723 | 1.52e-05 | 1.94e-04 | 101 |
| GO:00488636 | Prostate | BPH | stem cell differentiation | 55/3107 | 206/18723 | 1.56e-04 | 1.36e-03 | 55 |
| GO:00022444 | Prostate | BPH | hematopoietic progenitor cell differentiation | 34/3107 | 114/18723 | 3.08e-04 | 2.37e-03 | 34 |
| GO:00602183 | Prostate | BPH | hematopoietic stem cell differentiation | 12/3107 | 30/18723 | 1.94e-03 | 1.10e-02 | 12 |
| GO:00323924 | Prostate | BPH | DNA geometric change | 26/3107 | 90/18723 | 2.46e-03 | 1.33e-02 | 26 |
| GO:00325082 | Prostate | BPH | DNA duplex unwinding | 24/3107 | 84/18723 | 4.13e-03 | 2.04e-02 | 24 |
| GO:00075175 | Prostate | BPH | muscle organ development | 71/3107 | 327/18723 | 9.00e-03 | 3.84e-02 | 71 |
| GO:004603419 | Prostate | Tumor | ATP metabolic process | 122/3246 | 277/18723 | 1.71e-25 | 5.33e-22 | 122 |
| GO:000611918 | Prostate | Tumor | oxidative phosphorylation | 77/3246 | 141/18723 | 9.55e-24 | 1.98e-20 | 77 |
| GO:000906017 | Prostate | Tumor | aerobic respiration | 87/3246 | 189/18723 | 4.34e-20 | 3.37e-17 | 87 |
| GO:000609117 | Prostate | Tumor | generation of precursor metabolites and energy | 166/3246 | 490/18723 | 2.38e-19 | 1.23e-16 | 166 |
| GO:004277317 | Prostate | Tumor | ATP synthesis coupled electron transport | 55/3246 | 95/18723 | 6.10e-19 | 2.53e-16 | 55 |
| GO:004277517 | Prostate | Tumor | mitochondrial ATP synthesis coupled electron transport | 55/3246 | 95/18723 | 6.10e-19 | 2.53e-16 | 55 |
| GO:002290417 | Prostate | Tumor | respiratory electron transport chain | 59/3246 | 114/18723 | 4.78e-17 | 1.29e-14 | 59 |
| Page: 1 2 3 4 5 6 7 8 9 10 11 12 13 14 15 16 17 18 19 20 21 22 23 24 25 26 27 28 29 30 31 |
| Pathway ID | Tissue | Disease Stage | Description | Gene Ratio | Bg Ratio | pvalue | p.adjust | qvalue | Count |
| Page: 1 |
Top |
Cell-cell communication analysis |
| Identification of potential cell-cell interactions between two cell types and their ligand-receptor pairs for different disease states |
| Ligand | Receptor | LRpair | Pathway | Tissue | Disease Stage |
| Page: 1 |
Top |
Single-cell gene regulatory network inference analysis |
| Find out the significant the regulons (TFs) and the target genes of each regulon across cell types for different disease states |
| TF | Cell Type | Tissue | Disease Stage | Target Gene | RSS | Regulon Activity |
| CHD2 | CD8TCM | Oral cavity | ADJ | PTPRC,RACK1,ELF1, etc. | 3.91e-01 |  |
| CHD2 | DUCT1 | Pancreas | Healthy | RRBP1,RBM25,LUC7L3, etc. | 4.22e-01 |  |
| CHD2 | CD8TRM | Pancreas | PDAC | LINC01578,HNRNPC,SIK3, etc. | 1.74e-01 |  |
| ∗The dot plots of a searched regulon are shown for all cell subpopulations in each disease state of each tissue based on the regulon specific score inferred using pySCENIC and by calculating the average expression. |
| Page: 1 |
Top |
Somatic mutation of malignant transformation related genes |
| Annotation of somatic variants for genes involved in malignant transformation |
| Hugo Symbol | Variant Class | Variant Classification | dbSNP RS | HGVSc | HGVSp | HGVSp Short | SWISSPROT | BIOTYPE | SIFT | PolyPhen | Tumor Sample Barcode | Tissue | Histology | Sex | Age | Stage | Therapy Types | Drugs | Outcome |
| CHD2 | SNV | Missense_Mutation | novel | c.4091N>T | p.Ser1364Leu | p.S1364L | O14647 | protein_coding | tolerated(0.06) | benign(0.04) | TCGA-5L-AAT1-01 | Breast | breast invasive carcinoma | Female | <65 | III/IV | Hormone Therapy | letrozol | SD |
| CHD2 | SNV | Missense_Mutation | novel | c.2893N>G | p.Lys965Glu | p.K965E | O14647 | protein_coding | deleterious(0) | probably_damaging(0.952) | TCGA-A2-A3Y0-01 | Breast | breast invasive carcinoma | Female | <65 | I/II | Chemotherapy | adriamycin | CR |
| CHD2 | SNV | Missense_Mutation | rs769085842 | c.5329C>G | p.Leu1777Val | p.L1777V | O14647 | protein_coding | tolerated_low_confidence(0.11) | benign(0.001) | TCGA-AC-A23H-01 | Breast | breast invasive carcinoma | Female | >=65 | I/II | Unknown | Unknown | PD |
| CHD2 | SNV | Missense_Mutation | novel | c.362G>A | p.Arg121Gln | p.R121Q | O14647 | protein_coding | deleterious(0.03) | probably_damaging(0.978) | TCGA-AN-A046-01 | Breast | breast invasive carcinoma | Female | >=65 | I/II | Unknown | Unknown | SD |
| CHD2 | SNV | Missense_Mutation | novel | c.1696G>A | p.Gly566Ser | p.G566S | O14647 | protein_coding | deleterious(0.03) | probably_damaging(1) | TCGA-AN-A046-01 | Breast | breast invasive carcinoma | Female | >=65 | I/II | Unknown | Unknown | SD |
| CHD2 | SNV | Missense_Mutation | c.2855A>G | p.Glu952Gly | p.E952G | O14647 | protein_coding | tolerated(0.07) | benign(0.01) | TCGA-AN-A0AS-01 | Breast | breast invasive carcinoma | Female | >=65 | III/IV | Unknown | Unknown | SD | |
| CHD2 | SNV | Missense_Mutation | novel | c.569N>A | p.Arg190His | p.R190H | O14647 | protein_coding | tolerated(0.06) | benign(0.026) | TCGA-AO-A128-01 | Breast | breast invasive carcinoma | Female | <65 | I/II | Chemotherapy | doxorubicin | SD |
| CHD2 | SNV | Missense_Mutation | novel | c.2125N>T | p.Leu709Phe | p.L709F | O14647 | protein_coding | deleterious(0) | probably_damaging(0.99) | TCGA-BH-A2L8-01 | Breast | breast invasive carcinoma | Female | <65 | I/II | Chemotherapy | cytoxan | CR |
| CHD2 | SNV | Missense_Mutation | rs748103788 | c.3752G>A | p.Arg1251His | p.R1251H | O14647 | protein_coding | tolerated(0.74) | benign(0.007) | TCGA-D8-A1JL-01 | Breast | breast invasive carcinoma | Female | >=65 | I/II | Unknown | Unknown | SD |
| CHD2 | SNV | Missense_Mutation | novel | c.5372N>T | p.Pro1791Leu | p.P1791L | O14647 | protein_coding | tolerated_low_confidence(0.23) | benign(0.003) | TCGA-LL-A441-01 | Breast | breast invasive carcinoma | Female | <65 | I/II | Chemotherapy | taxotere | CR |
| Page: 1 2 3 4 5 6 7 8 9 10 11 12 13 14 15 16 17 18 19 20 |
Top |
Related drugs of malignant transformation related genes |
| Identification of chemicals and drugs interact with genes involved in malignant transfromation |
| (DGIdb 4.0) |
| Entrez ID | Symbol | Category | Interaction Types | Drug Claim Name | Drug Name | PMIDs |
| Page: 1 |

Copyright 2023-Present -The University of Texas Health Science Center at Houston |