
|
|||||
|
 | |
| |
| |
| |
| |
| |
|
Gene: ANKRD1 |
Gene summary for ANKRD1 |
| Gene information | Species | Human | Gene symbol | ANKRD1 | Gene ID | 27063 |
| Gene name | ankyrin repeat domain 1 | |
| Gene Alias | ALRP | |
| Cytomap | 10q23.31 | |
| Gene Type | protein-coding | GO ID | GO:0000122 | UniProtAcc | Q15327 |
Top |
Malignant transformation analysis |
| Identification of the aberrant gene expression in precancerous and cancerous lesions by comparing the gene expression of stem-like cells in diseased tissues with normal stem cells |
| Entrez ID | Symbol | Replicates | Species | Organ | Tissue | Adj P-value | Log2FC | Malignancy |
| 27063 | ANKRD1 | HCC2 | Human | Liver | HCC | 2.61e-10 | 6.28e+00 | 0.5341 |
| 27063 | ANKRD1 | Pt13.b | Human | Liver | HCC | 4.60e-12 | 4.61e-01 | 0.0251 |
| 27063 | ANKRD1 | S028 | Human | Liver | HCC | 1.18e-08 | 8.34e-01 | 0.2503 |
| 27063 | ANKRD1 | S029 | Human | Liver | HCC | 2.71e-05 | 6.83e-01 | 0.2581 |
| 27063 | ANKRD1 | ATC11 | Human | Thyroid | ATC | 3.71e-05 | 2.00e+00 | 0.3386 |
| 27063 | ANKRD1 | ATC2 | Human | Thyroid | ATC | 2.02e-16 | 2.27e+00 | 0.34 |
| 27063 | ANKRD1 | ATC3 | Human | Thyroid | ATC | 4.34e-11 | 1.96e+00 | 0.338 |
| Page: 1 |
| Tissue | Expression Dynamics | Abbreviation |
| Liver | 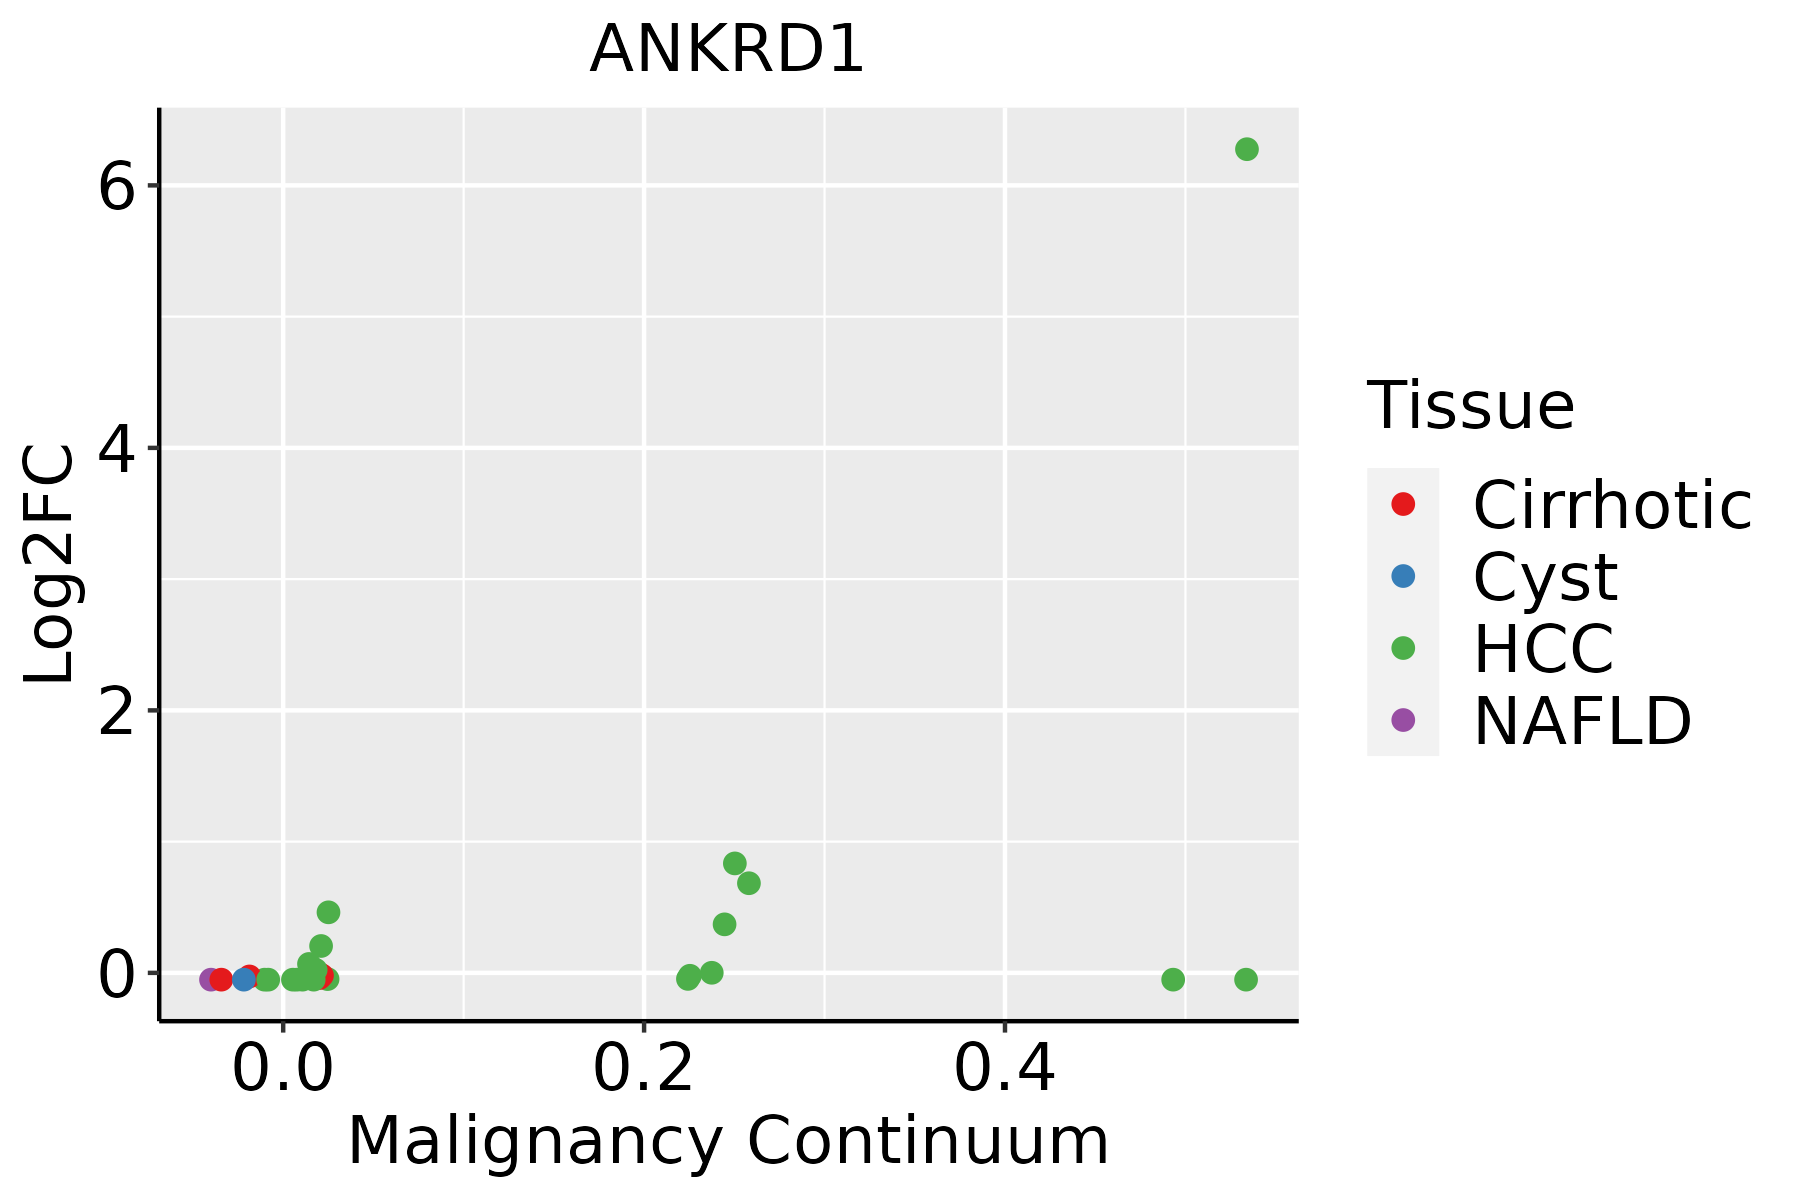 | HCC: Hepatocellular carcinoma |
| NAFLD: Non-alcoholic fatty liver disease | ||
| Thyroid |  | ATC: Anaplastic thyroid cancer |
| HT: Hashimoto's thyroiditis | ||
| PTC: Papillary thyroid cancer |
| ∗log2FC in expression of this searched gene in stem-like cells from each diseased tissue sample relative to stem-like cells in normal samples in each tissue plotted against the malignancy continuum. Samples are colored based on if they are from different disease stage. |
Top |
Malignant transformation related pathway analysis |
| Find out the enriched GO biological processes and KEGG pathways involved in transition from healthy to precancer to cancer |
| Tissue | Disease Stage | Enriched GO biological Processes |
| Colorectum | AD |  |
| Colorectum | SER |  |
| Colorectum | MSS |  |
| Colorectum | MSI-H |  |
| Colorectum | FAP |  |
| ∗Top 15 enriched GO BP terms are showed in the bar plot of each disease state in each tissue. Each row represents a significant GO biological process which is colored according to the -log10(p.adjust). |
| Page: 1 2 3 4 5 6 7 8 9 |
| GO ID | Tissue | Disease Stage | Description | Gene Ratio | Bg Ratio | pvalue | p.adjust | Count |
| GO:00431239 | Prostate | BPH | positive regulation of I-kappaB kinase/NF-kappaB signaling | 54/3107 | 186/18723 | 1.50e-05 | 1.92e-04 | 54 |
| GO:20000454 | Prostate | BPH | regulation of G1/S transition of mitotic cell cycle | 44/3107 | 142/18723 | 1.55e-05 | 1.96e-04 | 44 |
| GO:00457878 | Prostate | BPH | positive regulation of cell cycle | 81/3107 | 313/18723 | 1.76e-05 | 2.18e-04 | 81 |
| GO:19019904 | Prostate | BPH | regulation of mitotic cell cycle phase transition | 77/3107 | 299/18723 | 3.36e-05 | 3.77e-04 | 77 |
| GO:00426926 | Prostate | BPH | muscle cell differentiation | 88/3107 | 384/18723 | 7.59e-04 | 5.01e-03 | 88 |
| GO:19019894 | Prostate | BPH | positive regulation of cell cycle phase transition | 33/3107 | 115/18723 | 7.98e-04 | 5.23e-03 | 33 |
| GO:19019874 | Prostate | BPH | regulation of cell cycle phase transition | 89/3107 | 390/18723 | 8.17e-04 | 5.34e-03 | 89 |
| GO:19019923 | Prostate | BPH | positive regulation of mitotic cell cycle phase transition | 28/3107 | 93/18723 | 8.54e-04 | 5.53e-03 | 28 |
| GO:00900687 | Prostate | BPH | positive regulation of cell cycle process | 58/3107 | 236/18723 | 1.03e-03 | 6.46e-03 | 58 |
| GO:00622086 | Prostate | BPH | positive regulation of pattern recognition receptor signaling pathway | 15/3107 | 44/18723 | 3.59e-03 | 1.83e-02 | 15 |
| GO:00985865 | Prostate | BPH | cellular response to virus | 23/3107 | 84/18723 | 8.59e-03 | 3.68e-02 | 23 |
| GO:19028081 | Prostate | BPH | positive regulation of cell cycle G1/S phase transition | 17/3107 | 58/18723 | 1.11e-02 | 4.54e-02 | 17 |
| GO:003052217 | Prostate | Tumor | intracellular receptor signaling pathway | 81/3246 | 265/18723 | 7.65e-08 | 2.14e-06 | 81 |
| GO:000961514 | Prostate | Tumor | response to virus | 101/3246 | 367/18723 | 6.40e-07 | 1.32e-05 | 101 |
| GO:000724916 | Prostate | Tumor | I-kappaB kinase/NF-kappaB signaling | 77/3246 | 281/18723 | 1.55e-05 | 2.09e-04 | 77 |
| GO:000008212 | Prostate | Tumor | G1/S transition of mitotic cell cycle | 62/3246 | 214/18723 | 1.63e-05 | 2.18e-04 | 62 |
| GO:004312217 | Prostate | Tumor | regulation of I-kappaB kinase/NF-kappaB signaling | 69/3246 | 249/18723 | 2.83e-05 | 3.43e-04 | 69 |
| GO:004484312 | Prostate | Tumor | cell cycle G1/S phase transition | 67/3246 | 241/18723 | 3.28e-05 | 3.88e-04 | 67 |
| GO:000734613 | Prostate | Tumor | regulation of mitotic cell cycle | 113/3246 | 457/18723 | 3.37e-05 | 3.96e-04 | 113 |
| GO:004477214 | Prostate | Tumor | mitotic cell cycle phase transition | 106/3246 | 424/18723 | 3.61e-05 | 4.21e-04 | 106 |
| Page: 1 2 3 4 5 6 7 8 9 10 11 12 13 14 15 16 17 18 19 20 21 22 23 24 25 26 27 28 29 30 31 32 33 34 35 36 37 |
| Pathway ID | Tissue | Disease Stage | Description | Gene Ratio | Bg Ratio | pvalue | p.adjust | qvalue | Count |
| Page: 1 |
Top |
Cell-cell communication analysis |
| Identification of potential cell-cell interactions between two cell types and their ligand-receptor pairs for different disease states |
| Ligand | Receptor | LRpair | Pathway | Tissue | Disease Stage |
| Page: 1 |
Top |
Single-cell gene regulatory network inference analysis |
| Find out the significant the regulons (TFs) and the target genes of each regulon across cell types for different disease states |
| TF | Cell Type | Tissue | Disease Stage | Target Gene | RSS | Regulon Activity |
| ∗The dot plots of a searched regulon are shown for all cell subpopulations in each disease state of each tissue based on the regulon specific score inferred using pySCENIC and by calculating the average expression. |
| Page: 1 |
Top |
Somatic mutation of malignant transformation related genes |
| Annotation of somatic variants for genes involved in malignant transformation |
| Hugo Symbol | Variant Class | Variant Classification | dbSNP RS | HGVSc | HGVSp | HGVSp Short | SWISSPROT | BIOTYPE | SIFT | PolyPhen | Tumor Sample Barcode | Tissue | Histology | Sex | Age | Stage | Therapy Types | Drugs | Outcome |
| ANKRD1 | SNV | Missense_Mutation | c.941C>G | p.Ser314Cys | p.S314C | Q15327 | protein_coding | deleterious(0.03) | possibly_damaging(0.533) | TCGA-AC-A23H-01 | Breast | breast invasive carcinoma | Female | >=65 | I/II | Unknown | Unknown | PD | |
| ANKRD1 | SNV | Missense_Mutation | c.817A>T | p.Met273Leu | p.M273L | Q15327 | protein_coding | tolerated(1) | benign(0) | TCGA-AC-A2FB-01 | Breast | breast invasive carcinoma | Female | >=65 | I/II | Chemotherapy | taxotere | CR | |
| ANKRD1 | SNV | Missense_Mutation | c.646N>A | p.Asp216Asn | p.D216N | Q15327 | protein_coding | deleterious(0) | probably_damaging(0.923) | TCGA-EK-A2H0-01 | Cervix | cervical & endocervical cancer | Female | <65 | I/II | Chemotherapy | cisplatin | CR | |
| ANKRD1 | SNV | Missense_Mutation | c.646G>A | p.Asp216Asn | p.D216N | Q15327 | protein_coding | deleterious(0) | probably_damaging(0.923) | TCGA-ZJ-A8QQ-01 | Cervix | cervical & endocervical cancer | Female | <65 | I/II | Chemotherapy | cisplatin | SD | |
| ANKRD1 | SNV | Missense_Mutation | novel | c.129N>T | p.Glu43Asp | p.E43D | Q15327 | protein_coding | tolerated(0.74) | benign(0) | TCGA-A6-6141-01 | Colorectum | colon adenocarcinoma | Male | <65 | I/II | Chemotherapy | 5-fu | SD |
| ANKRD1 | SNV | Missense_Mutation | rs759544911 | c.796N>G | p.Lys266Glu | p.K266E | Q15327 | protein_coding | deleterious(0.04) | probably_damaging(0.958) | TCGA-AA-3977-01 | Colorectum | colon adenocarcinoma | Male | >=65 | I/II | Unknown | Unknown | SD |
| ANKRD1 | SNV | Missense_Mutation | c.646N>T | p.Asp216Tyr | p.D216Y | Q15327 | protein_coding | deleterious(0) | probably_damaging(0.986) | TCGA-AA-A010-01 | Colorectum | colon adenocarcinoma | Female | <65 | I/II | Chemotherapy | folinic | CR | |
| ANKRD1 | SNV | Missense_Mutation | c.96N>T | p.Glu32Asp | p.E32D | Q15327 | protein_coding | tolerated(0.09) | benign(0.003) | TCGA-AA-A010-01 | Colorectum | colon adenocarcinoma | Female | <65 | I/II | Chemotherapy | folinic | CR | |
| ANKRD1 | SNV | Missense_Mutation | rs730880050 | c.677N>T | p.Ala226Val | p.A226V | Q15327 | protein_coding | deleterious(0.01) | probably_damaging(0.924) | TCGA-CA-6717-01 | Colorectum | colon adenocarcinoma | Male | <65 | I/II | Chemotherapy | oxaliplatin | CR |
| ANKRD1 | SNV | Missense_Mutation | c.115N>G | p.Leu39Val | p.L39V | Q15327 | protein_coding | tolerated(0.27) | benign(0.045) | TCGA-F4-6854-01 | Colorectum | colon adenocarcinoma | Female | >=65 | I/II | Unknown | Unknown | SD |
| Page: 1 2 3 4 5 |
Top |
Related drugs of malignant transformation related genes |
| Identification of chemicals and drugs interact with genes involved in malignant transfromation |
| (DGIdb 4.0) |
| Entrez ID | Symbol | Category | Interaction Types | Drug Claim Name | Drug Name | PMIDs |
| Page: 1 |

Copyright 2023-Present -The University of Texas Health Science Center at Houston |