
|
|||||
|
 | |
| |
| |
| |
| |
| |
|
Gene: UBE2L3 |
Gene summary for UBE2L3 |
| Gene information | Species | Human | Gene symbol | UBE2L3 | Gene ID | 7332 |
| Gene name | ubiquitin conjugating enzyme E2 L3 | |
| Gene Alias | E2-F1 | |
| Cytomap | 22q11.21 | |
| Gene Type | protein-coding | GO ID | GO:0000209 | UniProtAcc | P68036 |
Top |
Malignant transformation analysis |
| Identification of the aberrant gene expression in precancerous and cancerous lesions by comparing the gene expression of stem-like cells in diseased tissues with normal stem cells |
| Entrez ID | Symbol | Replicates | Species | Organ | Tissue | Adj P-value | Log2FC | Malignancy |
| 7332 | UBE2L3 | GSM4909281 | Human | Breast | IDC | 1.72e-22 | 6.11e-01 | 0.21 |
| 7332 | UBE2L3 | GSM4909282 | Human | Breast | IDC | 3.19e-02 | 3.27e-01 | -0.0288 |
| 7332 | UBE2L3 | GSM4909285 | Human | Breast | IDC | 2.67e-10 | 4.19e-01 | 0.21 |
| 7332 | UBE2L3 | GSM4909288 | Human | Breast | IDC | 8.16e-05 | 4.25e-02 | 0.0988 |
| 7332 | UBE2L3 | GSM4909291 | Human | Breast | IDC | 1.88e-09 | 5.00e-01 | 0.1753 |
| 7332 | UBE2L3 | GSM4909294 | Human | Breast | IDC | 5.06e-04 | 1.51e-02 | 0.2022 |
| 7332 | UBE2L3 | GSM4909296 | Human | Breast | IDC | 7.18e-11 | 2.32e-02 | 0.1524 |
| 7332 | UBE2L3 | GSM4909297 | Human | Breast | IDC | 4.52e-18 | -1.36e-01 | 0.1517 |
| 7332 | UBE2L3 | GSM4909311 | Human | Breast | IDC | 5.23e-33 | -2.72e-01 | 0.1534 |
| 7332 | UBE2L3 | GSM4909312 | Human | Breast | IDC | 1.39e-12 | -9.81e-02 | 0.1552 |
| 7332 | UBE2L3 | GSM4909319 | Human | Breast | IDC | 7.93e-41 | -2.27e-01 | 0.1563 |
| 7332 | UBE2L3 | GSM4909320 | Human | Breast | IDC | 3.68e-04 | -1.79e-01 | 0.1575 |
| 7332 | UBE2L3 | GSM4909321 | Human | Breast | IDC | 2.52e-15 | 9.12e-03 | 0.1559 |
| 7332 | UBE2L3 | brca1 | Human | Breast | Precancer | 5.08e-24 | 6.84e-01 | -0.0338 |
| 7332 | UBE2L3 | brca2 | Human | Breast | Precancer | 6.84e-14 | 4.54e-01 | -0.024 |
| 7332 | UBE2L3 | brca3 | Human | Breast | Precancer | 2.99e-06 | 3.30e-01 | -0.0263 |
| 7332 | UBE2L3 | NCCBC14 | Human | Breast | DCIS | 2.87e-16 | 2.53e-01 | 0.2021 |
| 7332 | UBE2L3 | NCCBC2 | Human | Breast | DCIS | 4.22e-05 | 5.50e-02 | 0.1554 |
| 7332 | UBE2L3 | NCCBC5 | Human | Breast | DCIS | 7.48e-16 | 1.82e-01 | 0.2046 |
| 7332 | UBE2L3 | P1 | Human | Breast | IDC | 3.67e-17 | -2.21e-01 | 0.1527 |
| Page: 1 2 3 4 5 6 7 8 9 10 |
| Tissue | Expression Dynamics | Abbreviation |
| Breast | 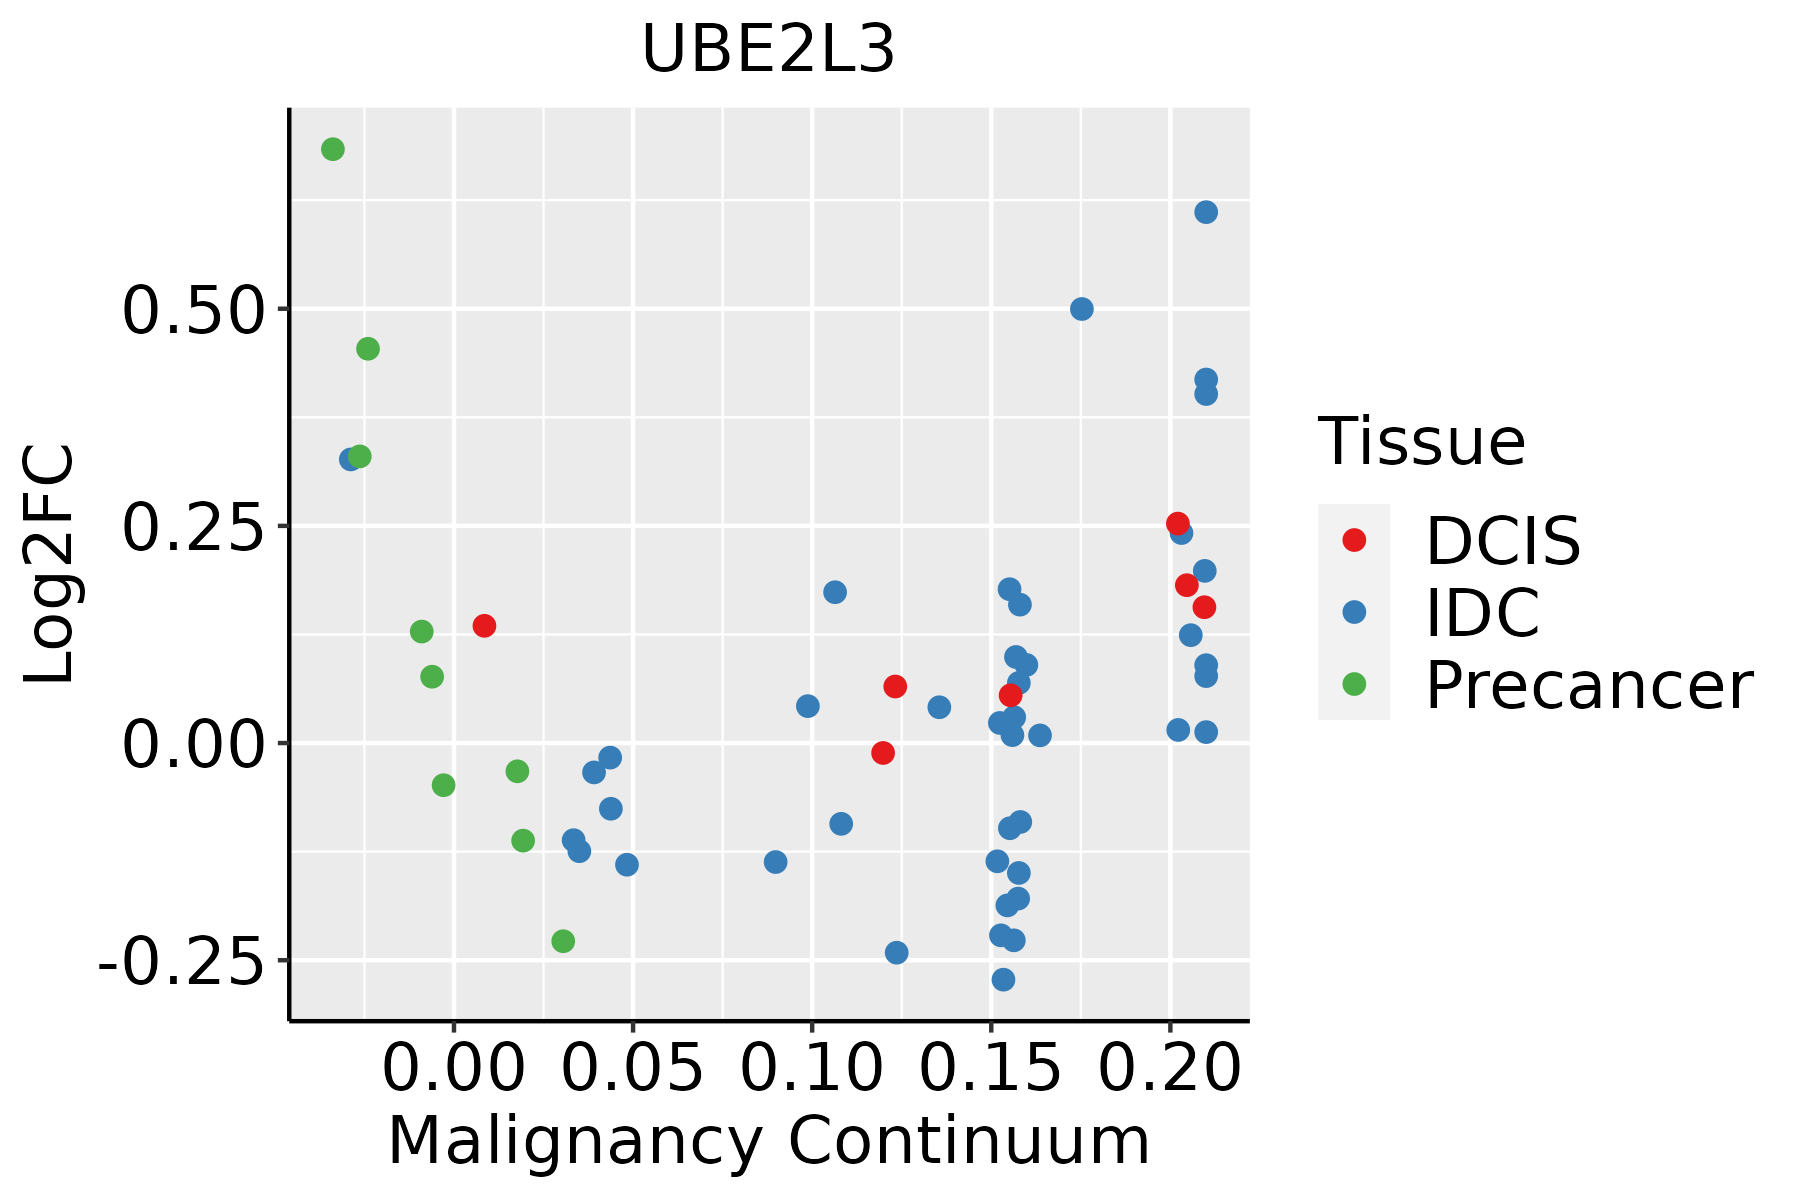 | IDC: Invasive ductal carcinoma |
| DCIS: Ductal carcinoma in situ | ||
| Precancer(BRCA1-mut): Precancerous lesion from BRCA1 mutation carriers | ||
| Colorectum (GSE201348) |  | FAP: Familial adenomatous polyposis |
| CRC: Colorectal cancer | ||
| Colorectum (HTA11) |  | AD: Adenomas |
| SER: Sessile serrated lesions | ||
| MSI-H: Microsatellite-high colorectal cancer | ||
| MSS: Microsatellite stable colorectal cancer | ||
| Esophagus | 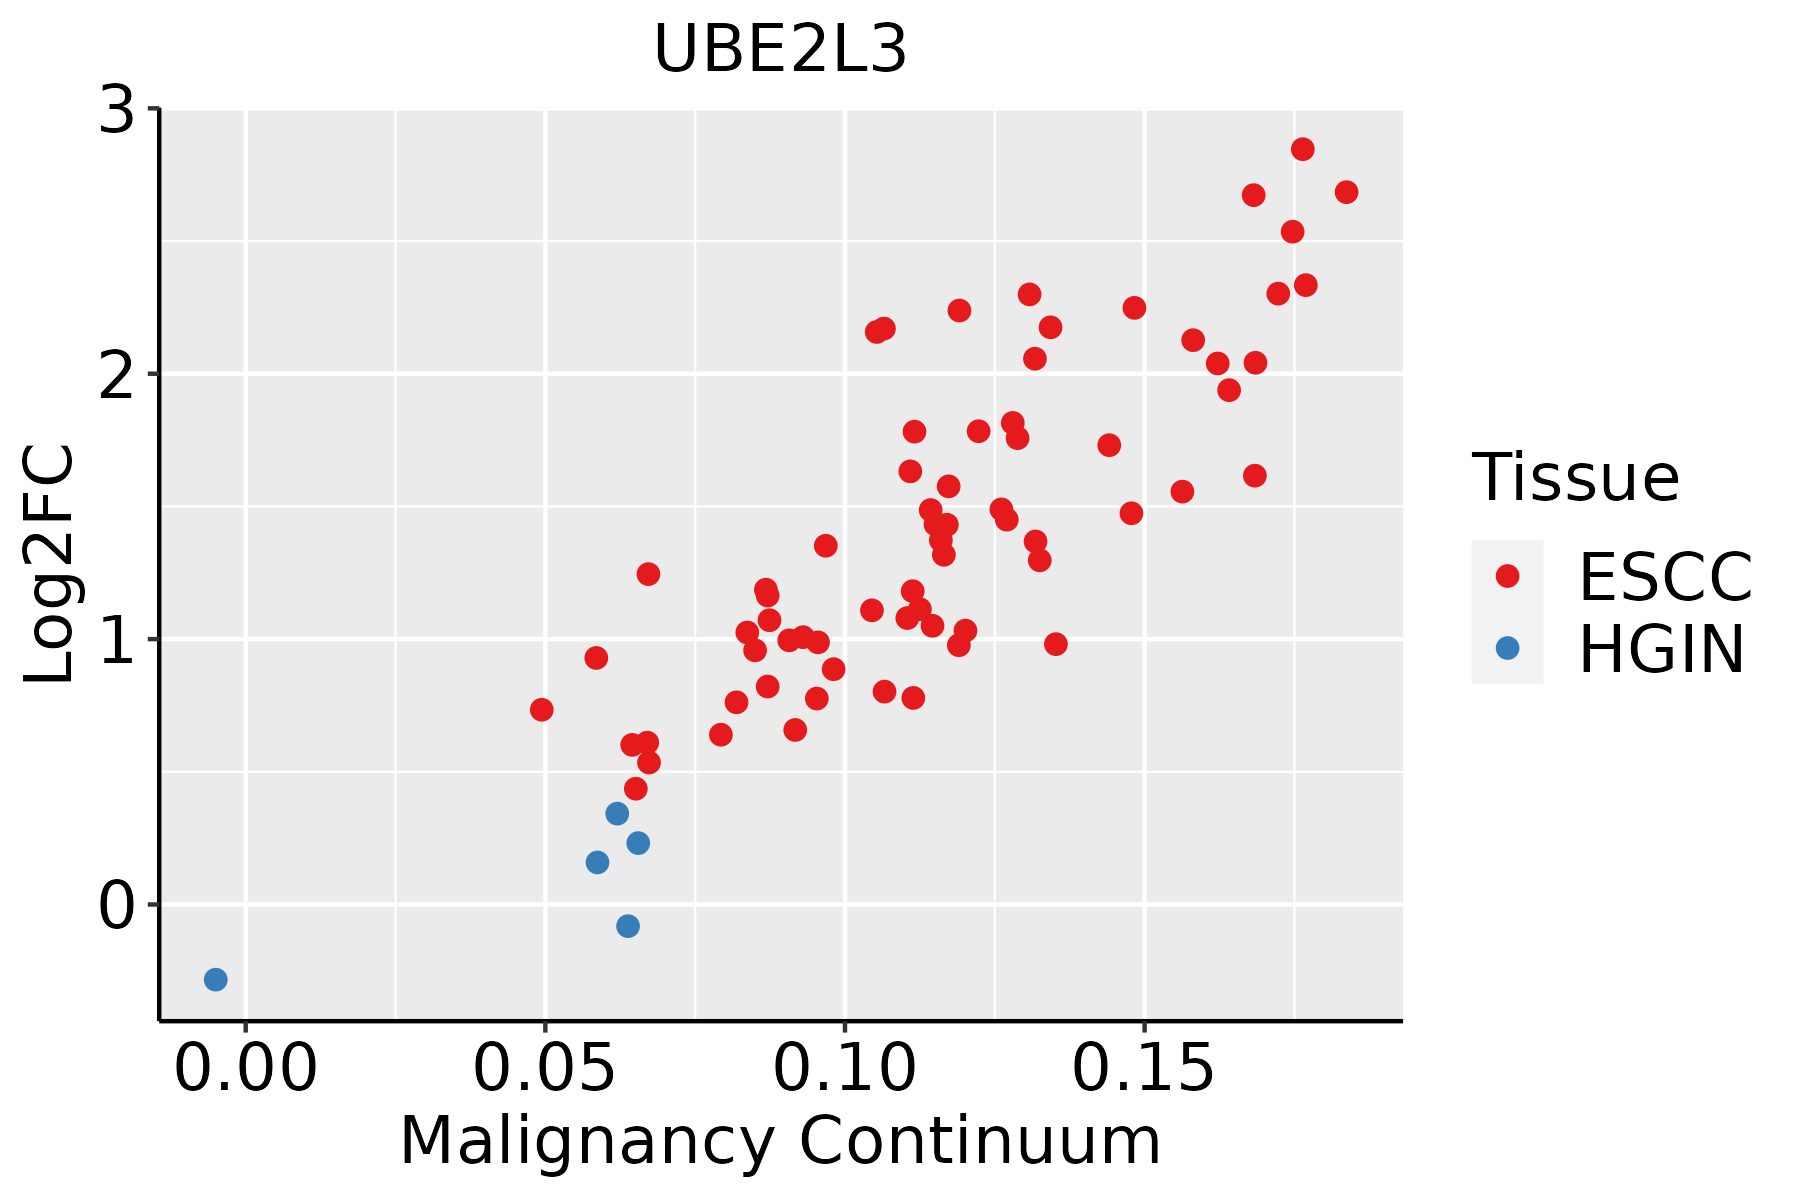 | ESCC: Esophageal squamous cell carcinoma |
| HGIN: High-grade intraepithelial neoplasias | ||
| LGIN: Low-grade intraepithelial neoplasias | ||
| Liver | 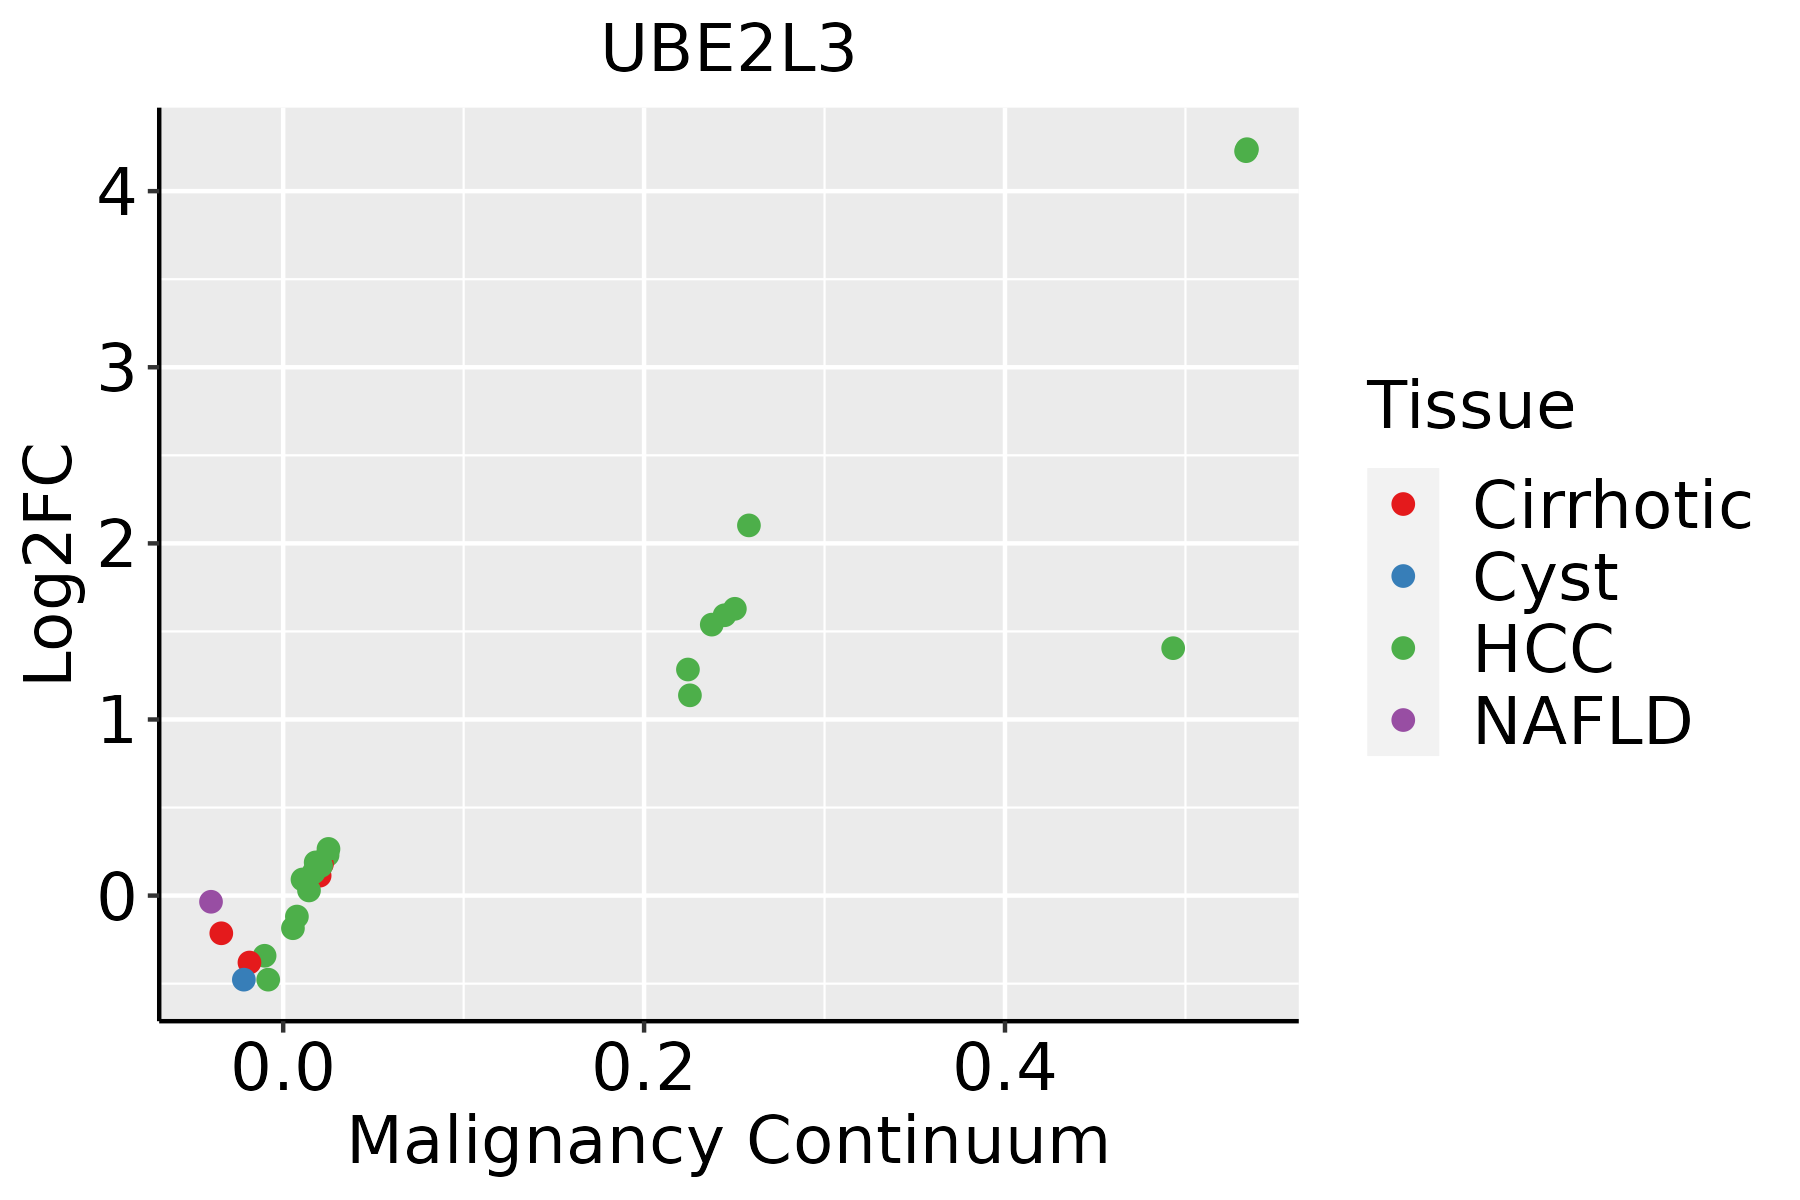 | HCC: Hepatocellular carcinoma |
| NAFLD: Non-alcoholic fatty liver disease | ||
| Oral Cavity |  | EOLP: Erosive Oral lichen planus |
| LP: leukoplakia | ||
| NEOLP: Non-erosive oral lichen planus | ||
| OSCC: Oral squamous cell carcinoma | ||
| Prostate | 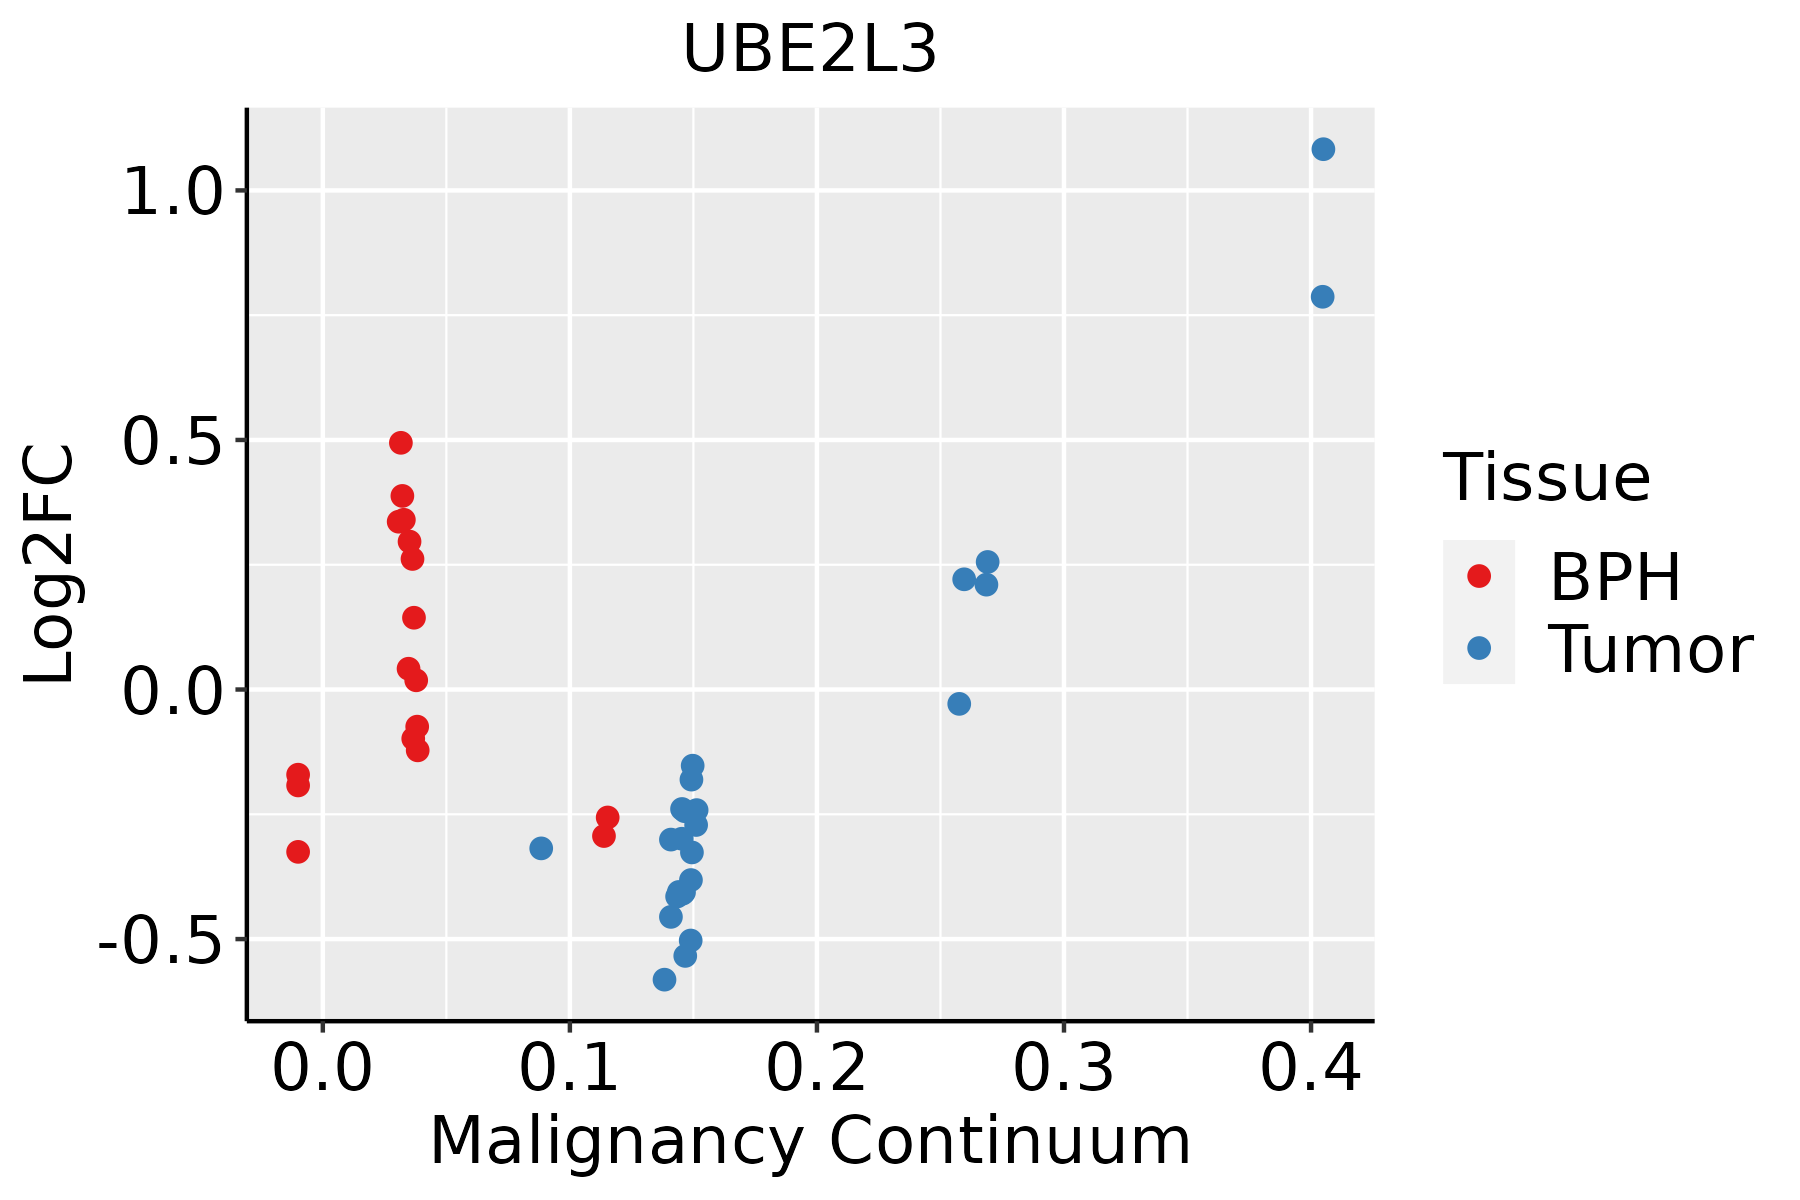 | BPH: Benign Prostatic Hyperplasia |
| Skin |  | AK: Actinic keratosis |
| cSCC: Cutaneous squamous cell carcinoma | ||
| SCCIS:squamous cell carcinoma in situ | ||
| Thyroid |  | ATC: Anaplastic thyroid cancer |
| HT: Hashimoto's thyroiditis | ||
| PTC: Papillary thyroid cancer |
| ∗log2FC in expression of this searched gene in stem-like cells from each diseased tissue sample relative to stem-like cells in normal samples in each tissue plotted against the malignancy continuum. Samples are colored based on if they are from different disease stage. |
Top |
Malignant transformation related pathway analysis |
| Find out the enriched GO biological processes and KEGG pathways involved in transition from healthy to precancer to cancer |
| Tissue | Disease Stage | Enriched GO biological Processes |
| Colorectum | AD |  |
| Colorectum | SER |  |
| Colorectum | MSS |  |
| Colorectum | MSI-H |  |
| Colorectum | FAP |  |
| ∗Top 15 enriched GO BP terms are showed in the bar plot of each disease state in each tissue. Each row represents a significant GO biological process which is colored according to the -log10(p.adjust). |
| Page: 1 2 3 4 5 6 7 8 9 |
| GO ID | Tissue | Disease Stage | Description | Gene Ratio | Bg Ratio | pvalue | p.adjust | Count |
| GO:0032388112 | Thyroid | PTC | positive regulation of intracellular transport | 132/5968 | 202/18723 | 1.10e-22 | 2.57e-20 | 132 |
| GO:0090316110 | Thyroid | PTC | positive regulation of intracellular protein transport | 109/5968 | 160/18723 | 4.20e-21 | 7.79e-19 | 109 |
| GO:1903320113 | Thyroid | PTC | regulation of protein modification by small protein conjugation or removal | 148/5968 | 242/18723 | 4.49e-21 | 8.10e-19 | 148 |
| GO:0006605113 | Thyroid | PTC | protein targeting | 180/5968 | 314/18723 | 6.81e-21 | 1.19e-18 | 180 |
| GO:1903829113 | Thyroid | PTC | positive regulation of cellular protein localization | 162/5968 | 276/18723 | 2.40e-20 | 3.52e-18 | 162 |
| GO:000683928 | Thyroid | PTC | mitochondrial transport | 150/5968 | 254/18723 | 2.76e-19 | 3.34e-17 | 150 |
| GO:0031396113 | Thyroid | PTC | regulation of protein ubiquitination | 128/5968 | 210/18723 | 3.06e-18 | 3.27e-16 | 128 |
| GO:1904951113 | Thyroid | PTC | positive regulation of establishment of protein localization | 175/5968 | 319/18723 | 1.10e-17 | 1.12e-15 | 175 |
| GO:0051222113 | Thyroid | PTC | positive regulation of protein transport | 163/5968 | 303/18723 | 1.58e-15 | 1.16e-13 | 163 |
| GO:0070585112 | Thyroid | PTC | protein localization to mitochondrion | 83/5968 | 125/18723 | 2.15e-15 | 1.56e-13 | 83 |
| GO:0072655112 | Thyroid | PTC | establishment of protein localization to mitochondrion | 80/5968 | 120/18723 | 4.87e-15 | 3.30e-13 | 80 |
| GO:0006626111 | Thyroid | PTC | protein targeting to mitochondrion | 67/5968 | 100/18723 | 5.55e-13 | 2.74e-11 | 67 |
| GO:000020920 | Thyroid | PTC | protein polyubiquitination | 128/5968 | 236/18723 | 7.81e-13 | 3.65e-11 | 128 |
| GO:190321416 | Thyroid | PTC | regulation of protein targeting to mitochondrion | 33/5968 | 44/18723 | 5.20e-09 | 1.34e-07 | 33 |
| GO:190374718 | Thyroid | PTC | regulation of establishment of protein localization to mitochondrion | 36/5968 | 50/18723 | 6.68e-09 | 1.70e-07 | 36 |
| GO:0048545113 | Thyroid | PTC | response to steroid hormone | 158/5968 | 339/18723 | 8.10e-09 | 2.00e-07 | 158 |
| GO:190353310 | Thyroid | PTC | regulation of protein targeting | 51/5968 | 81/18723 | 8.40e-09 | 2.07e-07 | 51 |
| GO:190332210 | Thyroid | PTC | positive regulation of protein modification by small protein conjugation or removal | 73/5968 | 138/18723 | 2.34e-07 | 4.11e-06 | 73 |
| GO:19039558 | Thyroid | PTC | positive regulation of protein targeting to mitochondrion | 24/5968 | 32/18723 | 6.76e-07 | 1.07e-05 | 24 |
| GO:190374910 | Thyroid | PTC | positive regulation of establishment of protein localization to mitochondrion | 26/5968 | 36/18723 | 7.90e-07 | 1.22e-05 | 26 |
| Page: 1 2 3 4 5 6 7 8 9 10 11 12 13 14 15 16 17 18 19 20 21 22 23 24 |
| Pathway ID | Tissue | Disease Stage | Description | Gene Ratio | Bg Ratio | pvalue | p.adjust | qvalue | Count |
| hsa0501218 | Breast | Precancer | Parkinson disease | 99/684 | 266/8465 | 3.58e-42 | 5.65e-40 | 4.33e-40 | 99 |
| hsa0502216 | Breast | Precancer | Pathways of neurodegeneration - multiple diseases | 112/684 | 476/8465 | 6.96e-27 | 2.44e-25 | 1.87e-25 | 112 |
| hsa0501219 | Breast | Precancer | Parkinson disease | 99/684 | 266/8465 | 3.58e-42 | 5.65e-40 | 4.33e-40 | 99 |
| hsa0502217 | Breast | Precancer | Pathways of neurodegeneration - multiple diseases | 112/684 | 476/8465 | 6.96e-27 | 2.44e-25 | 1.87e-25 | 112 |
| hsa0501224 | Breast | IDC | Parkinson disease | 107/867 | 266/8465 | 2.57e-39 | 8.36e-37 | 6.26e-37 | 107 |
| hsa0502223 | Breast | IDC | Pathways of neurodegeneration - multiple diseases | 116/867 | 476/8465 | 3.63e-20 | 1.18e-18 | 8.82e-19 | 116 |
| hsa0501234 | Breast | IDC | Parkinson disease | 107/867 | 266/8465 | 2.57e-39 | 8.36e-37 | 6.26e-37 | 107 |
| hsa0502233 | Breast | IDC | Pathways of neurodegeneration - multiple diseases | 116/867 | 476/8465 | 3.63e-20 | 1.18e-18 | 8.82e-19 | 116 |
| hsa0501243 | Breast | DCIS | Parkinson disease | 106/846 | 266/8465 | 1.64e-39 | 5.29e-37 | 3.90e-37 | 106 |
| hsa0502243 | Breast | DCIS | Pathways of neurodegeneration - multiple diseases | 114/846 | 476/8465 | 4.74e-20 | 1.53e-18 | 1.13e-18 | 114 |
| hsa0501253 | Breast | DCIS | Parkinson disease | 106/846 | 266/8465 | 1.64e-39 | 5.29e-37 | 3.90e-37 | 106 |
| hsa0502253 | Breast | DCIS | Pathways of neurodegeneration - multiple diseases | 114/846 | 476/8465 | 4.74e-20 | 1.53e-18 | 1.13e-18 | 114 |
| hsa05012 | Colorectum | AD | Parkinson disease | 147/2092 | 266/8465 | 2.53e-27 | 8.48e-25 | 5.41e-25 | 147 |
| hsa05022 | Colorectum | AD | Pathways of neurodegeneration - multiple diseases | 201/2092 | 476/8465 | 4.54e-18 | 1.27e-16 | 8.09e-17 | 201 |
| hsa04120 | Colorectum | AD | Ubiquitin mediated proteolysis | 58/2092 | 142/8465 | 1.46e-05 | 1.53e-04 | 9.76e-05 | 58 |
| hsa050121 | Colorectum | AD | Parkinson disease | 147/2092 | 266/8465 | 2.53e-27 | 8.48e-25 | 5.41e-25 | 147 |
| hsa050221 | Colorectum | AD | Pathways of neurodegeneration - multiple diseases | 201/2092 | 476/8465 | 4.54e-18 | 1.27e-16 | 8.09e-17 | 201 |
| hsa041201 | Colorectum | AD | Ubiquitin mediated proteolysis | 58/2092 | 142/8465 | 1.46e-05 | 1.53e-04 | 9.76e-05 | 58 |
| hsa050122 | Colorectum | SER | Parkinson disease | 132/1580 | 266/8465 | 2.72e-31 | 9.03e-29 | 6.55e-29 | 132 |
| hsa050222 | Colorectum | SER | Pathways of neurodegeneration - multiple diseases | 168/1580 | 476/8465 | 6.23e-19 | 2.07e-17 | 1.50e-17 | 168 |
| Page: 1 2 3 4 5 |
Top |
Cell-cell communication analysis |
| Identification of potential cell-cell interactions between two cell types and their ligand-receptor pairs for different disease states |
| Ligand | Receptor | LRpair | Pathway | Tissue | Disease Stage |
| Page: 1 |
Top |
Single-cell gene regulatory network inference analysis |
| Find out the significant the regulons (TFs) and the target genes of each regulon across cell types for different disease states |
| TF | Cell Type | Tissue | Disease Stage | Target Gene | RSS | Regulon Activity |
| ∗The dot plots of a searched regulon are shown for all cell subpopulations in each disease state of each tissue based on the regulon specific score inferred using pySCENIC and by calculating the average expression. |
| Page: 1 |
Top |
Somatic mutation of malignant transformation related genes |
| Annotation of somatic variants for genes involved in malignant transformation |
| Hugo Symbol | Variant Class | Variant Classification | dbSNP RS | HGVSc | HGVSp | HGVSp Short | SWISSPROT | BIOTYPE | SIFT | PolyPhen | Tumor Sample Barcode | Tissue | Histology | Sex | Age | Stage | Therapy Types | Drugs | Outcome |
| UBE2L3 | SNV | Missense_Mutation | novel | c.240C>A | p.Phe80Leu | p.F80L | P68036 | protein_coding | tolerated(0.37) | benign(0.212) | TCGA-AN-A046-01 | Breast | breast invasive carcinoma | Female | >=65 | I/II | Unknown | Unknown | SD |
| UBE2L3 | SNV | Missense_Mutation | c.317A>C | p.Lys106Thr | p.K106T | P68036 | protein_coding | tolerated(0.13) | probably_damaging(0.975) | TCGA-AA-3852-01 | Colorectum | colon adenocarcinoma | Male | >=65 | I/II | Unknown | Unknown | PD | |
| UBE2L3 | SNV | Missense_Mutation | novel | c.374A>C | p.Lys125Thr | p.K125T | P68036 | protein_coding | tolerated(0.19) | possibly_damaging(0.823) | TCGA-AA-3984-01 | Colorectum | colon adenocarcinoma | Female | <65 | I/II | Unknown | Unknown | SD |
| UBE2L3 | SNV | Missense_Mutation | c.271N>A | p.Leu91Met | p.L91M | P68036 | protein_coding | deleterious(0.04) | possibly_damaging(0.654) | TCGA-AD-6895-01 | Colorectum | colon adenocarcinoma | Male | >=65 | III/IV | Unknown | Unknown | SD | |
| UBE2L3 | SNV | Missense_Mutation | novel | c.451N>A | p.Glu151Lys | p.E151K | P68036 | protein_coding | deleterious(0.04) | benign(0.193) | TCGA-F5-6814-01 | Colorectum | rectum adenocarcinoma | Male | <65 | I/II | Unknown | Unknown | SD |
| UBE2L3 | deletion | In_Frame_Del | c.326_331delNNNNNN | p.Arg110_Ile111del | p.R110_I111del | P68036 | protein_coding | TCGA-CA-6715-01 | Colorectum | colon adenocarcinoma | Male | <65 | III/IV | Chemotherapy | oxaliplatin | CR | |||
| UBE2L3 | SNV | Missense_Mutation | novel | c.571N>T | p.Arg191Cys | p.R191C | P68036 | protein_coding | tolerated(0.06) | benign(0.122) | TCGA-AX-A0IZ-01 | Endometrium | uterine corpus endometrioid carcinoma | Female | <65 | I/II | Unknown | Unknown | SD |
| UBE2L3 | SNV | Missense_Mutation | novel | c.609N>T | p.Lys203Asn | p.K203N | P68036 | protein_coding | deleterious(0.03) | possibly_damaging(0.736) | TCGA-BK-A6W3-01 | Endometrium | uterine corpus endometrioid carcinoma | Female | <65 | I/II | Unknown | Unknown | SD |
| UBE2L3 | SNV | Missense_Mutation | novel | c.576N>C | p.Lys192Asn | p.K192N | P68036 | protein_coding | deleterious(0.04) | probably_damaging(0.917) | TCGA-E6-A1M0-01 | Endometrium | uterine corpus endometrioid carcinoma | Female | <65 | III/IV | Chemotherapy | carboplatin | SD |
| UBE2L3 | insertion | Frame_Shift_Ins | novel | c.579dupA | p.Phe194IlefsTer3 | p.F194Ifs*3 | P68036 | protein_coding | TCGA-DF-A2KY-01 | Endometrium | uterine corpus endometrioid carcinoma | Female | <65 | III/IV | Chemotherapy | carboplatin | SD |
| Page: 1 2 |
Top |
Related drugs of malignant transformation related genes |
| Identification of chemicals and drugs interact with genes involved in malignant transfromation |
| (DGIdb 4.0) |
| Entrez ID | Symbol | Category | Interaction Types | Drug Claim Name | Drug Name | PMIDs |
| Page: 1 |

Copyright 2023-Present -The University of Texas Health Science Center at Houston |