
|
|||||
|
 | |
| |
| |
| |
| |
| |
|
Gene: TSPO |
Gene summary for TSPO |
| Gene information | Species | Human | Gene symbol | TSPO | Gene ID | 706 |
| Gene name | translocator protein | |
| Gene Alias | BPBS | |
| Cytomap | 22q13.2 | |
| Gene Type | protein-coding | GO ID | GO:0000422 | UniProtAcc | O76068 |
Top |
Malignant transformation analysis |
| Identification of the aberrant gene expression in precancerous and cancerous lesions by comparing the gene expression of stem-like cells in diseased tissues with normal stem cells |
| Entrez ID | Symbol | Replicates | Species | Organ | Tissue | Adj P-value | Log2FC | Malignancy |
| 706 | TSPO | GSM4909281 | Human | Breast | IDC | 5.59e-20 | 4.68e-01 | 0.21 |
| 706 | TSPO | GSM4909282 | Human | Breast | IDC | 4.94e-50 | 6.78e-01 | -0.0288 |
| 706 | TSPO | GSM4909285 | Human | Breast | IDC | 6.12e-18 | 5.46e-01 | 0.21 |
| 706 | TSPO | GSM4909286 | Human | Breast | IDC | 2.79e-07 | 3.16e-01 | 0.1081 |
| 706 | TSPO | GSM4909287 | Human | Breast | IDC | 4.72e-14 | 3.18e-01 | 0.2057 |
| 706 | TSPO | GSM4909288 | Human | Breast | IDC | 1.19e-10 | 3.81e-01 | 0.0988 |
| 706 | TSPO | GSM4909289 | Human | Breast | IDC | 4.76e-03 | 3.71e-01 | 0.1064 |
| 706 | TSPO | GSM4909290 | Human | Breast | IDC | 1.01e-04 | 3.27e-01 | 0.2096 |
| 706 | TSPO | GSM4909294 | Human | Breast | IDC | 3.76e-09 | 1.16e-01 | 0.2022 |
| 706 | TSPO | GSM4909296 | Human | Breast | IDC | 3.93e-18 | 2.80e-01 | 0.1524 |
| 706 | TSPO | GSM4909297 | Human | Breast | IDC | 8.50e-22 | -1.72e-01 | 0.1517 |
| 706 | TSPO | GSM4909306 | Human | Breast | IDC | 2.17e-03 | 3.32e-01 | 0.1564 |
| 706 | TSPO | GSM4909309 | Human | Breast | IDC | 3.53e-04 | 3.25e-02 | 0.0483 |
| 706 | TSPO | GSM4909311 | Human | Breast | IDC | 1.49e-47 | -1.74e-01 | 0.1534 |
| 706 | TSPO | GSM4909312 | Human | Breast | IDC | 8.84e-13 | 8.32e-02 | 0.1552 |
| 706 | TSPO | GSM4909313 | Human | Breast | IDC | 3.62e-06 | -6.88e-02 | 0.0391 |
| 706 | TSPO | GSM4909315 | Human | Breast | IDC | 8.51e-11 | 3.73e-01 | 0.21 |
| 706 | TSPO | GSM4909316 | Human | Breast | IDC | 1.71e-15 | 2.71e-01 | 0.21 |
| 706 | TSPO | GSM4909318 | Human | Breast | IDC | 7.60e-05 | -4.44e-01 | 0.2031 |
| 706 | TSPO | GSM4909319 | Human | Breast | IDC | 1.24e-56 | -4.03e-01 | 0.1563 |
| Page: 1 2 3 4 5 6 7 8 9 10 11 12 13 14 15 16 |
| Tissue | Expression Dynamics | Abbreviation |
| Breast | 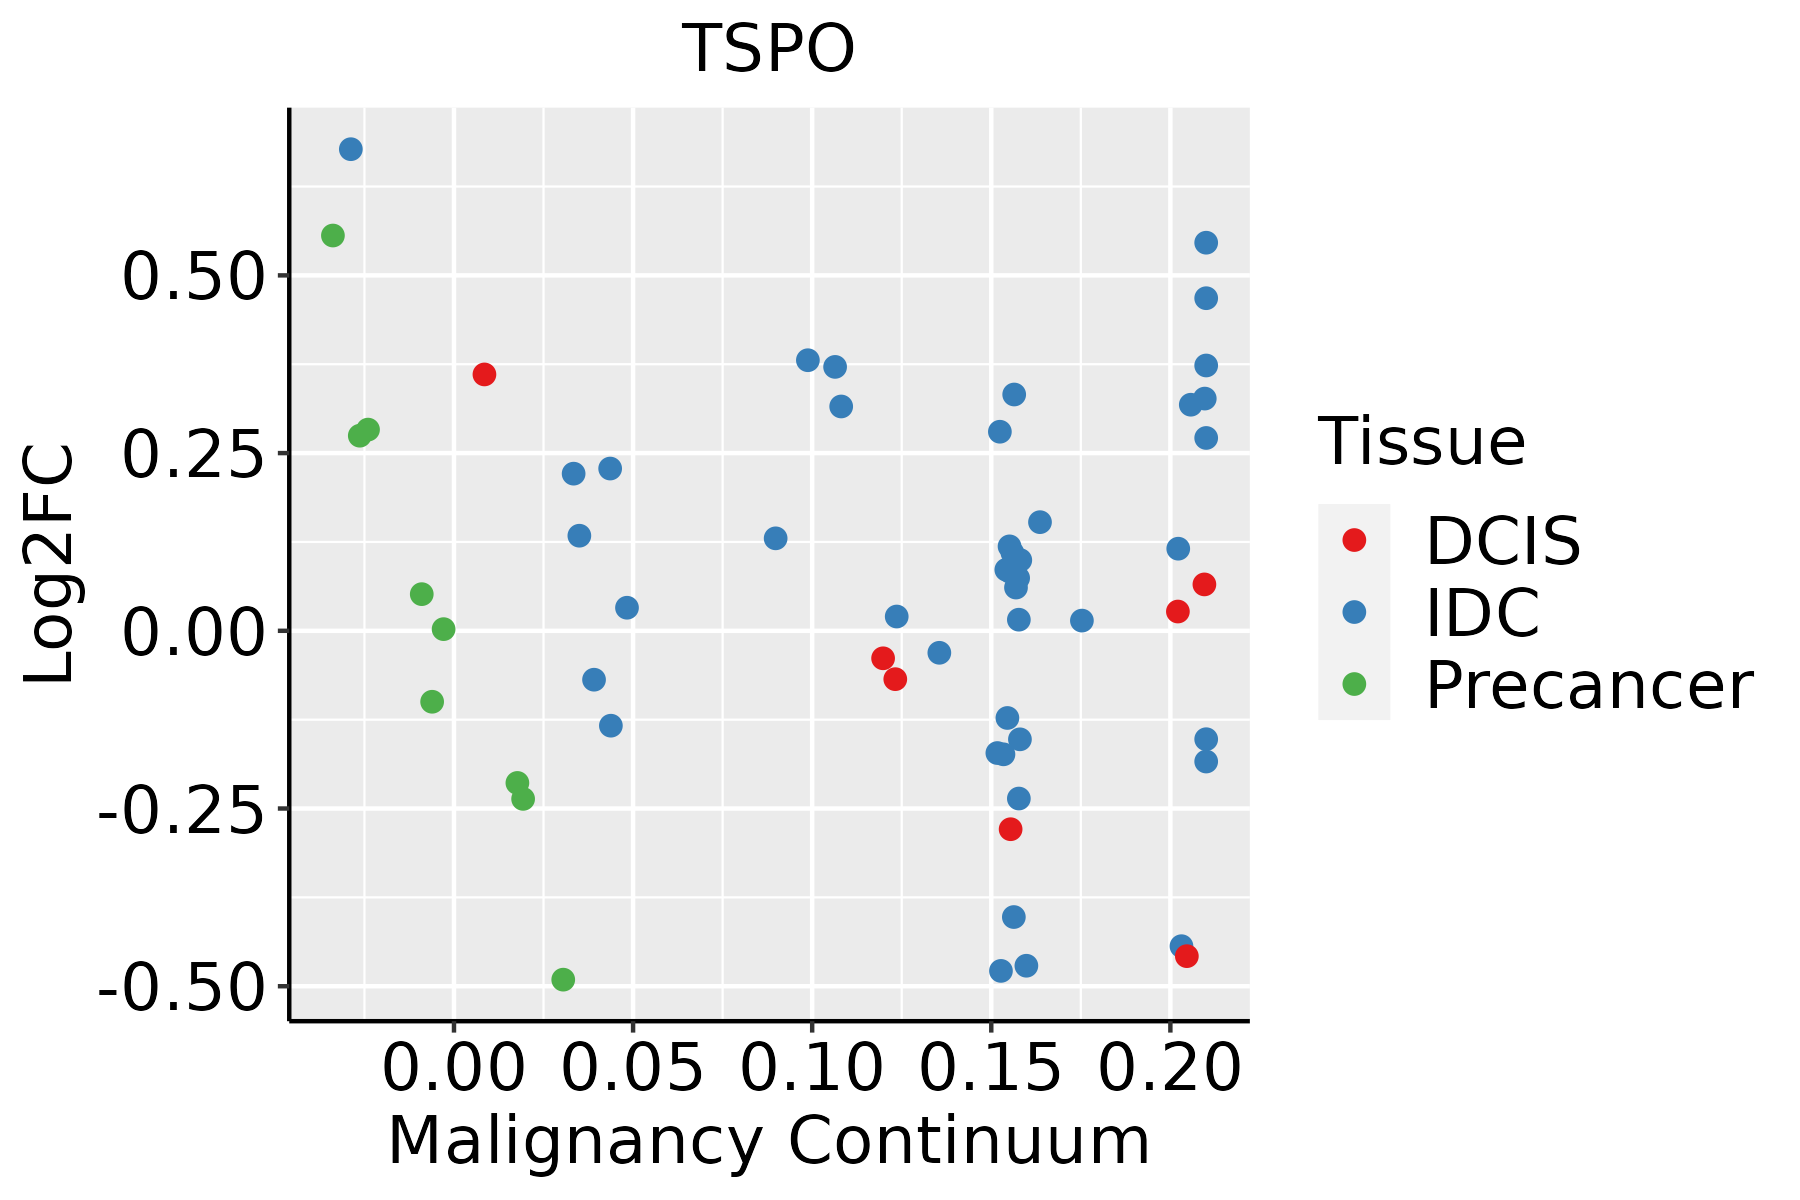 | IDC: Invasive ductal carcinoma |
| DCIS: Ductal carcinoma in situ | ||
| Precancer(BRCA1-mut): Precancerous lesion from BRCA1 mutation carriers | ||
| Cervix |  | CC: Cervix cancer |
| HSIL_HPV: HPV-infected high-grade squamous intraepithelial lesions | ||
| N_HPV: HPV-infected normal cervix | ||
| Colorectum (GSE201348) |  | FAP: Familial adenomatous polyposis |
| CRC: Colorectal cancer | ||
| Colorectum (HTA11) |  | AD: Adenomas |
| SER: Sessile serrated lesions | ||
| MSI-H: Microsatellite-high colorectal cancer | ||
| MSS: Microsatellite stable colorectal cancer | ||
| Endometrium |  | AEH: Atypical endometrial hyperplasia |
| EEC: Endometrioid Cancer | ||
| Esophagus | 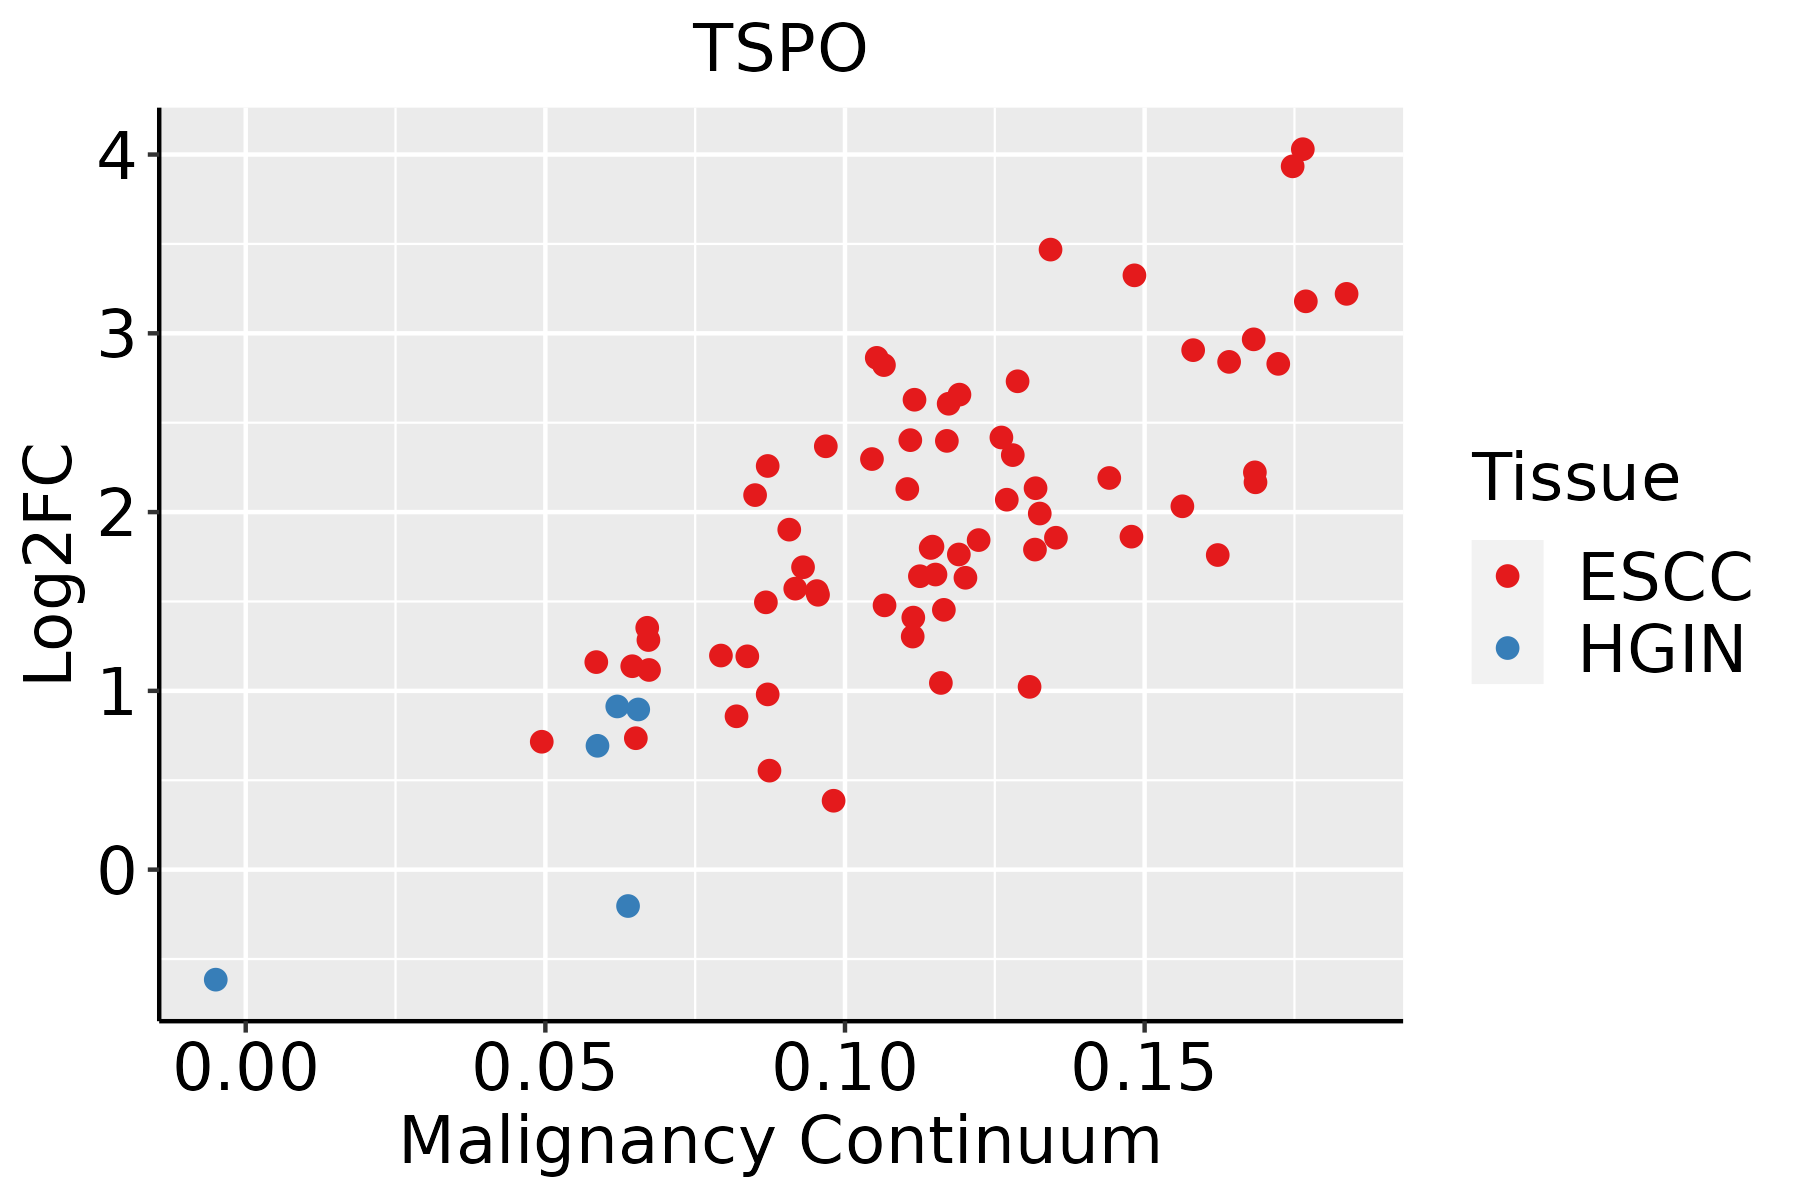 | ESCC: Esophageal squamous cell carcinoma |
| HGIN: High-grade intraepithelial neoplasias | ||
| LGIN: Low-grade intraepithelial neoplasias | ||
| GC | 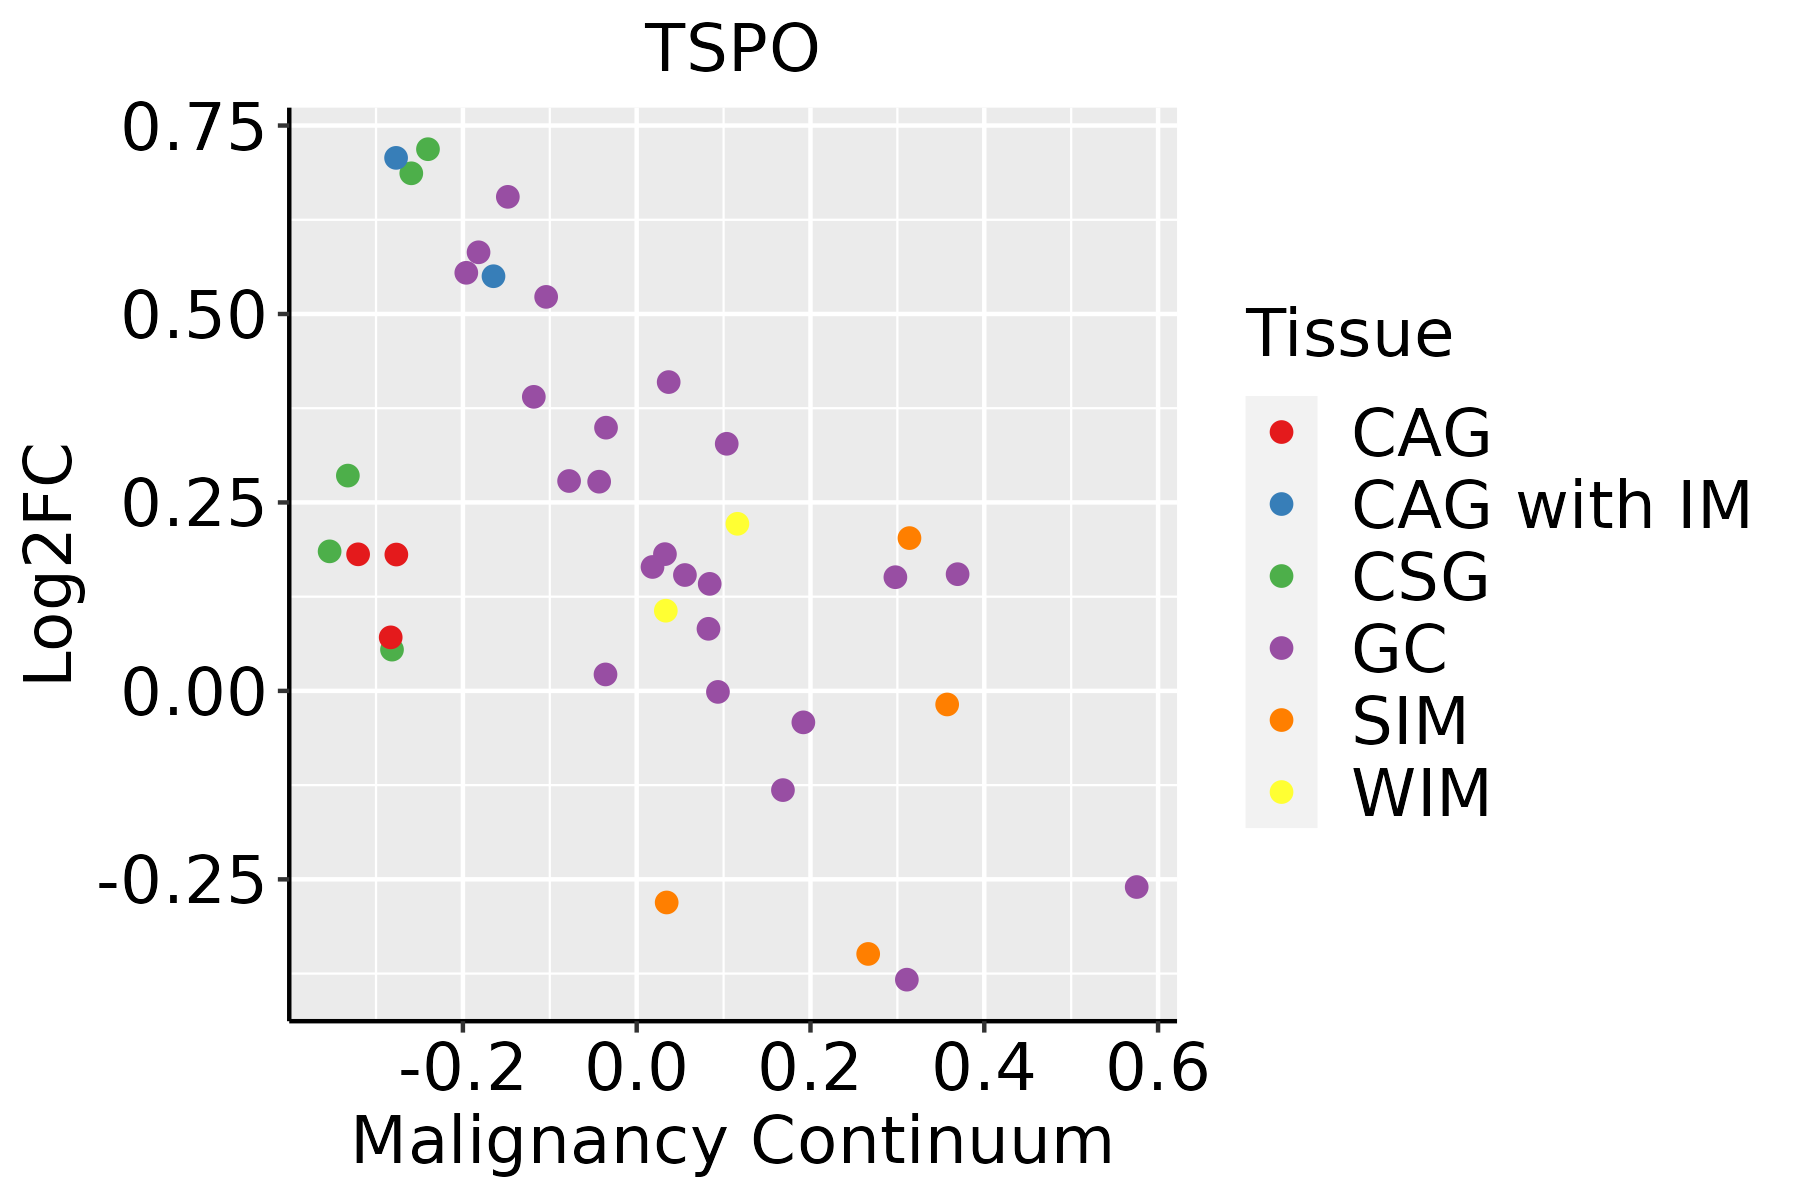 | CAG: Chronic atrophic gastritis |
| CAG with IM: Chronic atrophic gastritis with intestinal metaplasia | ||
| CSG: Chronic superficial gastritis | ||
| GC: Gastric cancer | ||
| SIM: Severe intestinal metaplasia | ||
| WIM: Wild intestinal metaplasia | ||
| Liver | 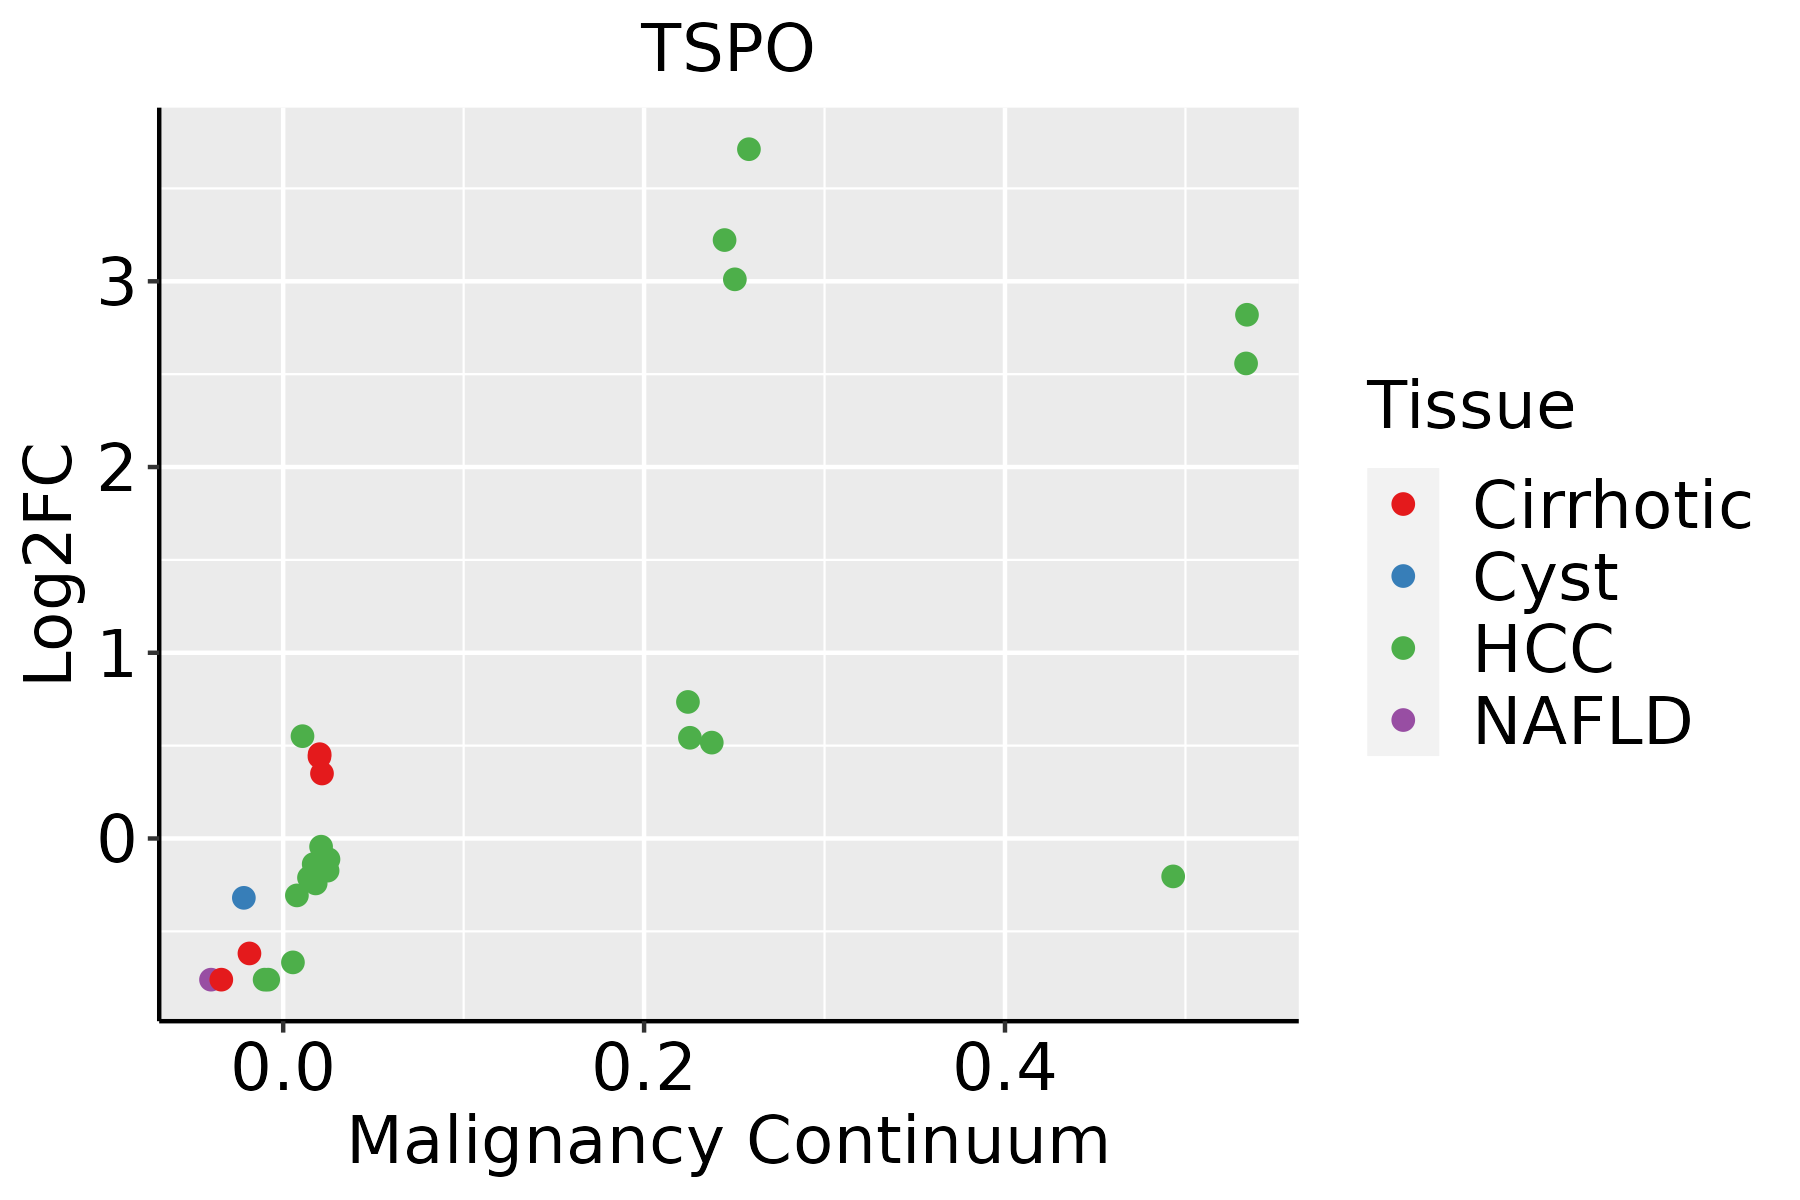 | HCC: Hepatocellular carcinoma |
| NAFLD: Non-alcoholic fatty liver disease | ||
| Oral Cavity | 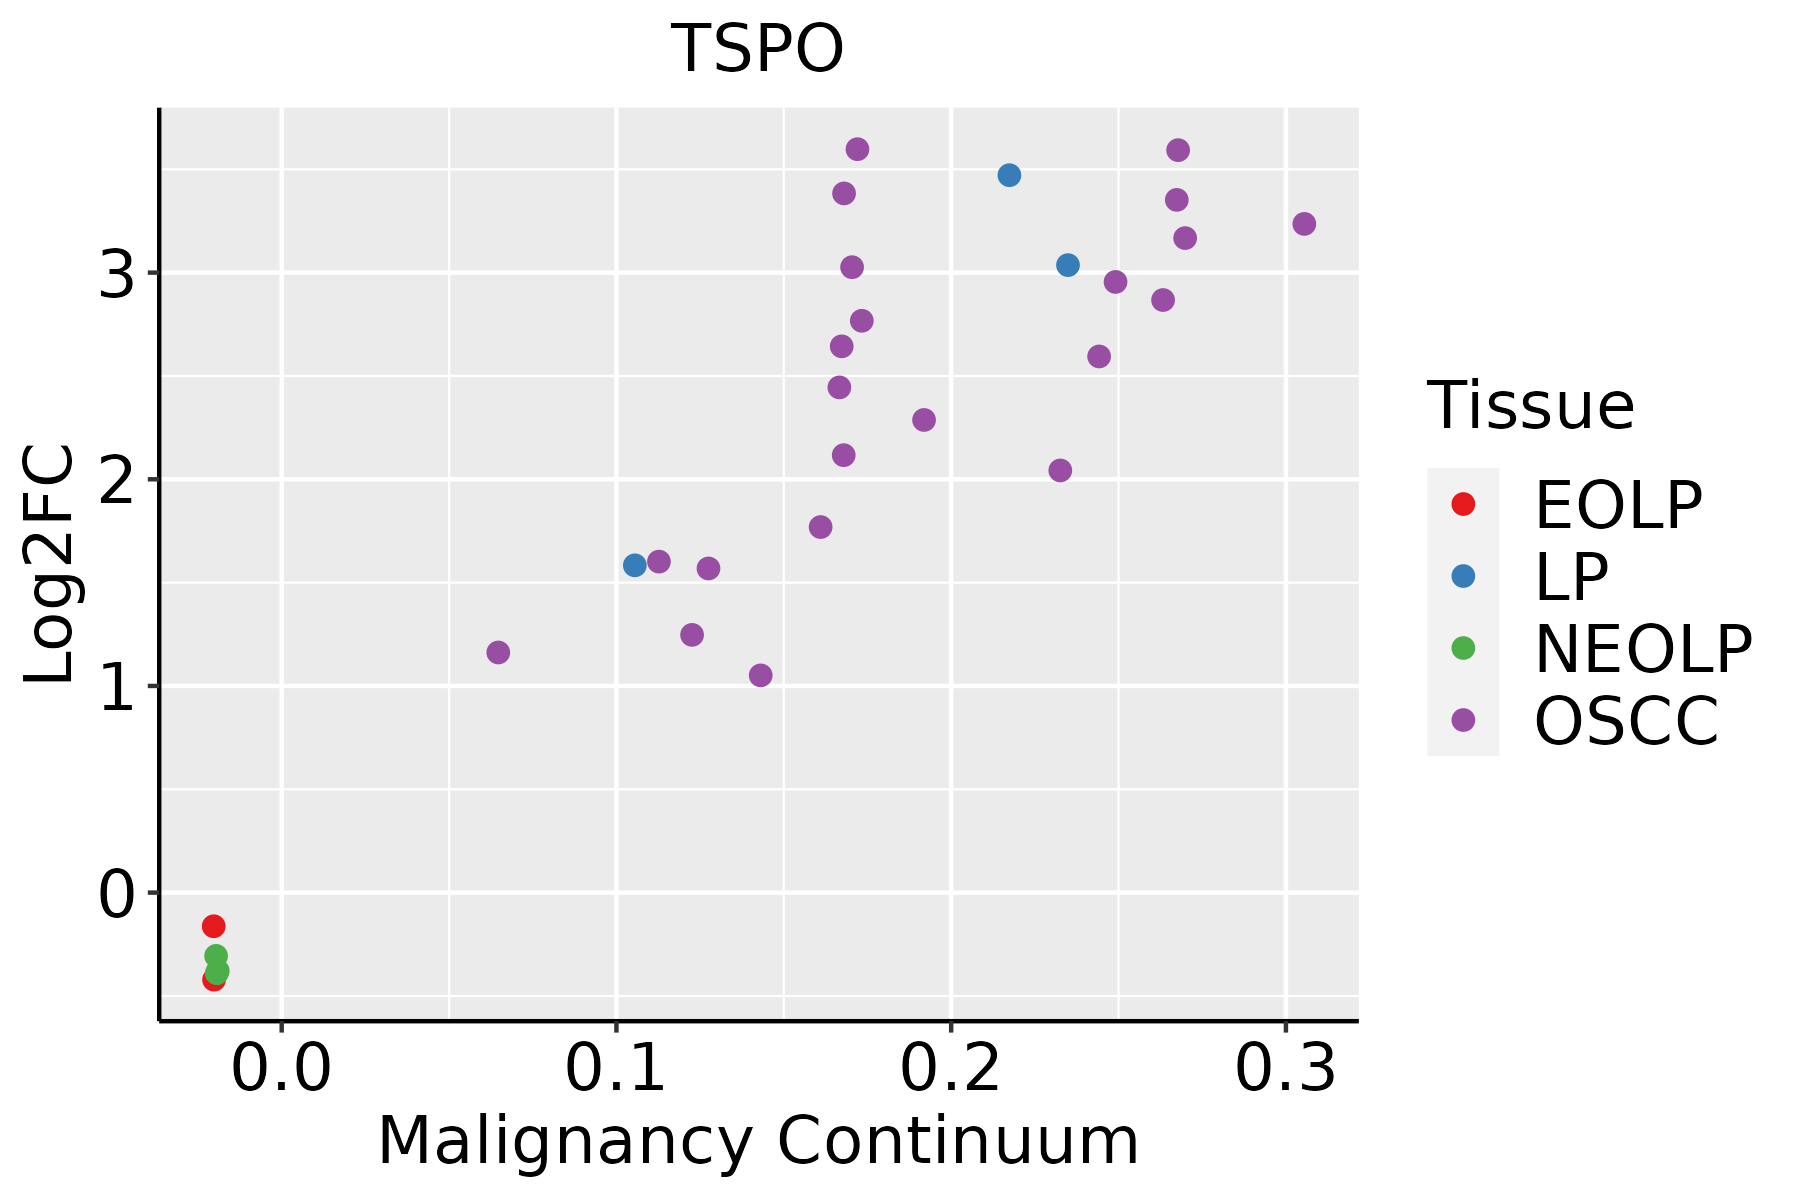 | EOLP: Erosive Oral lichen planus |
| LP: leukoplakia | ||
| NEOLP: Non-erosive oral lichen planus | ||
| OSCC: Oral squamous cell carcinoma | ||
| Prostate | 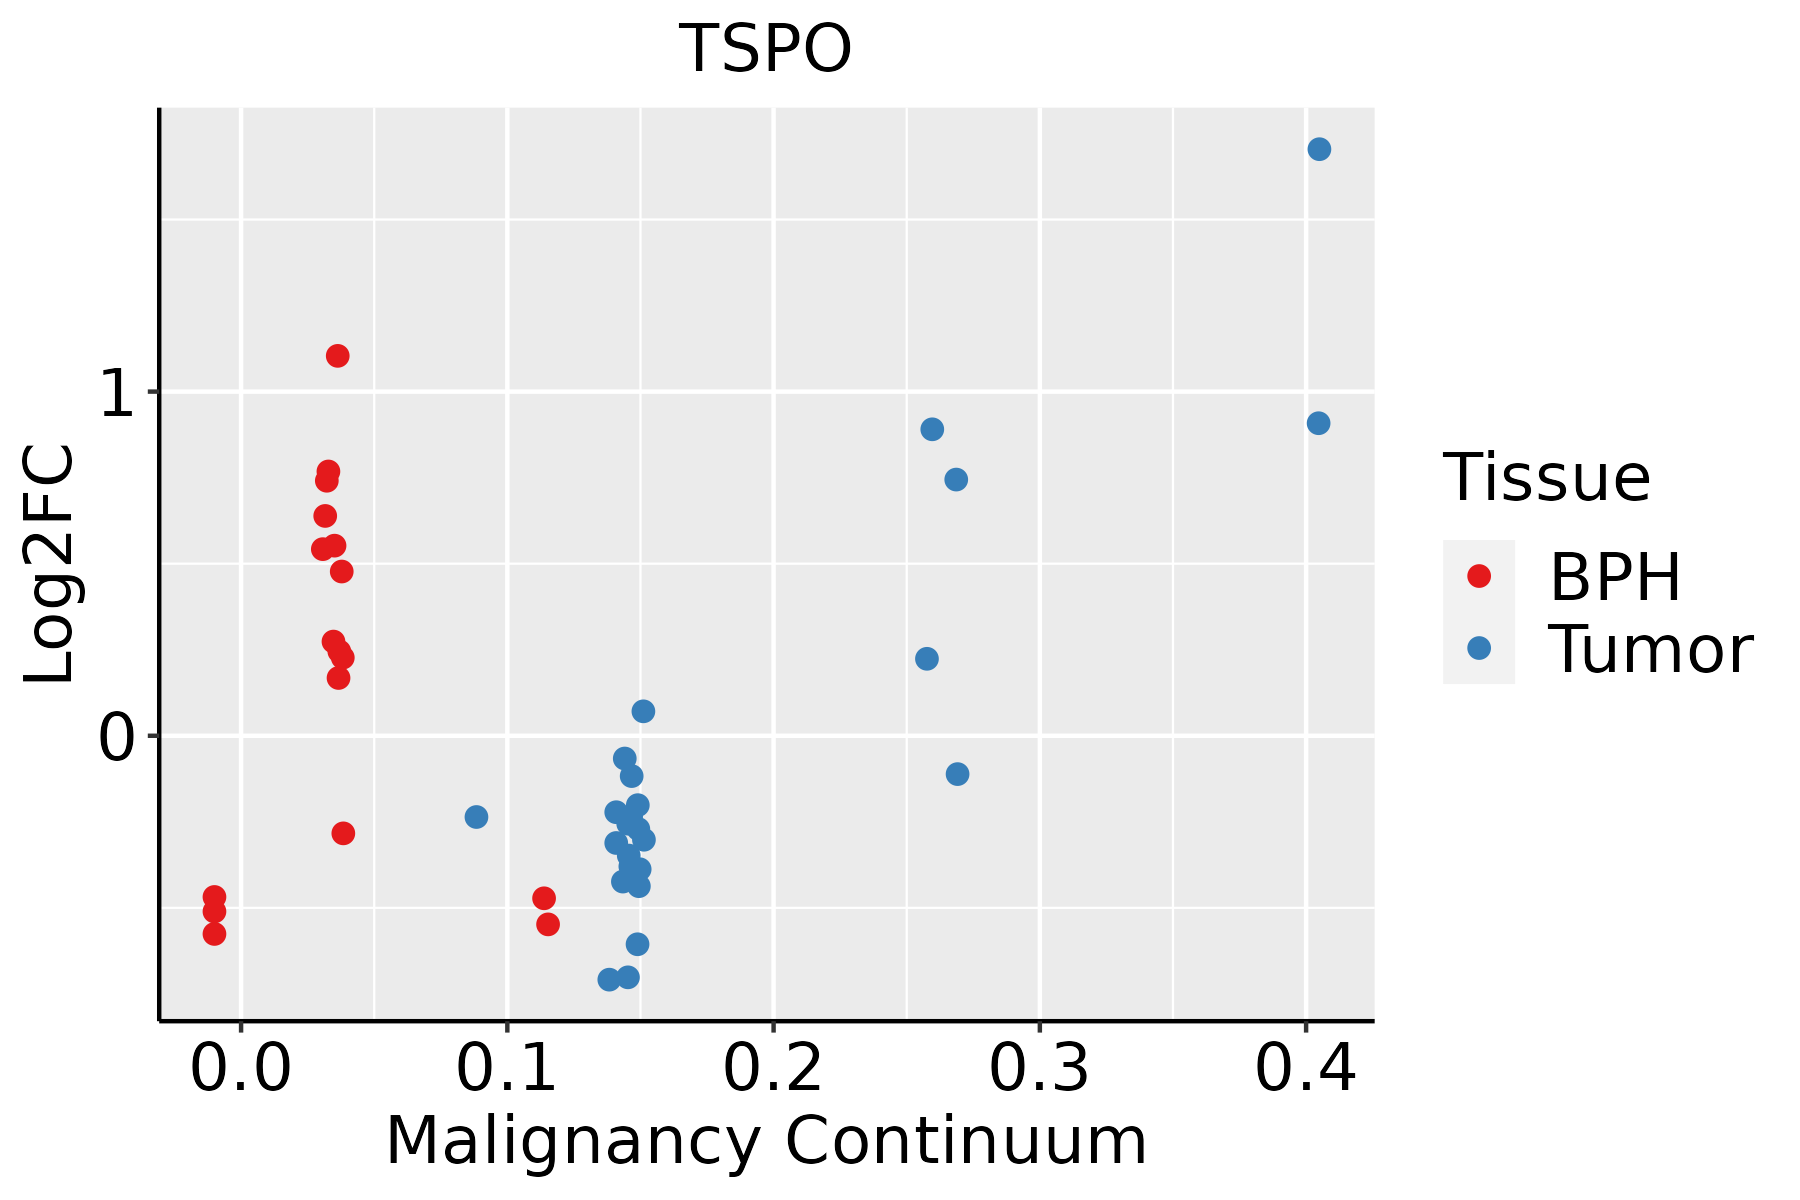 | BPH: Benign Prostatic Hyperplasia |
| Skin |  | AK: Actinic keratosis |
| cSCC: Cutaneous squamous cell carcinoma | ||
| SCCIS:squamous cell carcinoma in situ | ||
| Thyroid |  | ATC: Anaplastic thyroid cancer |
| HT: Hashimoto's thyroiditis | ||
| PTC: Papillary thyroid cancer |
| ∗log2FC in expression of this searched gene in stem-like cells from each diseased tissue sample relative to stem-like cells in normal samples in each tissue plotted against the malignancy continuum. Samples are colored based on if they are from different disease stage. |
Top |
Malignant transformation related pathway analysis |
| Find out the enriched GO biological processes and KEGG pathways involved in transition from healthy to precancer to cancer |
| Tissue | Disease Stage | Enriched GO biological Processes |
| Colorectum | AD |  |
| Colorectum | SER |  |
| Colorectum | MSS |  |
| Colorectum | MSI-H |  |
| Colorectum | FAP |  |
| ∗Top 15 enriched GO BP terms are showed in the bar plot of each disease state in each tissue. Each row represents a significant GO biological process which is colored according to the -log10(p.adjust). |
| Page: 1 2 3 4 5 6 7 8 9 |
| GO ID | Tissue | Disease Stage | Description | Gene Ratio | Bg Ratio | pvalue | p.adjust | Count |
| GO:00313301 | Colorectum | SER | negative regulation of cellular catabolic process | 70/2897 | 262/18723 | 1.79e-06 | 7.70e-05 | 70 |
| GO:00004221 | Colorectum | SER | autophagy of mitochondrion | 29/2897 | 81/18723 | 5.61e-06 | 2.01e-04 | 29 |
| GO:00617261 | Colorectum | SER | mitochondrion disassembly | 29/2897 | 81/18723 | 5.61e-06 | 2.01e-04 | 29 |
| GO:00726551 | Colorectum | SER | establishment of protein localization to mitochondrion | 38/2897 | 120/18723 | 6.60e-06 | 2.33e-04 | 38 |
| GO:00313971 | Colorectum | SER | negative regulation of protein ubiquitination | 29/2897 | 83/18723 | 9.72e-06 | 3.22e-04 | 29 |
| GO:19030081 | Colorectum | SER | organelle disassembly | 36/2897 | 114/18723 | 1.22e-05 | 3.89e-04 | 36 |
| GO:00068091 | Colorectum | SER | nitric oxide biosynthetic process | 27/2897 | 76/18723 | 1.38e-05 | 4.28e-04 | 27 |
| GO:00462091 | Colorectum | SER | nitric oxide metabolic process | 28/2897 | 81/18723 | 1.73e-05 | 5.15e-04 | 28 |
| GO:20010571 | Colorectum | SER | reactive nitrogen species metabolic process | 28/2897 | 82/18723 | 2.24e-05 | 6.43e-04 | 28 |
| GO:00066051 | Colorectum | SER | protein targeting | 76/2897 | 314/18723 | 3.19e-05 | 8.47e-04 | 76 |
| GO:00725931 | Colorectum | SER | reactive oxygen species metabolic process | 61/2897 | 239/18723 | 3.63e-05 | 9.39e-04 | 61 |
| GO:00316671 | Colorectum | SER | response to nutrient levels | 106/2897 | 474/18723 | 3.94e-05 | 1.00e-03 | 106 |
| GO:00485451 | Colorectum | SER | response to steroid hormone | 80/2897 | 339/18723 | 5.15e-05 | 1.25e-03 | 80 |
| GO:19033211 | Colorectum | SER | negative regulation of protein modification by small protein conjugation or removal | 30/2897 | 95/18723 | 6.29e-05 | 1.46e-03 | 30 |
| GO:00066261 | Colorectum | SER | protein targeting to mitochondrion | 31/2897 | 100/18723 | 7.09e-05 | 1.61e-03 | 31 |
| GO:19035781 | Colorectum | SER | regulation of ATP metabolic process | 28/2897 | 87/18723 | 7.51e-05 | 1.68e-03 | 28 |
| GO:00105061 | Colorectum | SER | regulation of autophagy | 74/2897 | 317/18723 | 1.39e-04 | 2.77e-03 | 74 |
| GO:00100381 | Colorectum | SER | response to metal ion | 84/2897 | 373/18723 | 1.87e-04 | 3.44e-03 | 84 |
| GO:20003791 | Colorectum | SER | positive regulation of reactive oxygen species metabolic process | 24/2897 | 76/18723 | 3.29e-04 | 5.22e-03 | 24 |
| GO:20003771 | Colorectum | SER | regulation of reactive oxygen species metabolic process | 41/2897 | 157/18723 | 3.86e-04 | 5.86e-03 | 41 |
| Page: 1 2 3 4 5 6 7 8 9 10 11 12 13 14 15 16 17 18 19 20 21 22 23 24 25 26 27 28 29 30 31 32 33 34 35 36 37 38 39 40 41 42 43 44 45 46 47 48 49 50 51 52 53 54 55 56 57 58 59 60 61 62 63 64 65 66 67 68 69 70 71 72 73 74 75 76 77 78 79 80 81 82 83 84 85 86 87 88 89 90 91 92 93 94 95 96 97 98 99 100 |
| Pathway ID | Tissue | Disease Stage | Description | Gene Ratio | Bg Ratio | pvalue | p.adjust | qvalue | Count |
| hsa0516618 | Breast | Precancer | Human T-cell leukemia virus 1 infection | 33/684 | 222/8465 | 4.29e-04 | 3.31e-03 | 2.53e-03 | 33 |
| hsa0516619 | Breast | Precancer | Human T-cell leukemia virus 1 infection | 33/684 | 222/8465 | 4.29e-04 | 3.31e-03 | 2.53e-03 | 33 |
| hsa0516624 | Breast | IDC | Human T-cell leukemia virus 1 infection | 40/867 | 222/8465 | 2.52e-04 | 2.21e-03 | 1.66e-03 | 40 |
| hsa0516634 | Breast | IDC | Human T-cell leukemia virus 1 infection | 40/867 | 222/8465 | 2.52e-04 | 2.21e-03 | 1.66e-03 | 40 |
| hsa0516642 | Breast | DCIS | Human T-cell leukemia virus 1 infection | 41/846 | 222/8465 | 7.03e-05 | 6.88e-04 | 5.07e-04 | 41 |
| hsa0516652 | Breast | DCIS | Human T-cell leukemia virus 1 infection | 41/846 | 222/8465 | 7.03e-05 | 6.88e-04 | 5.07e-04 | 41 |
| hsa0516620 | Cervix | CC | Human T-cell leukemia virus 1 infection | 61/1267 | 222/8465 | 8.13e-07 | 7.98e-06 | 4.72e-06 | 61 |
| hsa05166110 | Cervix | CC | Human T-cell leukemia virus 1 infection | 61/1267 | 222/8465 | 8.13e-07 | 7.98e-06 | 4.72e-06 | 61 |
| hsa0516643 | Cervix | N_HPV | Human T-cell leukemia virus 1 infection | 22/349 | 222/8465 | 1.17e-04 | 1.18e-03 | 9.23e-04 | 22 |
| hsa0516653 | Cervix | N_HPV | Human T-cell leukemia virus 1 infection | 22/349 | 222/8465 | 1.17e-04 | 1.18e-03 | 9.23e-04 | 22 |
| hsa05166 | Colorectum | AD | Human T-cell leukemia virus 1 infection | 72/2092 | 222/8465 | 5.24e-03 | 2.44e-02 | 1.55e-02 | 72 |
| hsa051661 | Colorectum | AD | Human T-cell leukemia virus 1 infection | 72/2092 | 222/8465 | 5.24e-03 | 2.44e-02 | 1.55e-02 | 72 |
| hsa051662 | Colorectum | MSS | Human T-cell leukemia virus 1 infection | 68/1875 | 222/8465 | 1.84e-03 | 9.61e-03 | 5.89e-03 | 68 |
| hsa051663 | Colorectum | MSS | Human T-cell leukemia virus 1 infection | 68/1875 | 222/8465 | 1.84e-03 | 9.61e-03 | 5.89e-03 | 68 |
| hsa0516626 | Endometrium | AEH | Human T-cell leukemia virus 1 infection | 50/1197 | 222/8465 | 4.30e-04 | 3.11e-03 | 2.27e-03 | 50 |
| hsa05166111 | Endometrium | AEH | Human T-cell leukemia virus 1 infection | 50/1197 | 222/8465 | 4.30e-04 | 3.11e-03 | 2.27e-03 | 50 |
| hsa0516627 | Endometrium | EEC | Human T-cell leukemia virus 1 infection | 52/1237 | 222/8465 | 2.73e-04 | 2.36e-03 | 1.76e-03 | 52 |
| hsa0516636 | Endometrium | EEC | Human T-cell leukemia virus 1 infection | 52/1237 | 222/8465 | 2.73e-04 | 2.36e-03 | 1.76e-03 | 52 |
| hsa0516639 | Esophagus | HGIN | Human T-cell leukemia virus 1 infection | 51/1383 | 222/8465 | 5.84e-03 | 4.05e-02 | 3.22e-02 | 51 |
| hsa05166114 | Esophagus | HGIN | Human T-cell leukemia virus 1 infection | 51/1383 | 222/8465 | 5.84e-03 | 4.05e-02 | 3.22e-02 | 51 |
| Page: 1 2 3 |
Top |
Cell-cell communication analysis |
| Identification of potential cell-cell interactions between two cell types and their ligand-receptor pairs for different disease states |
| Ligand | Receptor | LRpair | Pathway | Tissue | Disease Stage |
| Page: 1 |
Top |
Single-cell gene regulatory network inference analysis |
| Find out the significant the regulons (TFs) and the target genes of each regulon across cell types for different disease states |
| TF | Cell Type | Tissue | Disease Stage | Target Gene | RSS | Regulon Activity |
| ∗The dot plots of a searched regulon are shown for all cell subpopulations in each disease state of each tissue based on the regulon specific score inferred using pySCENIC and by calculating the average expression. |
| Page: 1 |
Top |
Somatic mutation of malignant transformation related genes |
| Annotation of somatic variants for genes involved in malignant transformation |
| Hugo Symbol | Variant Class | Variant Classification | dbSNP RS | HGVSc | HGVSp | HGVSp Short | SWISSPROT | BIOTYPE | SIFT | PolyPhen | Tumor Sample Barcode | Tissue | Histology | Sex | Age | Stage | Therapy Types | Drugs | Outcome |
| TSPO | deletion | Frame_Shift_Del | novel | c.209delA | p.Glu70GlyfsTer22 | p.E70Gfs*22 | B1AH88,P30536 | protein_coding | TCGA-EW-A2FV-01 | Breast | breast invasive carcinoma | Female | <65 | III/IV | Chemotherapy | docetaxel | SD | ||
| TSPO | SNV | Missense_Mutation | c.484N>T | p.Arg162Cys | p.R162C | B1AH88,P30536 | protein_coding | deleterious(0) | possibly_damaging(0.513) | TCGA-CK-4951-01 | Colorectum | colon adenocarcinoma | Female | >=65 | I/II | Unknown | Unknown | PD | |
| TSPO | SNV | Missense_Mutation | novel | c.208G>C | p.Glu70Gln | p.E70Q | B1AH88,P30536 | protein_coding | deleterious(0.01) | probably_damaging(0.993) | TCGA-AJ-A3EK-01 | Endometrium | uterine corpus endometrioid carcinoma | Female | <65 | I/II | Chemotherapy | carboplatin | CR |
| Page: 1 |
Top |
Related drugs of malignant transformation related genes |
| Identification of chemicals and drugs interact with genes involved in malignant transfromation |
| (DGIdb 4.0) |
| Entrez ID | Symbol | Category | Interaction Types | Drug Claim Name | Drug Name | PMIDs |
| 706 | TSPO | DRUGGABLE GENOME | Quinoline carboxamide derivative 7 | |||
| 706 | TSPO | DRUGGABLE GENOME | Quinoline carboxamide derivative 4 | |||
| 706 | TSPO | DRUGGABLE GENOME | Imidazopyridine acetamide analog 7 | |||
| 706 | TSPO | DRUGGABLE GENOME | PMID27607364-Compound-59 | |||
| 706 | TSPO | DRUGGABLE GENOME | ZOPICLONE | ZOPICLONE | ||
| 706 | TSPO | DRUGGABLE GENOME | PMID27607364-Compound-64 | |||
| 706 | TSPO | DRUGGABLE GENOME | Imidazo[1,2-b]pyridazine acetamide derivative 5 | |||
| 706 | TSPO | DRUGGABLE GENOME | Imidazo[1,2-b]pyridazine acetamide derivative 6 | |||
| 706 | TSPO | DRUGGABLE GENOME | PMID27599163-Compound-76 | |||
| 706 | TSPO | DRUGGABLE GENOME | Diazepam | DIAZEPAM |
| Page: 1 2 3 4 5 6 7 8 9 10 11 12 13 14 15 |

Copyright 2023-Present -The University of Texas Health Science Center at Houston |