
|
|||||
|
 | |
| |
| |
| |
| |
| |
|
Gene: TERF2 |
Gene summary for TERF2 |
| Gene information | Species | Human | Gene symbol | TERF2 | Gene ID | 7014 |
| Gene name | telomeric repeat binding factor 2 | |
| Gene Alias | TRBF2 | |
| Cytomap | 16q22.1 | |
| Gene Type | protein-coding | GO ID | GO:0000012 | UniProtAcc | Q15554 |
Top |
Malignant transformation analysis |
| Identification of the aberrant gene expression in precancerous and cancerous lesions by comparing the gene expression of stem-like cells in diseased tissues with normal stem cells |
| Entrez ID | Symbol | Replicates | Species | Organ | Tissue | Adj P-value | Log2FC | Malignancy |
| 7014 | TERF2 | HTA11_3361_2000001011 | Human | Colorectum | AD | 2.61e-03 | 5.02e-01 | -0.1207 |
| 7014 | TERF2 | HTA11_7663_2000001011 | Human | Colorectum | SER | 6.87e-07 | 1.04e+00 | 0.0131 |
| 7014 | TERF2 | A015-C-203 | Human | Colorectum | FAP | 3.93e-06 | -1.60e-01 | -0.1294 |
| 7014 | TERF2 | A002-C-201 | Human | Colorectum | FAP | 4.26e-03 | -1.69e-01 | 0.0324 |
| 7014 | TERF2 | A002-C-203 | Human | Colorectum | FAP | 2.05e-04 | -1.70e-01 | 0.2786 |
| 7014 | TERF2 | A001-C-108 | Human | Colorectum | FAP | 4.16e-04 | -1.15e-01 | -0.0272 |
| 7014 | TERF2 | A002-C-205 | Human | Colorectum | FAP | 1.94e-05 | -1.66e-01 | -0.1236 |
| 7014 | TERF2 | A015-C-006 | Human | Colorectum | FAP | 9.31e-04 | -1.75e-01 | -0.0994 |
| 7014 | TERF2 | A002-C-114 | Human | Colorectum | FAP | 2.35e-04 | -1.87e-01 | -0.1561 |
| 7014 | TERF2 | A015-C-104 | Human | Colorectum | FAP | 2.65e-08 | -1.33e-01 | -0.1899 |
| 7014 | TERF2 | A001-C-014 | Human | Colorectum | FAP | 5.24e-07 | -2.30e-01 | 0.0135 |
| 7014 | TERF2 | A002-C-016 | Human | Colorectum | FAP | 3.23e-06 | -2.17e-01 | 0.0521 |
| 7014 | TERF2 | A002-C-116 | Human | Colorectum | FAP | 1.62e-07 | -1.91e-01 | -0.0452 |
| 7014 | TERF2 | A014-C-008 | Human | Colorectum | FAP | 7.14e-03 | -1.98e-01 | -0.191 |
| 7014 | TERF2 | A018-E-020 | Human | Colorectum | FAP | 3.68e-05 | -1.94e-01 | -0.2034 |
| 7014 | TERF2 | F034 | Human | Colorectum | FAP | 1.39e-05 | -2.06e-01 | -0.0665 |
| 7014 | TERF2 | F072B | Human | Colorectum | FAP | 2.88e-03 | -1.69e-01 | 0.257 |
| 7014 | TERF2 | CRC-1-8810 | Human | Colorectum | CRC | 2.34e-02 | -1.45e-01 | 0.6257 |
| 7014 | TERF2 | GSM6177620_NYU_UCEC1_lib3_lib3 | Human | Endometrium | EEC | 4.26e-04 | 6.19e-02 | -0.1883 |
| 7014 | TERF2 | GSM6177622_NYU_UCEC3_lib2_lib2 | Human | Endometrium | EEC | 2.42e-03 | -1.31e-03 | -0.1916 |
| Page: 1 2 |
| Tissue | Expression Dynamics | Abbreviation |
| Colorectum (GSE201348) |  | FAP: Familial adenomatous polyposis |
| CRC: Colorectal cancer | ||
| Colorectum (HTA11) |  | AD: Adenomas |
| SER: Sessile serrated lesions | ||
| MSI-H: Microsatellite-high colorectal cancer | ||
| MSS: Microsatellite stable colorectal cancer | ||
| Endometrium | 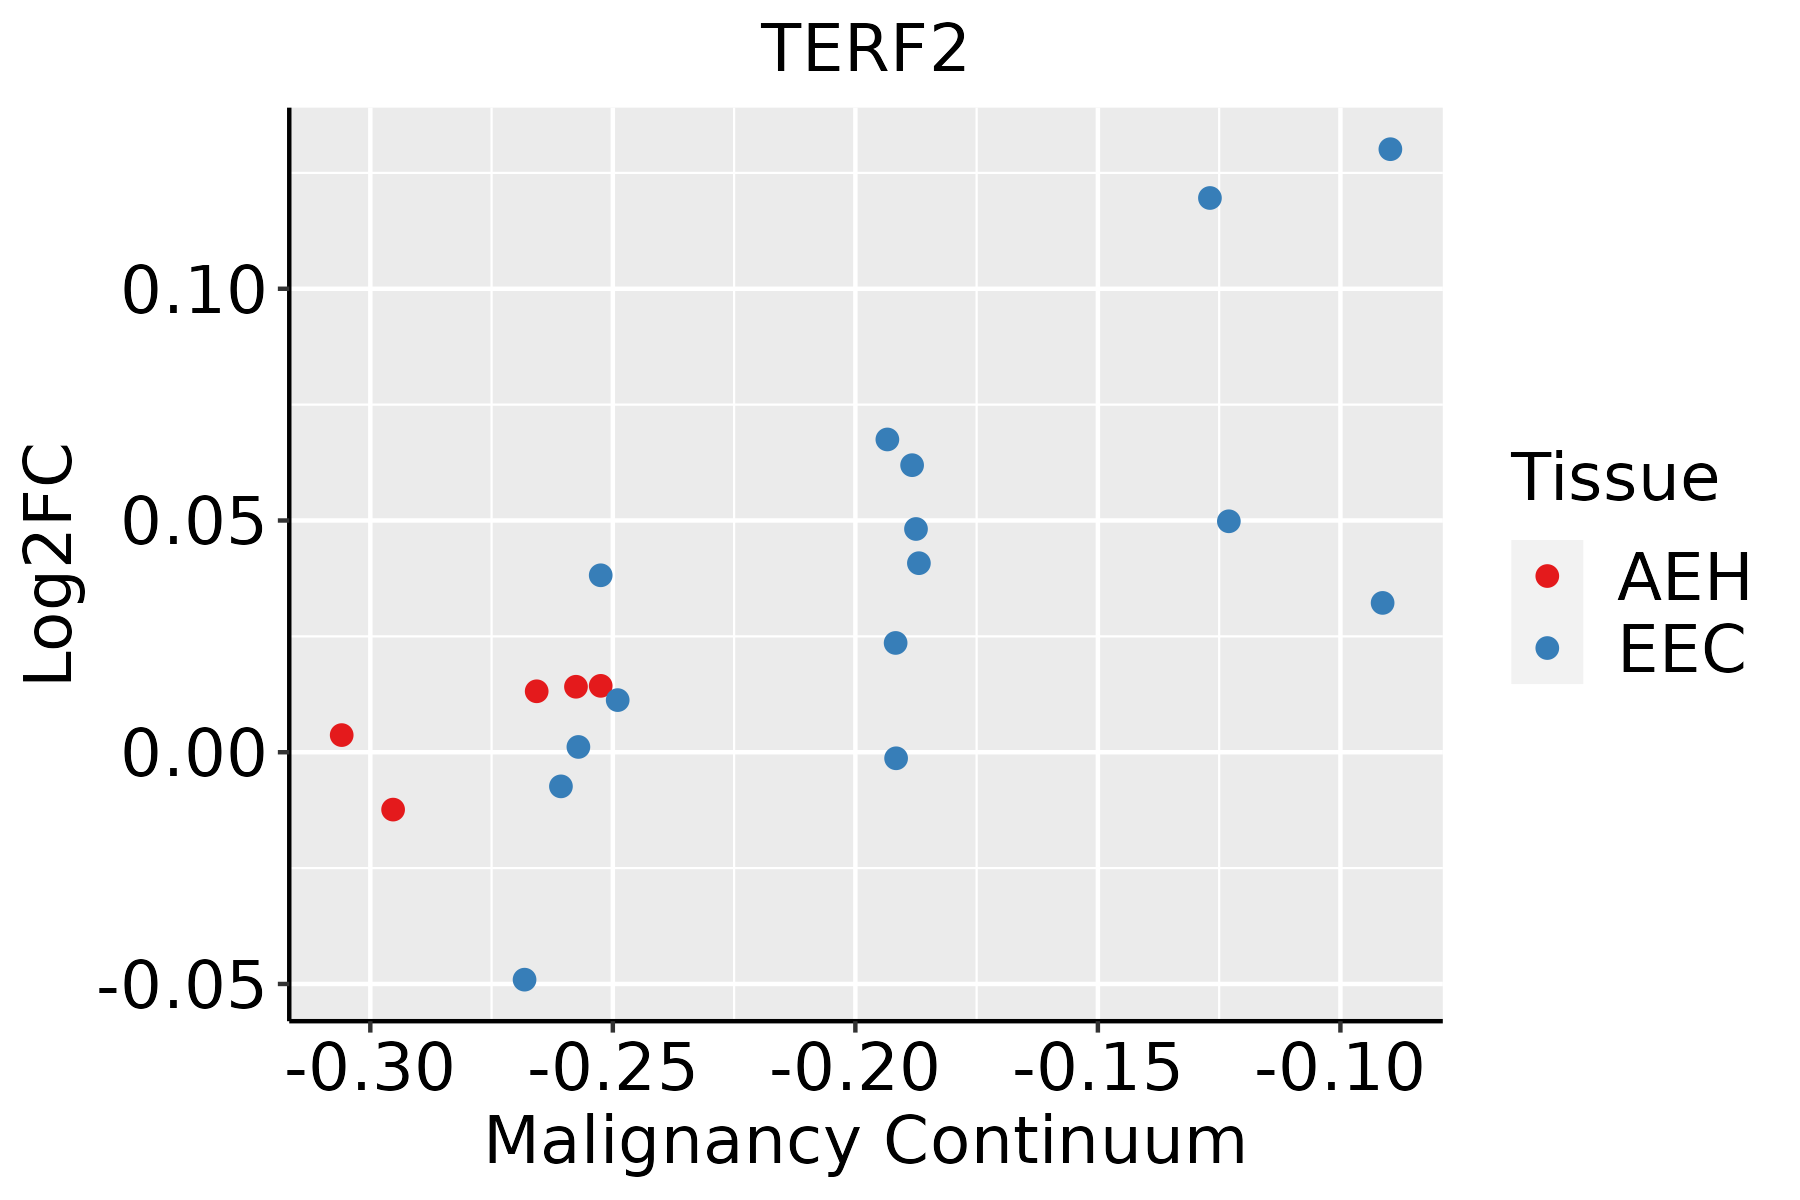 | AEH: Atypical endometrial hyperplasia |
| EEC: Endometrioid Cancer | ||
| Thyroid | 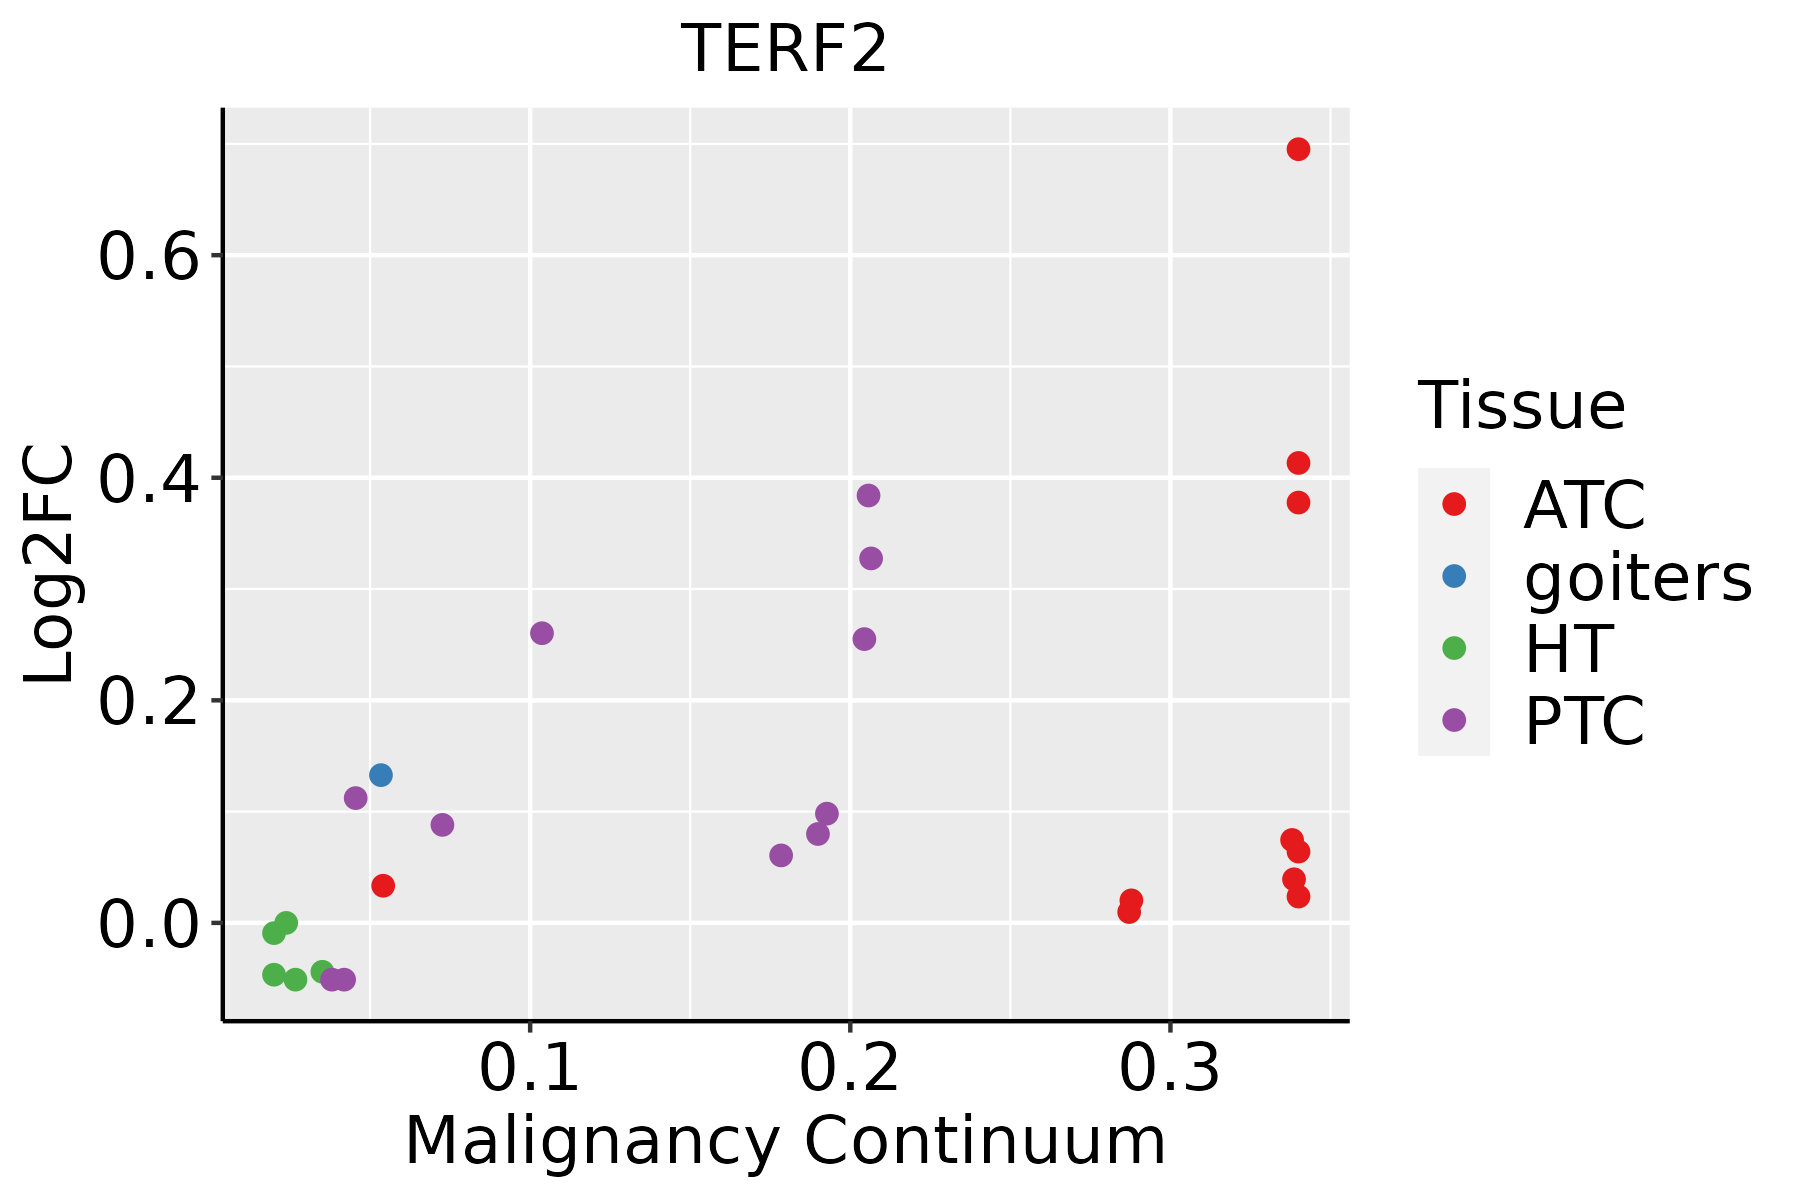 | ATC: Anaplastic thyroid cancer |
| HT: Hashimoto's thyroiditis | ||
| PTC: Papillary thyroid cancer |
| ∗log2FC in expression of this searched gene in stem-like cells from each diseased tissue sample relative to stem-like cells in normal samples in each tissue plotted against the malignancy continuum. Samples are colored based on if they are from different disease stage. |
Top |
Malignant transformation related pathway analysis |
| Find out the enriched GO biological processes and KEGG pathways involved in transition from healthy to precancer to cancer |
| Tissue | Disease Stage | Enriched GO biological Processes |
| Colorectum | AD |  |
| Colorectum | SER |  |
| Colorectum | MSS |  |
| Colorectum | MSI-H |  |
| Colorectum | FAP |  |
| ∗Top 15 enriched GO BP terms are showed in the bar plot of each disease state in each tissue. Each row represents a significant GO biological process which is colored according to the -log10(p.adjust). |
| Page: 1 2 3 4 5 6 7 8 9 |
| GO ID | Tissue | Disease Stage | Description | Gene Ratio | Bg Ratio | pvalue | p.adjust | Count |
| GO:005109212 | Prostate | Tumor | positive regulation of NF-kappaB transcription factor activity | 39/3246 | 152/18723 | 6.15e-03 | 2.85e-02 | 39 |
| GO:00162331 | Prostate | Tumor | telomere capping | 13/3246 | 39/18723 | 1.16e-02 | 4.75e-02 | 13 |
| GO:00322051 | Prostate | Tumor | negative regulation of telomere maintenance | 12/3246 | 35/18723 | 1.18e-02 | 4.83e-02 | 12 |
| GO:003304417 | Skin | cSCC | regulation of chromosome organization | 100/4864 | 187/18723 | 8.97e-16 | 7.70e-14 | 100 |
| GO:0000723110 | Skin | cSCC | telomere maintenance | 68/4864 | 131/18723 | 1.97e-10 | 8.53e-09 | 68 |
| GO:0010639111 | Skin | cSCC | negative regulation of organelle organization | 140/4864 | 348/18723 | 3.35e-09 | 1.15e-07 | 140 |
| GO:003220419 | Skin | cSCC | regulation of telomere maintenance | 45/4864 | 80/18723 | 8.82e-09 | 2.76e-07 | 45 |
| GO:0043123110 | Skin | cSCC | positive regulation of I-kappaB kinase/NF-kappaB signaling | 84/4864 | 186/18723 | 1.09e-08 | 3.40e-07 | 84 |
| GO:000724925 | Skin | cSCC | I-kappaB kinase/NF-kappaB signaling | 116/4864 | 281/18723 | 1.33e-08 | 4.08e-07 | 116 |
| GO:004312225 | Skin | cSCC | regulation of I-kappaB kinase/NF-kappaB signaling | 105/4864 | 249/18723 | 1.70e-08 | 5.09e-07 | 105 |
| GO:0007004110 | Skin | cSCC | telomere maintenance via telomerase | 40/4864 | 69/18723 | 1.83e-08 | 5.45e-07 | 40 |
| GO:0010833110 | Skin | cSCC | telomere maintenance via telomere lengthening | 43/4864 | 81/18723 | 1.79e-07 | 3.94e-06 | 43 |
| GO:005105217 | Skin | cSCC | regulation of DNA metabolic process | 136/4864 | 359/18723 | 3.83e-07 | 7.58e-06 | 136 |
| GO:000627818 | Skin | cSCC | RNA-dependent DNA biosynthetic process | 40/4864 | 75/18723 | 4.04e-07 | 7.92e-06 | 40 |
| GO:000647314 | Skin | cSCC | protein acetylation | 84/4864 | 201/18723 | 6.94e-07 | 1.29e-05 | 84 |
| GO:004593628 | Skin | cSCC | negative regulation of phosphate metabolic process | 160/4864 | 441/18723 | 8.89e-07 | 1.63e-05 | 160 |
| GO:001056328 | Skin | cSCC | negative regulation of phosphorus metabolic process | 160/4864 | 442/18723 | 1.04e-06 | 1.85e-05 | 160 |
| GO:20012514 | Skin | cSCC | negative regulation of chromosome organization | 43/4864 | 86/18723 | 1.53e-06 | 2.61e-05 | 43 |
| GO:003220015 | Skin | cSCC | telomere organization | 68/4864 | 159/18723 | 2.94e-06 | 4.62e-05 | 68 |
| GO:004354314 | Skin | cSCC | protein acylation | 95/4864 | 243/18723 | 4.56e-06 | 6.71e-05 | 95 |
| Page: 1 2 3 4 5 6 7 8 9 10 11 12 13 14 15 16 17 18 19 20 21 22 23 24 25 26 27 28 29 30 |
| Pathway ID | Tissue | Disease Stage | Description | Gene Ratio | Bg Ratio | pvalue | p.adjust | qvalue | Count |
| Page: 1 |
Top |
Cell-cell communication analysis |
| Identification of potential cell-cell interactions between two cell types and their ligand-receptor pairs for different disease states |
| Ligand | Receptor | LRpair | Pathway | Tissue | Disease Stage |
| Page: 1 |
Top |
Single-cell gene regulatory network inference analysis |
| Find out the significant the regulons (TFs) and the target genes of each regulon across cell types for different disease states |
| TF | Cell Type | Tissue | Disease Stage | Target Gene | RSS | Regulon Activity |
| ∗The dot plots of a searched regulon are shown for all cell subpopulations in each disease state of each tissue based on the regulon specific score inferred using pySCENIC and by calculating the average expression. |
| Page: 1 |
Top |
Somatic mutation of malignant transformation related genes |
| Annotation of somatic variants for genes involved in malignant transformation |
| Hugo Symbol | Variant Class | Variant Classification | dbSNP RS | HGVSc | HGVSp | HGVSp Short | SWISSPROT | BIOTYPE | SIFT | PolyPhen | Tumor Sample Barcode | Tissue | Histology | Sex | Age | Stage | Therapy Types | Drugs | Outcome |
| TERF2 | SNV | Missense_Mutation | c.1005N>C | p.Lys335Asn | p.K335N | Q15554 | protein_coding | tolerated(0.05) | benign(0.196) | TCGA-E2-A1LH-01 | Breast | breast invasive carcinoma | Female | <65 | I/II | Chemotherapy | adriamycin | SD | |
| TERF2 | insertion | Nonsense_Mutation | novel | c.978_979insGGCTGAGGCAGGCAGATTACCTG | p.Met327GlyfsTer2 | p.M327Gfs*2 | Q15554 | protein_coding | TCGA-BH-A0AY-01 | Breast | breast invasive carcinoma | Female | <65 | I/II | Chemotherapy | SD | |||
| TERF2 | insertion | Frame_Shift_Ins | novel | c.666dupA | p.His223ThrfsTer14 | p.H223Tfs*14 | Q15554 | protein_coding | TCGA-2W-A8YY-01 | Cervix | cervical & endocervical cancer | Female | <65 | I/II | Chemotherapy | cisplatin | CR | ||
| TERF2 | SNV | Missense_Mutation | novel | c.851A>C | p.Lys284Thr | p.K284T | Q15554 | protein_coding | deleterious(0.03) | possibly_damaging(0.864) | TCGA-5M-AAT6-01 | Colorectum | colon adenocarcinoma | Female | <65 | III/IV | Unknown | Unknown | PD |
| TERF2 | SNV | Missense_Mutation | c.1365C>A | p.Ser455Arg | p.S455R | Q15554 | protein_coding | deleterious(0.02) | benign(0.343) | TCGA-AD-5900-01 | Colorectum | colon adenocarcinoma | Male | >=65 | I/II | Unknown | Unknown | SD | |
| TERF2 | SNV | Missense_Mutation | c.701N>T | p.Arg234Ile | p.R234I | Q15554 | protein_coding | deleterious(0) | probably_damaging(0.927) | TCGA-AG-A002-01 | Colorectum | rectum adenocarcinoma | Male | <65 | I/II | Unknown | Unknown | SD | |
| TERF2 | SNV | Missense_Mutation | c.1336C>T | p.Pro446Ser | p.P446S | Q15554 | protein_coding | tolerated(0.3) | benign(0.185) | TCGA-EI-6513-01 | Colorectum | rectum adenocarcinoma | Male | <65 | III/IV | Unknown | Unknown | SD | |
| TERF2 | SNV | Missense_Mutation | novel | c.727N>A | p.Glu243Lys | p.E243K | Q15554 | protein_coding | deleterious(0) | benign(0.036) | TCGA-EI-6917-01 | Colorectum | rectum adenocarcinoma | Male | <65 | III/IV | Chemotherapy | 5fluorouracil+oxaciplatina+l-folinian | SD |
| TERF2 | SNV | Missense_Mutation | c.968C>T | p.Thr323Ile | p.T323I | Q15554 | protein_coding | deleterious(0) | benign(0.011) | TCGA-G5-6641-01 | Colorectum | rectum adenocarcinoma | Male | >=65 | III/IV | Chemotherapy | oxaliplatin | SD | |
| TERF2 | deletion | Frame_Shift_Del | c.259delG | p.Glu87ArgfsTer72 | p.E87Rfs*72 | Q15554 | protein_coding | TCGA-NH-A5IV-01 | Colorectum | colon adenocarcinoma | Female | >=65 | I/II | Unknown | Unknown | SD |
| Page: 1 2 3 4 5 |
Top |
Related drugs of malignant transformation related genes |
| Identification of chemicals and drugs interact with genes involved in malignant transfromation |
| (DGIdb 4.0) |
| Entrez ID | Symbol | Category | Interaction Types | Drug Claim Name | Drug Name | PMIDs |
| Page: 1 |

Copyright 2023-Present -The University of Texas Health Science Center at Houston |