
|
|||||
|
 | |
| |
| |
| |
| |
| |
|
Gene: SNW1 |
Gene summary for SNW1 |
| Gene information | Species | Human | Gene symbol | SNW1 | Gene ID | 22938 |
| Gene name | SNW domain containing 1 | |
| Gene Alias | Bx42 | |
| Cytomap | 14q24.3 | |
| Gene Type | protein-coding | GO ID | GO:0000122 | UniProtAcc | G3V3A4 |
Top |
Malignant transformation analysis |
| Identification of the aberrant gene expression in precancerous and cancerous lesions by comparing the gene expression of stem-like cells in diseased tissues with normal stem cells |
| Entrez ID | Symbol | Replicates | Species | Organ | Tissue | Adj P-value | Log2FC | Malignancy |
| 22938 | SNW1 | LZE2T | Human | Esophagus | ESCC | 2.86e-05 | 3.95e-01 | 0.082 |
| 22938 | SNW1 | LZE4T | Human | Esophagus | ESCC | 3.11e-12 | 6.30e-01 | 0.0811 |
| 22938 | SNW1 | LZE7T | Human | Esophagus | ESCC | 4.60e-06 | 3.07e-01 | 0.0667 |
| 22938 | SNW1 | LZE8T | Human | Esophagus | ESCC | 3.68e-04 | 1.77e-01 | 0.067 |
| 22938 | SNW1 | LZE20T | Human | Esophagus | ESCC | 2.07e-12 | 4.24e-01 | 0.0662 |
| 22938 | SNW1 | LZE22D1 | Human | Esophagus | HGIN | 1.55e-02 | 3.78e-01 | 0.0595 |
| 22938 | SNW1 | LZE22T | Human | Esophagus | ESCC | 4.82e-05 | 1.08e+00 | 0.068 |
| 22938 | SNW1 | LZE24T | Human | Esophagus | ESCC | 4.99e-19 | 6.58e-01 | 0.0596 |
| 22938 | SNW1 | LZE21T | Human | Esophagus | ESCC | 4.02e-05 | 4.86e-01 | 0.0655 |
| 22938 | SNW1 | LZE6T | Human | Esophagus | ESCC | 3.23e-07 | 2.21e-01 | 0.0845 |
| 22938 | SNW1 | P1T-E | Human | Esophagus | ESCC | 1.93e-13 | 5.82e-01 | 0.0875 |
| 22938 | SNW1 | P2T-E | Human | Esophagus | ESCC | 7.88e-32 | 6.62e-01 | 0.1177 |
| 22938 | SNW1 | P4T-E | Human | Esophagus | ESCC | 3.19e-34 | 7.80e-01 | 0.1323 |
| 22938 | SNW1 | P5T-E | Human | Esophagus | ESCC | 1.32e-17 | 5.06e-01 | 0.1327 |
| 22938 | SNW1 | P8T-E | Human | Esophagus | ESCC | 1.24e-33 | 7.06e-01 | 0.0889 |
| 22938 | SNW1 | P9T-E | Human | Esophagus | ESCC | 3.27e-16 | 4.50e-01 | 0.1131 |
| 22938 | SNW1 | P10T-E | Human | Esophagus | ESCC | 6.85e-58 | 1.08e+00 | 0.116 |
| 22938 | SNW1 | P11T-E | Human | Esophagus | ESCC | 1.27e-20 | 9.36e-01 | 0.1426 |
| 22938 | SNW1 | P12T-E | Human | Esophagus | ESCC | 5.75e-40 | 9.16e-01 | 0.1122 |
| 22938 | SNW1 | P15T-E | Human | Esophagus | ESCC | 3.03e-56 | 1.38e+00 | 0.1149 |
| Page: 1 2 3 4 5 6 7 |
| Tissue | Expression Dynamics | Abbreviation |
| Esophagus | 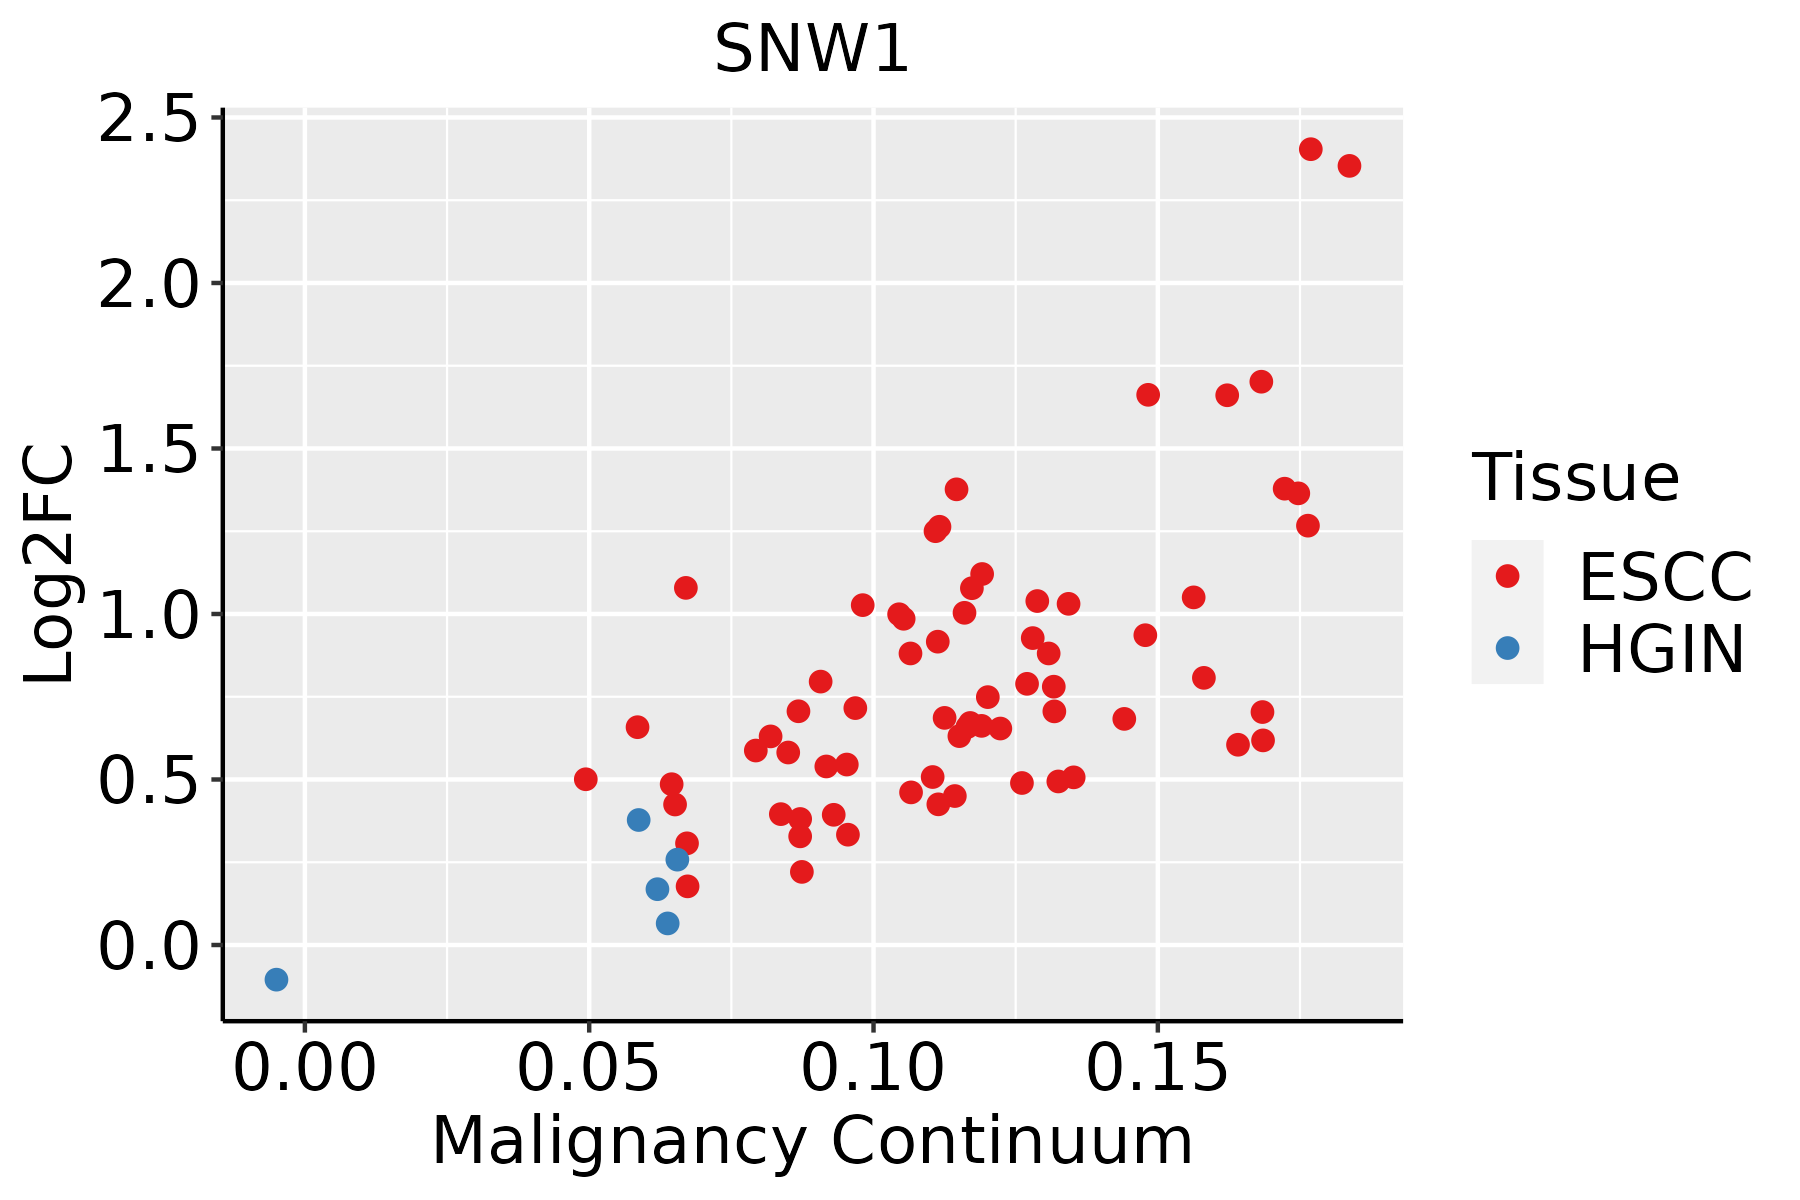 | ESCC: Esophageal squamous cell carcinoma |
| HGIN: High-grade intraepithelial neoplasias | ||
| LGIN: Low-grade intraepithelial neoplasias | ||
| Liver | 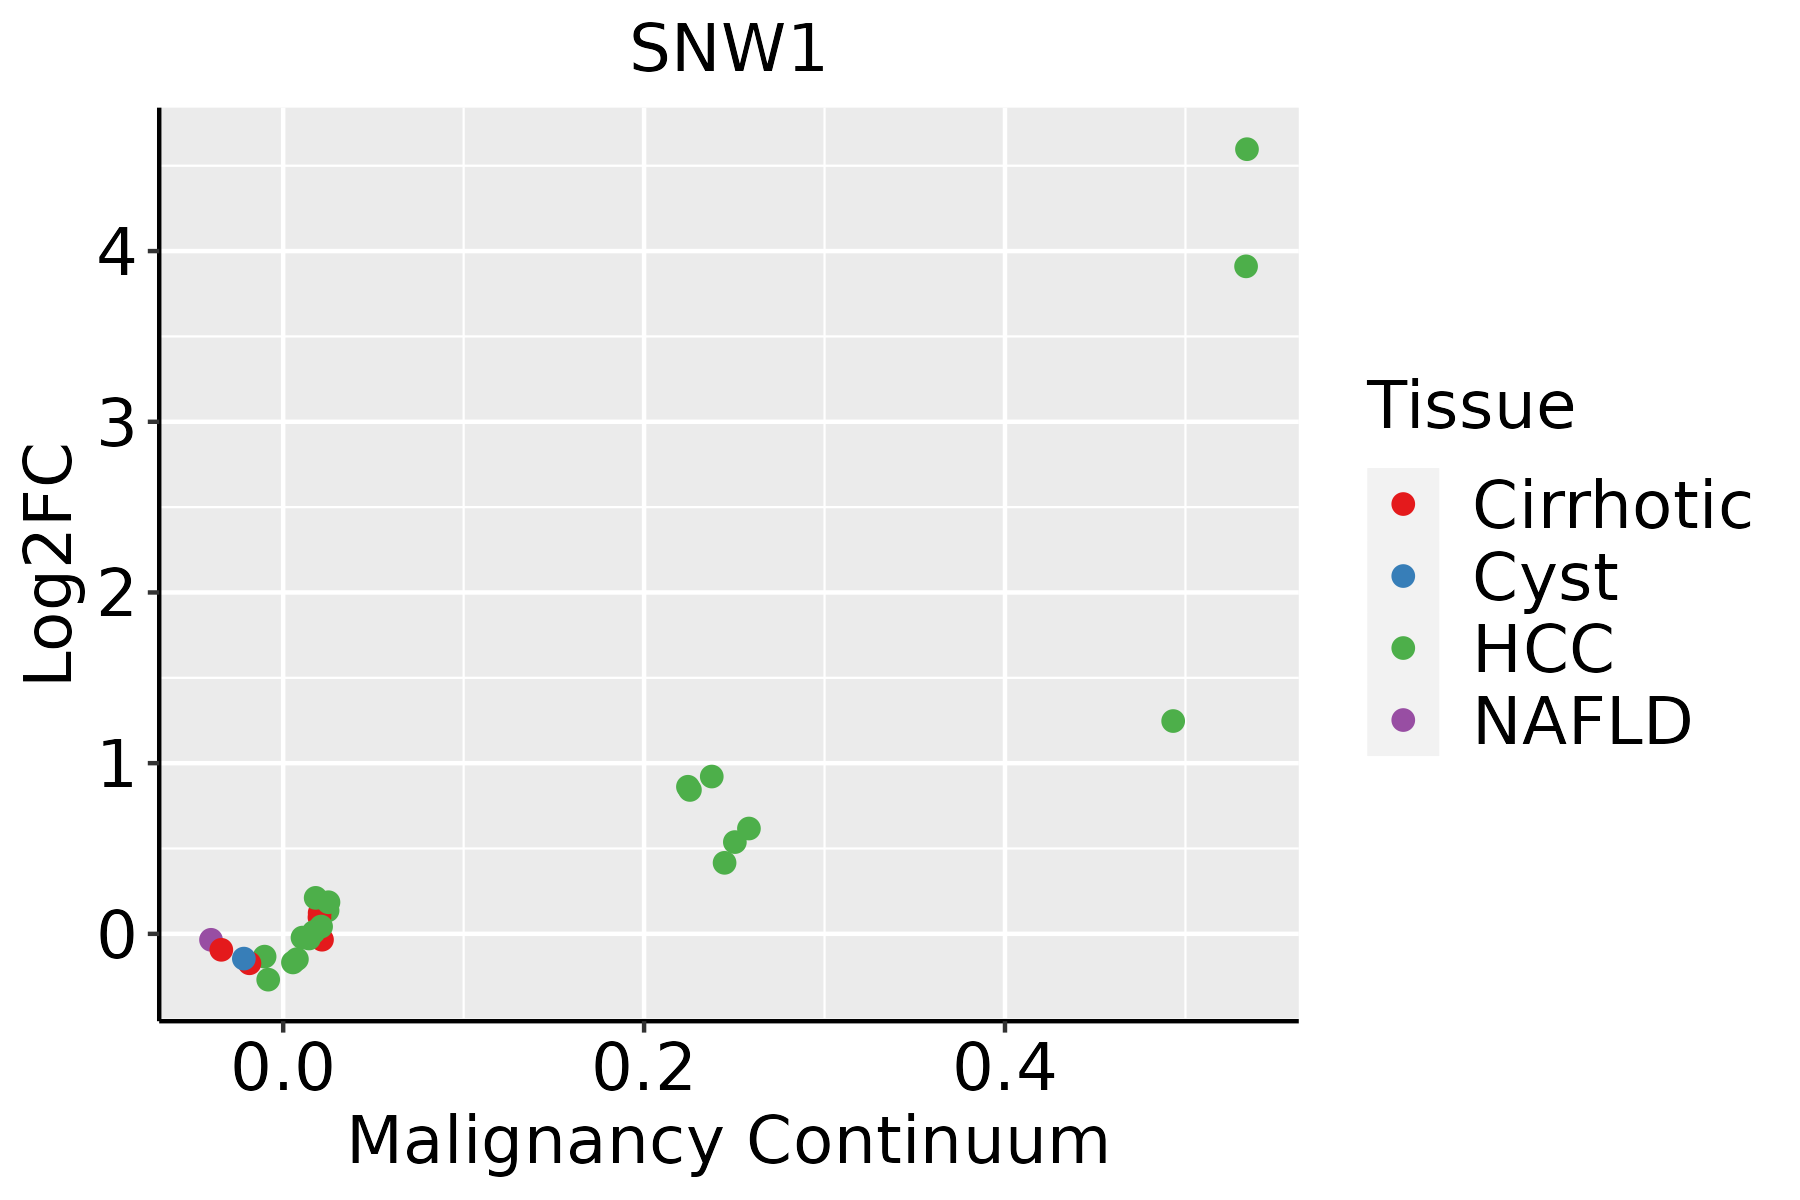 | HCC: Hepatocellular carcinoma |
| NAFLD: Non-alcoholic fatty liver disease | ||
| Oral Cavity | 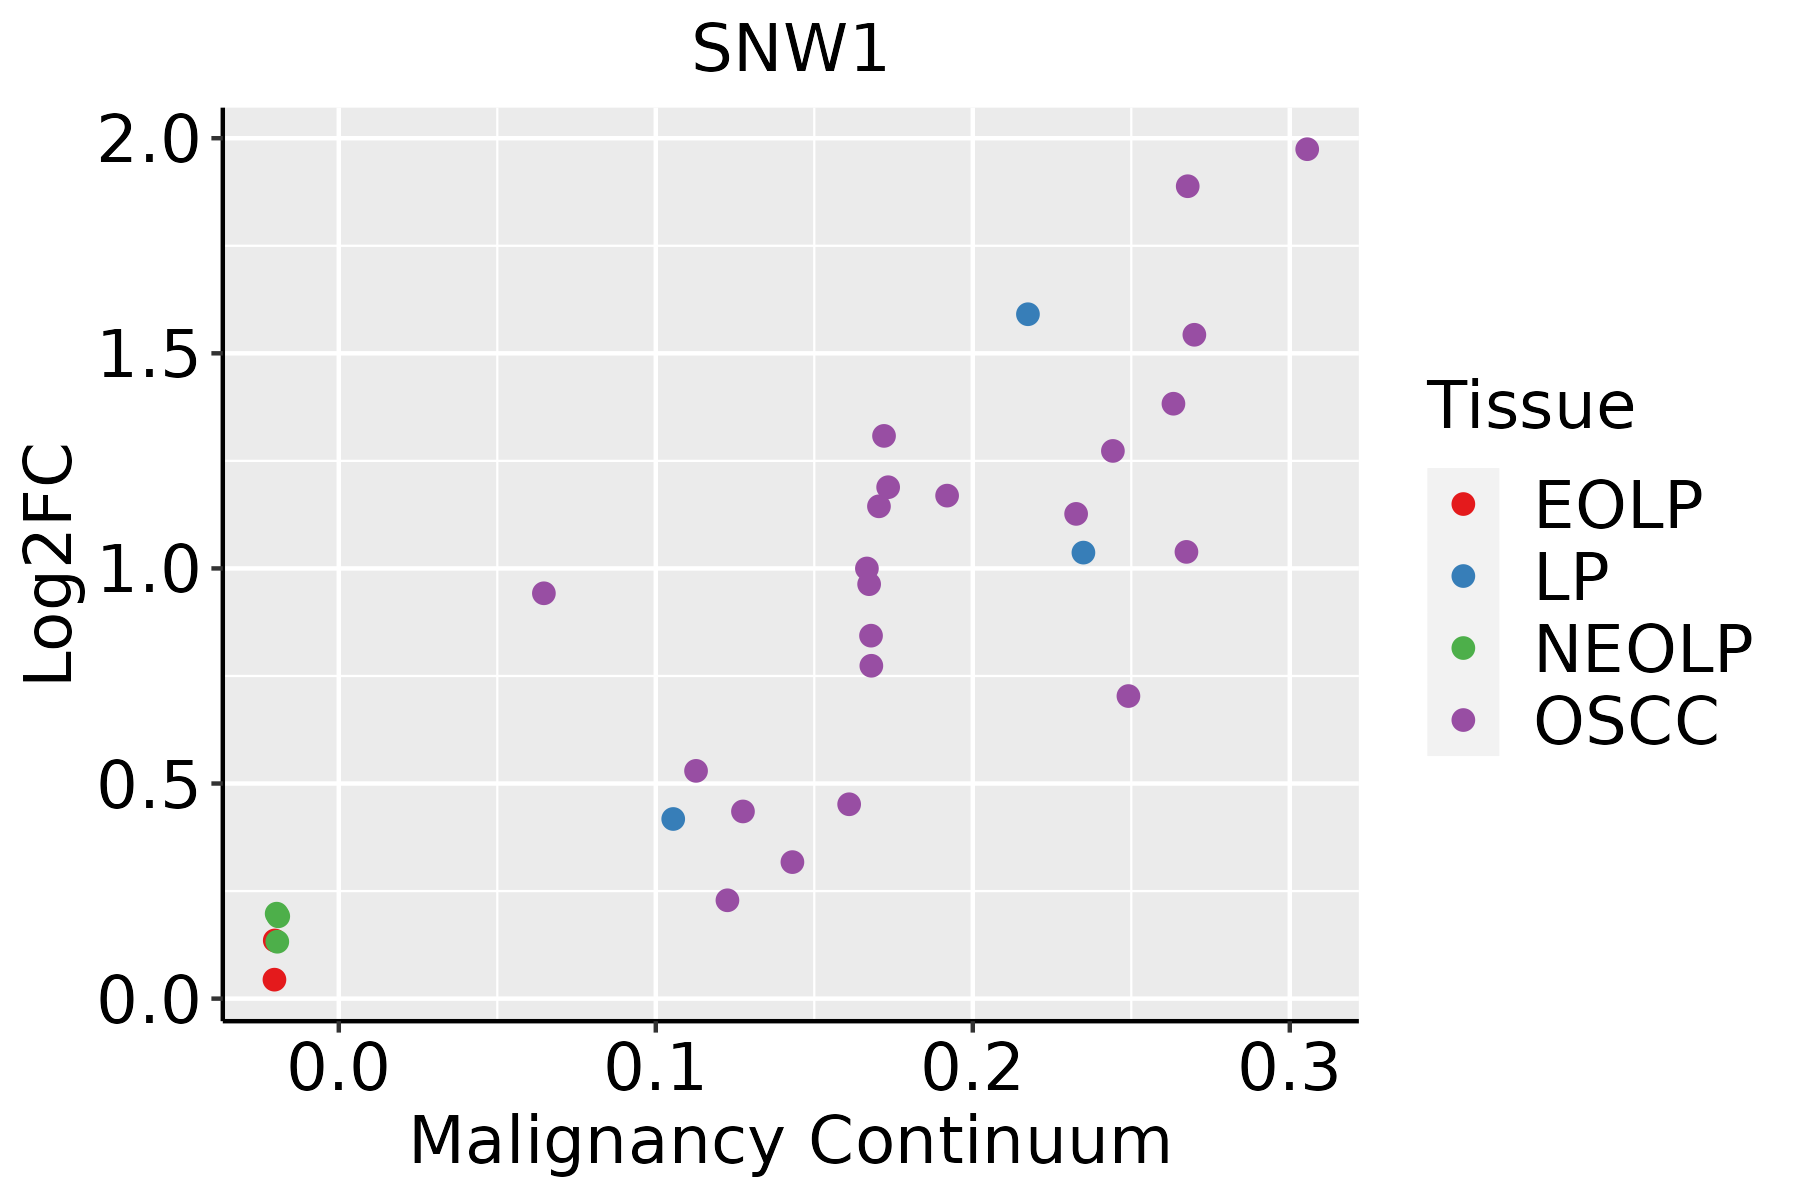 | EOLP: Erosive Oral lichen planus |
| LP: leukoplakia | ||
| NEOLP: Non-erosive oral lichen planus | ||
| OSCC: Oral squamous cell carcinoma | ||
| Skin |  | AK: Actinic keratosis |
| cSCC: Cutaneous squamous cell carcinoma | ||
| SCCIS:squamous cell carcinoma in situ | ||
| Thyroid | 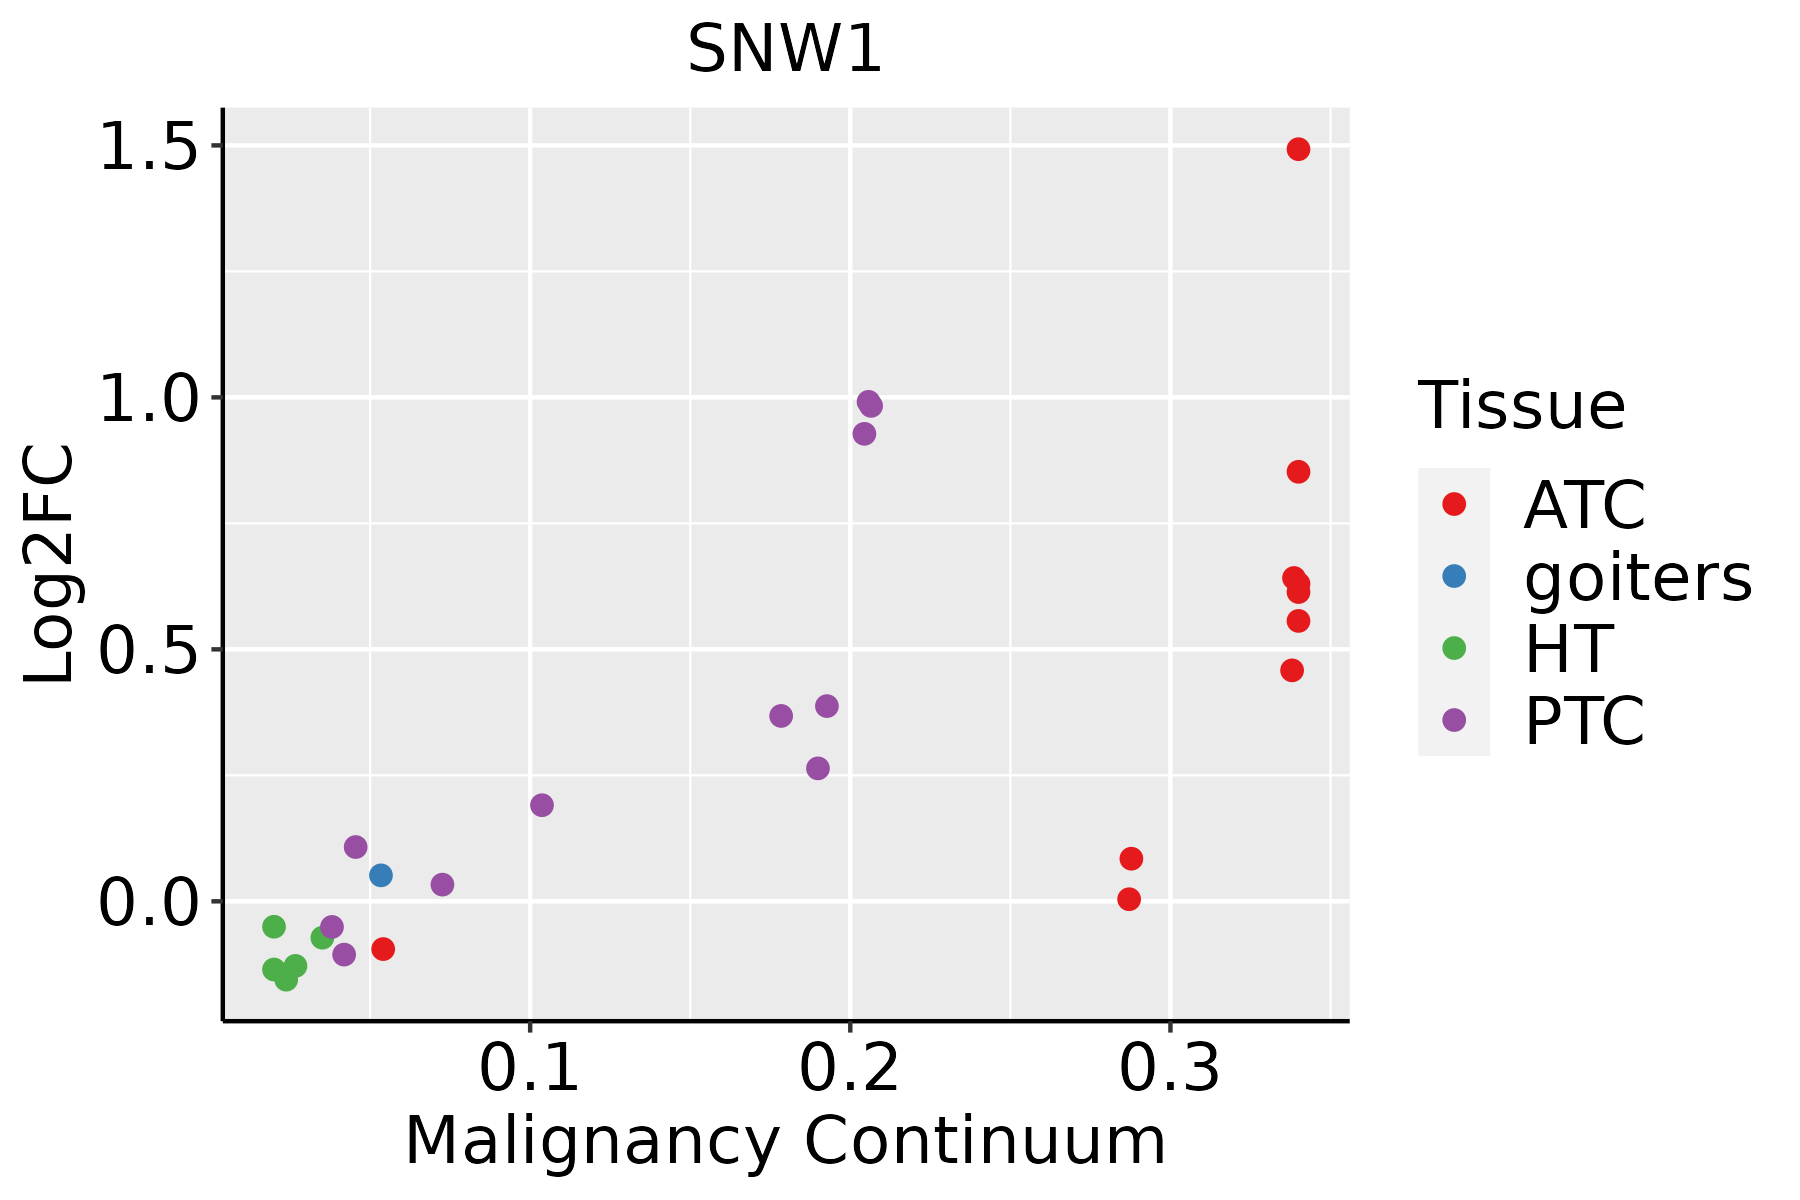 | ATC: Anaplastic thyroid cancer |
| HT: Hashimoto's thyroiditis | ||
| PTC: Papillary thyroid cancer |
| ∗log2FC in expression of this searched gene in stem-like cells from each diseased tissue sample relative to stem-like cells in normal samples in each tissue plotted against the malignancy continuum. Samples are colored based on if they are from different disease stage. |
Top |
Malignant transformation related pathway analysis |
| Find out the enriched GO biological processes and KEGG pathways involved in transition from healthy to precancer to cancer |
| Tissue | Disease Stage | Enriched GO biological Processes |
| Colorectum | AD |  |
| Colorectum | SER |  |
| Colorectum | MSS |  |
| Colorectum | MSI-H |  |
| Colorectum | FAP |  |
| ∗Top 15 enriched GO BP terms are showed in the bar plot of each disease state in each tissue. Each row represents a significant GO biological process which is colored according to the -log10(p.adjust). |
| Page: 1 2 3 4 5 6 7 8 9 |
| GO ID | Tissue | Disease Stage | Description | Gene Ratio | Bg Ratio | pvalue | p.adjust | Count |
| GO:000717817 | Skin | AK | transmembrane receptor protein serine/threonine kinase signaling pathway | 57/1910 | 355/18723 | 3.69e-04 | 3.61e-03 | 57 |
| GO:003166727 | Skin | AK | response to nutrient levels | 72/1910 | 474/18723 | 3.74e-04 | 3.63e-03 | 72 |
| GO:001908018 | Skin | AK | viral gene expression | 21/1910 | 94/18723 | 4.26e-04 | 4.05e-03 | 21 |
| GO:003166924 | Skin | AK | cellular response to nutrient levels | 38/1910 | 215/18723 | 5.37e-04 | 4.86e-03 | 38 |
| GO:00515683 | Skin | AK | histone H3-K4 methylation | 15/1910 | 59/18723 | 6.63e-04 | 5.70e-03 | 15 |
| GO:000717910 | Skin | AK | transforming growth factor beta receptor signaling pathway | 35/1910 | 198/18723 | 8.69e-04 | 7.17e-03 | 35 |
| GO:00325262 | Skin | AK | response to retinoic acid | 22/1910 | 107/18723 | 1.04e-03 | 8.17e-03 | 22 |
| GO:005170215 | Skin | AK | biological process involved in interaction with symbiont | 20/1910 | 94/18723 | 1.11e-03 | 8.63e-03 | 20 |
| GO:00310605 | Skin | AK | regulation of histone methylation | 16/1910 | 69/18723 | 1.30e-03 | 9.85e-03 | 16 |
| GO:00140092 | Skin | AK | glial cell proliferation | 13/1910 | 51/18723 | 1.45e-03 | 1.06e-02 | 13 |
| GO:000758415 | Skin | AK | response to nutrient | 31/1910 | 174/18723 | 1.46e-03 | 1.06e-02 | 31 |
| GO:00515693 | Skin | AK | regulation of histone H3-K4 methylation | 9/1910 | 31/18723 | 2.95e-03 | 1.87e-02 | 9 |
| GO:00434144 | Skin | AK | macromolecule methylation | 48/1910 | 316/18723 | 3.28e-03 | 2.01e-02 | 48 |
| GO:00439234 | Skin | AK | positive regulation by host of viral transcription | 6/1910 | 16/18723 | 3.63e-03 | 2.17e-02 | 6 |
| GO:00190835 | Skin | AK | viral transcription | 12/1910 | 50/18723 | 3.74e-03 | 2.22e-02 | 12 |
| GO:00170157 | Skin | AK | regulation of transforming growth factor beta receptor signaling pathway | 23/1910 | 128/18723 | 5.03e-03 | 2.83e-02 | 23 |
| GO:19038448 | Skin | AK | regulation of cellular response to transforming growth factor beta stimulus | 23/1910 | 131/18723 | 6.70e-03 | 3.54e-02 | 23 |
| GO:00515715 | Skin | AK | positive regulation of histone H3-K4 methylation | 6/1910 | 19/18723 | 9.42e-03 | 4.60e-02 | 6 |
| GO:0008380112 | Skin | cSCC | RNA splicing | 263/4864 | 434/18723 | 2.45e-53 | 5.13e-50 | 263 |
| GO:0000375112 | Skin | cSCC | RNA splicing, via transesterification reactions | 201/4864 | 324/18723 | 4.07e-43 | 5.10e-40 | 201 |
| Page: 1 2 3 4 5 6 7 8 9 10 11 12 13 14 15 16 17 18 19 20 21 22 23 24 25 26 27 28 29 30 31 |
| Pathway ID | Tissue | Disease Stage | Description | Gene Ratio | Bg Ratio | pvalue | p.adjust | qvalue | Count |
| hsa0304018 | Esophagus | HGIN | Spliceosome | 79/1383 | 217/8465 | 3.22e-13 | 7.00e-12 | 5.56e-12 | 79 |
| hsa0516930 | Esophagus | HGIN | Epstein-Barr virus infection | 55/1383 | 202/8465 | 5.13e-05 | 6.19e-04 | 4.92e-04 | 55 |
| hsa052039 | Esophagus | HGIN | Viral carcinogenesis | 53/1383 | 204/8465 | 2.58e-04 | 2.71e-03 | 2.15e-03 | 53 |
| hsa0304019 | Esophagus | HGIN | Spliceosome | 79/1383 | 217/8465 | 3.22e-13 | 7.00e-12 | 5.56e-12 | 79 |
| hsa05169114 | Esophagus | HGIN | Epstein-Barr virus infection | 55/1383 | 202/8465 | 5.13e-05 | 6.19e-04 | 4.92e-04 | 55 |
| hsa0520315 | Esophagus | HGIN | Viral carcinogenesis | 53/1383 | 204/8465 | 2.58e-04 | 2.71e-03 | 2.15e-03 | 53 |
| hsa05169210 | Esophagus | ESCC | Epstein-Barr virus infection | 151/4205 | 202/8465 | 1.55e-13 | 3.45e-12 | 1.77e-12 | 151 |
| hsa0520325 | Esophagus | ESCC | Viral carcinogenesis | 137/4205 | 204/8465 | 2.47e-07 | 1.88e-06 | 9.62e-07 | 137 |
| hsa043306 | Esophagus | ESCC | Notch signaling pathway | 42/4205 | 62/8465 | 2.97e-03 | 7.97e-03 | 4.08e-03 | 42 |
| hsa0304027 | Esophagus | ESCC | Spliceosome | 128/4205 | 217/8465 | 3.31e-03 | 8.79e-03 | 4.50e-03 | 128 |
| hsa0516937 | Esophagus | ESCC | Epstein-Barr virus infection | 151/4205 | 202/8465 | 1.55e-13 | 3.45e-12 | 1.77e-12 | 151 |
| hsa0520335 | Esophagus | ESCC | Viral carcinogenesis | 137/4205 | 204/8465 | 2.47e-07 | 1.88e-06 | 9.62e-07 | 137 |
| hsa0433013 | Esophagus | ESCC | Notch signaling pathway | 42/4205 | 62/8465 | 2.97e-03 | 7.97e-03 | 4.08e-03 | 42 |
| hsa0304037 | Esophagus | ESCC | Spliceosome | 128/4205 | 217/8465 | 3.31e-03 | 8.79e-03 | 4.50e-03 | 128 |
| hsa030407 | Liver | Cirrhotic | Spliceosome | 102/2530 | 217/8465 | 5.69e-08 | 9.47e-07 | 5.84e-07 | 102 |
| hsa0516914 | Liver | Cirrhotic | Epstein-Barr virus infection | 80/2530 | 202/8465 | 1.80e-03 | 8.33e-03 | 5.13e-03 | 80 |
| hsa05203 | Liver | Cirrhotic | Viral carcinogenesis | 76/2530 | 204/8465 | 1.34e-02 | 4.20e-02 | 2.59e-02 | 76 |
| hsa0304012 | Liver | Cirrhotic | Spliceosome | 102/2530 | 217/8465 | 5.69e-08 | 9.47e-07 | 5.84e-07 | 102 |
| hsa0516915 | Liver | Cirrhotic | Epstein-Barr virus infection | 80/2530 | 202/8465 | 1.80e-03 | 8.33e-03 | 5.13e-03 | 80 |
| hsa052031 | Liver | Cirrhotic | Viral carcinogenesis | 76/2530 | 204/8465 | 1.34e-02 | 4.20e-02 | 2.59e-02 | 76 |
| Page: 1 2 3 |
Top |
Cell-cell communication analysis |
| Identification of potential cell-cell interactions between two cell types and their ligand-receptor pairs for different disease states |
| Ligand | Receptor | LRpair | Pathway | Tissue | Disease Stage |
| Page: 1 |
Top |
Single-cell gene regulatory network inference analysis |
| Find out the significant the regulons (TFs) and the target genes of each regulon across cell types for different disease states |
| TF | Cell Type | Tissue | Disease Stage | Target Gene | RSS | Regulon Activity |
| ∗The dot plots of a searched regulon are shown for all cell subpopulations in each disease state of each tissue based on the regulon specific score inferred using pySCENIC and by calculating the average expression. |
| Page: 1 |
Top |
Somatic mutation of malignant transformation related genes |
| Annotation of somatic variants for genes involved in malignant transformation |
| Hugo Symbol | Variant Class | Variant Classification | dbSNP RS | HGVSc | HGVSp | HGVSp Short | SWISSPROT | BIOTYPE | SIFT | PolyPhen | Tumor Sample Barcode | Tissue | Histology | Sex | Age | Stage | Therapy Types | Drugs | Outcome |
| SNW1 | SNV | Missense_Mutation | c.883N>T | p.Asp295Tyr | p.D295Y | protein_coding | deleterious(0) | probably_damaging(0.997) | TCGA-BH-A0DZ-01 | Breast | breast invasive carcinoma | Female | <65 | I/II | Chemotherapy | docetaxel | SD | ||
| SNW1 | SNV | Missense_Mutation | novel | c.422N>T | p.Lys141Ile | p.K141I | protein_coding | tolerated(0.1) | benign(0.026) | TCGA-S3-AA15-01 | Breast | breast invasive carcinoma | Female | <65 | I/II | Chemotherapy | adriamycin | CR | |
| SNW1 | SNV | Missense_Mutation | c.1070N>T | p.His357Leu | p.H357L | protein_coding | tolerated(0.38) | benign(0.007) | TCGA-EA-A78R-01 | Cervix | cervical & endocervical cancer | Female | <65 | I/II | Unknown | Unknown | SD | ||
| SNW1 | SNV | Missense_Mutation | c.228N>C | p.Met76Ile | p.M76I | protein_coding | deleterious(0.01) | possibly_damaging(0.903) | TCGA-IR-A3LA-01 | Cervix | cervical & endocervical cancer | Female | <65 | I/II | Chemotherapy | cisplatin | CR | ||
| SNW1 | SNV | Missense_Mutation | c.401G>T | p.Arg134Met | p.R134M | protein_coding | deleterious(0.04) | benign(0.138) | TCGA-A6-6653-01 | Colorectum | colon adenocarcinoma | Male | >=65 | I/II | Unknown | Unknown | SD | ||
| SNW1 | SNV | Missense_Mutation | c.1052N>C | p.Glu351Ala | p.E351A | protein_coding | tolerated(0.12) | benign(0.272) | TCGA-AA-3672-01 | Colorectum | colon adenocarcinoma | Female | >=65 | III/IV | Unknown | Unknown | SD | ||
| SNW1 | SNV | Missense_Mutation | c.479C>T | p.Ala160Val | p.A160V | protein_coding | deleterious(0.03) | benign(0.26) | TCGA-AA-3845-01 | Colorectum | colon adenocarcinoma | Female | >=65 | I/II | Unknown | Unknown | PD | ||
| SNW1 | SNV | Missense_Mutation | c.883N>A | p.Asp295Asn | p.D295N | protein_coding | deleterious(0) | probably_damaging(0.994) | TCGA-AA-3939-01 | Colorectum | colon adenocarcinoma | Male | >=65 | I/II | Unknown | Unknown | SD | ||
| SNW1 | SNV | Missense_Mutation | c.553N>A | p.Gly185Arg | p.G185R | protein_coding | deleterious(0) | probably_damaging(0.979) | TCGA-F4-6703-01 | Colorectum | colon adenocarcinoma | Male | <65 | I/II | Unknown | Unknown | SD | ||
| SNW1 | SNV | Missense_Mutation | rs759186141 | c.254N>T | p.Ala85Val | p.A85V | protein_coding | tolerated(0.1) | benign(0.089) | TCGA-G4-6628-01 | Colorectum | colon adenocarcinoma | Male | >=65 | I/II | Unknown | Unknown | SD |
| Page: 1 2 3 4 5 6 |
Top |
Related drugs of malignant transformation related genes |
| Identification of chemicals and drugs interact with genes involved in malignant transfromation |
| (DGIdb 4.0) |
| Entrez ID | Symbol | Category | Interaction Types | Drug Claim Name | Drug Name | PMIDs |
| 22938 | SNW1 | NA | TRANSFORMING GROWTH FACTOR | 15149847 |
| Page: 1 |

Copyright 2023-Present -The University of Texas Health Science Center at Houston |