Schematic overview of the cellular and molecular mechanisms involved in the cancer progression, including the proposed cellular and molecular mechanisms in cancer cells trajectory. AT1: alveolar type 1 cells; AT2: alveolar type 2 cells; AAH: atypical adenomatous hyperplasia; AIS: adenocarcinoma in situ; MIA: minimally invasive adenocarcinoma; IA: invasive adenocarcinoma; EMT: epithelial-mesenchymal transition

Home

Download

Statistics

Help

Contact

Center for Computational Systems Medicine
leaf

Gene summary

leaf

Malignant transformation analysis

leaf

Malignant transformation related pathway analysis

leaf

Cell-cell communication analysis

leaf

Single-cell gene regulatory network inference analysis

leaf

Somatic mutation of malignant transformation related genes

leaf

Related drugs of malignant transformation related genes

Gene: SLC25A1

Gene summary for SLC25A1

check button Gene summary.

Gene informationSpeciesHuman
Gene symbol

SLC25A1

Gene ID

6576

Gene namesolute carrier family 25 member 1
Gene AliasCMS23
Cytomap22q11.21
Gene Typeprotein-coding
GO ID

GO:0005975

UniProtAcc

D9HTE9


Top

Malignant transformation analysis

check button Identification of the aberrant gene expression in precancerous and cancerous lesions by comparing the gene expression of stem-like cells in diseased tissues with normal stem cells
check button Malignant transformation involving gene list.
Entrez IDSymbolReplicatesSpeciesOrganTissueAdj P-valueLog2FCMalignancy
6576SLC25A1GSM4909281HumanBreastIDC1.23e-042.69e-010.21
6576SLC25A1GSM4909291HumanBreastIDC1.74e-267.71e-010.1753
6576SLC25A1GSM4909304HumanBreastIDC9.75e-276.31e-010.1636
6576SLC25A1GSM4909311HumanBreastIDC3.56e-05-2.54e-020.1534
6576SLC25A1GSM4909315HumanBreastIDC4.47e-022.69e-010.21
6576SLC25A1GSM4909317HumanBreastIDC1.78e-165.27e-010.1355
6576SLC25A1GSM4909319HumanBreastIDC3.63e-10-4.10e-020.1563
6576SLC25A1GSM4909320HumanBreastIDC9.92e-032.70e-010.1575
6576SLC25A1GSM4909321HumanBreastIDC6.39e-082.37e-010.1559
6576SLC25A1DCIS2HumanBreastDCIS3.71e-401.24e-010.0085
6576SLC25A1HTA11_3410_2000001011HumanColorectumAD1.67e-081.58e-010.0155
6576SLC25A1HTA11_2487_2000001011HumanColorectumSER5.17e-229.58e-01-0.1808
6576SLC25A1HTA11_1938_2000001011HumanColorectumAD1.45e-134.96e-01-0.0811
6576SLC25A1HTA11_78_2000001011HumanColorectumAD3.30e-094.39e-01-0.1088
6576SLC25A1HTA11_347_2000001011HumanColorectumAD5.19e-235.27e-01-0.1954
6576SLC25A1HTA11_411_2000001011HumanColorectumSER1.96e-101.12e+00-0.2602
6576SLC25A1HTA11_2112_2000001011HumanColorectumSER1.23e-069.45e-01-0.2196
6576SLC25A1HTA11_3361_2000001011HumanColorectumAD4.70e-095.36e-01-0.1207
6576SLC25A1HTA11_83_2000001011HumanColorectumSER5.90e-105.75e-01-0.1526
6576SLC25A1HTA11_696_2000001011HumanColorectumAD6.77e-277.00e-01-0.1464
Page: 1 2 3 4 5 6 7 8 

check button Transcriptomic changes along malignancy continuum.
TissueExpression DynamicsAbbreviation
BreastThe image shows the transcriptomic changes along malignancy continuum.log2FC in expression of this searched gene in stem-like cells from each diseased tissue sample relative to stem-like cells in normal samples in each tissue plotted against the malignancy continuum. Samples are colored based on if they are from different disease stage.
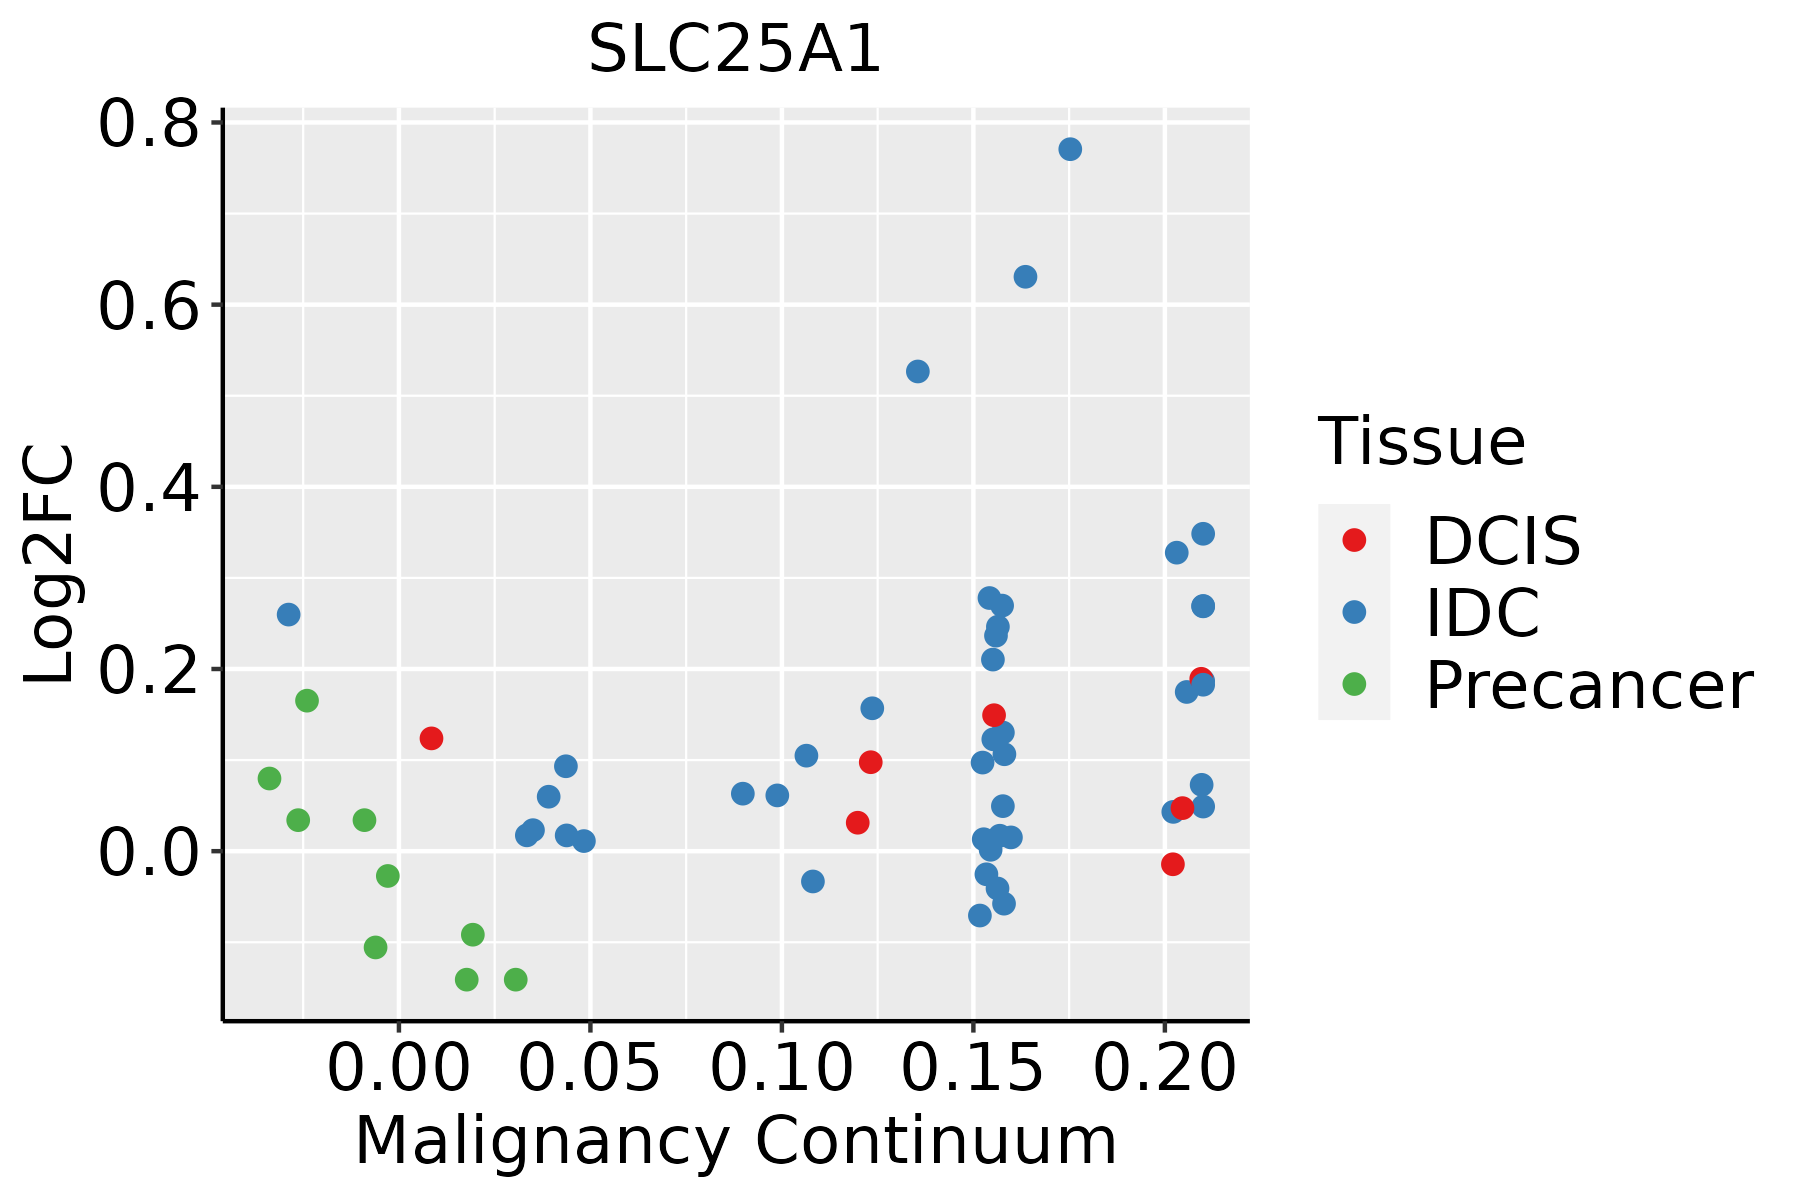
IDC: Invasive ductal carcinoma
DCIS: Ductal carcinoma in situ
Precancer(BRCA1-mut): Precancerous lesion from BRCA1 mutation carriers
Colorectum (GSE201348)The image shows the transcriptomic changes along malignancy continuum.log2FC in expression of this searched gene in stem-like cells from each diseased tissue sample relative to stem-like cells in normal samples in each tissue plotted against the malignancy continuum. Samples are colored based on if they are from different disease stage.FAP: Familial adenomatous polyposis
CRC: Colorectal cancer
Colorectum (HTA11)The image shows the transcriptomic changes along malignancy continuum.log2FC in expression of this searched gene in stem-like cells from each diseased tissue sample relative to stem-like cells in normal samples in each tissue plotted against the malignancy continuum. Samples are colored based on if they are from different disease stage.AD: Adenomas
SER: Sessile serrated lesions
MSI-H: Microsatellite-high colorectal cancer
MSS: Microsatellite stable colorectal cancer
EsophagusThe image shows the transcriptomic changes along malignancy continuum.log2FC in expression of this searched gene in stem-like cells from each diseased tissue sample relative to stem-like cells in normal samples in each tissue plotted against the malignancy continuum. Samples are colored based on if they are from different disease stage.
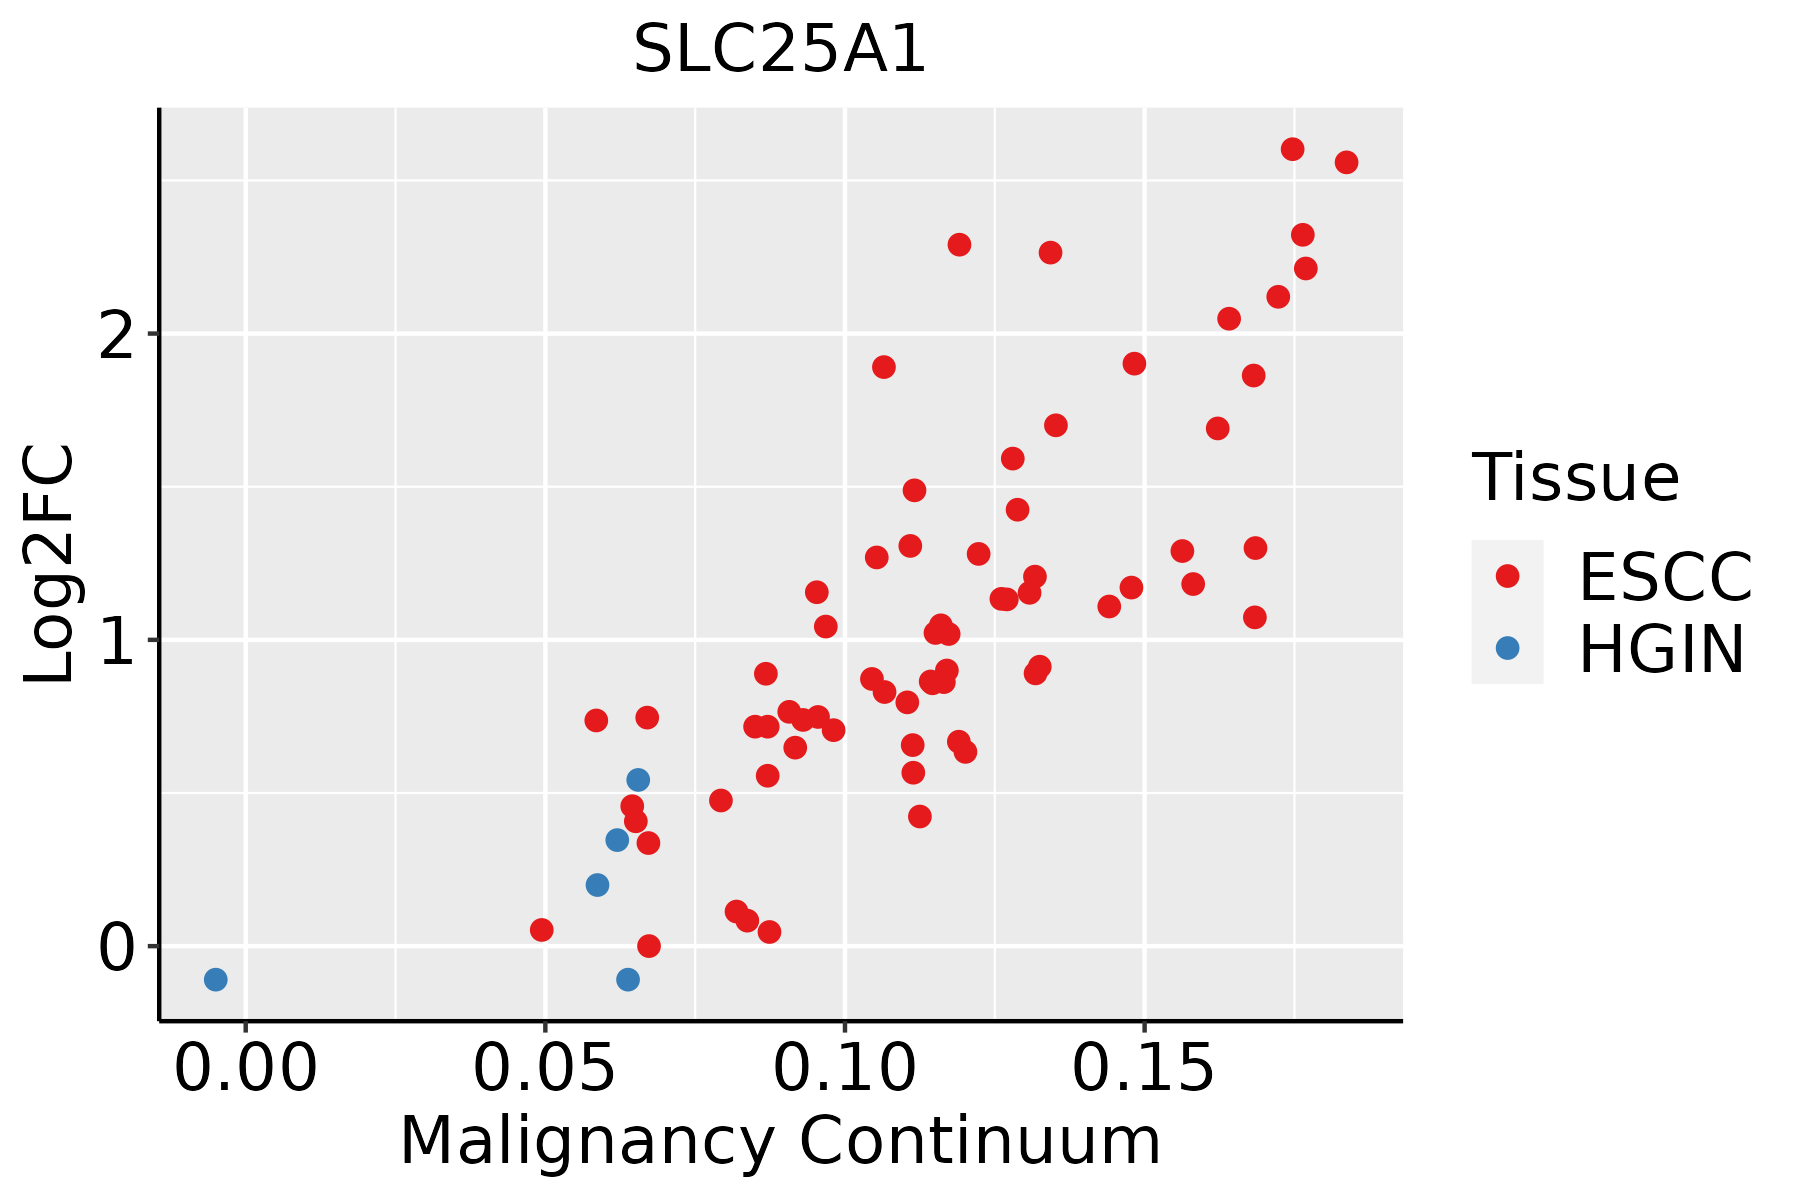
ESCC: Esophageal squamous cell carcinoma
HGIN: High-grade intraepithelial neoplasias
LGIN: Low-grade intraepithelial neoplasias
LiverThe image shows the transcriptomic changes along malignancy continuum.log2FC in expression of this searched gene in stem-like cells from each diseased tissue sample relative to stem-like cells in normal samples in each tissue plotted against the malignancy continuum. Samples are colored based on if they are from different disease stage.HCC: Hepatocellular carcinoma
NAFLD: Non-alcoholic fatty liver disease
Oral CavityThe image shows the transcriptomic changes along malignancy continuum.log2FC in expression of this searched gene in stem-like cells from each diseased tissue sample relative to stem-like cells in normal samples in each tissue plotted against the malignancy continuum. Samples are colored based on if they are from different disease stage.
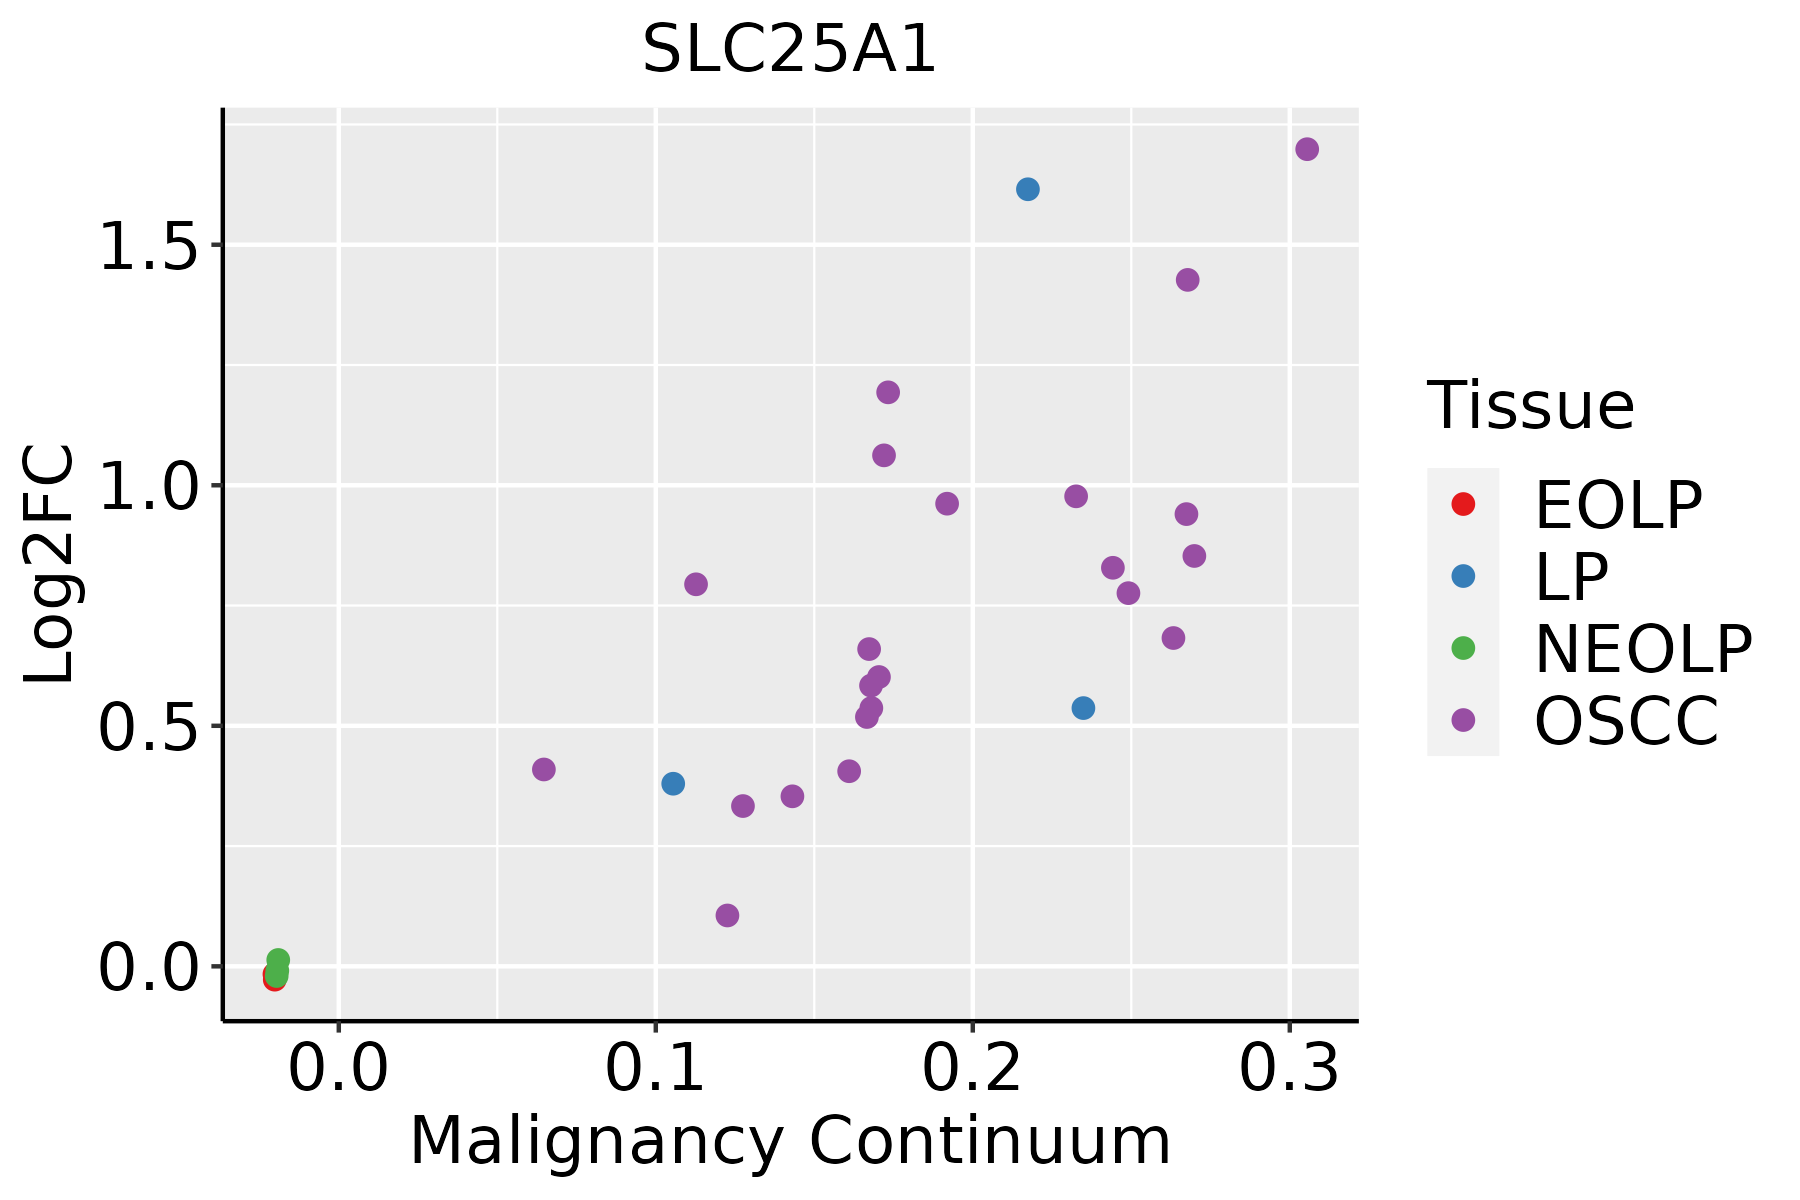
EOLP: Erosive Oral lichen planus
LP: leukoplakia
NEOLP: Non-erosive oral lichen planus
OSCC: Oral squamous cell carcinoma
ProstateThe image shows the transcriptomic changes along malignancy continuum.log2FC in expression of this searched gene in stem-like cells from each diseased tissue sample relative to stem-like cells in normal samples in each tissue plotted against the malignancy continuum. Samples are colored based on if they are from different disease stage.
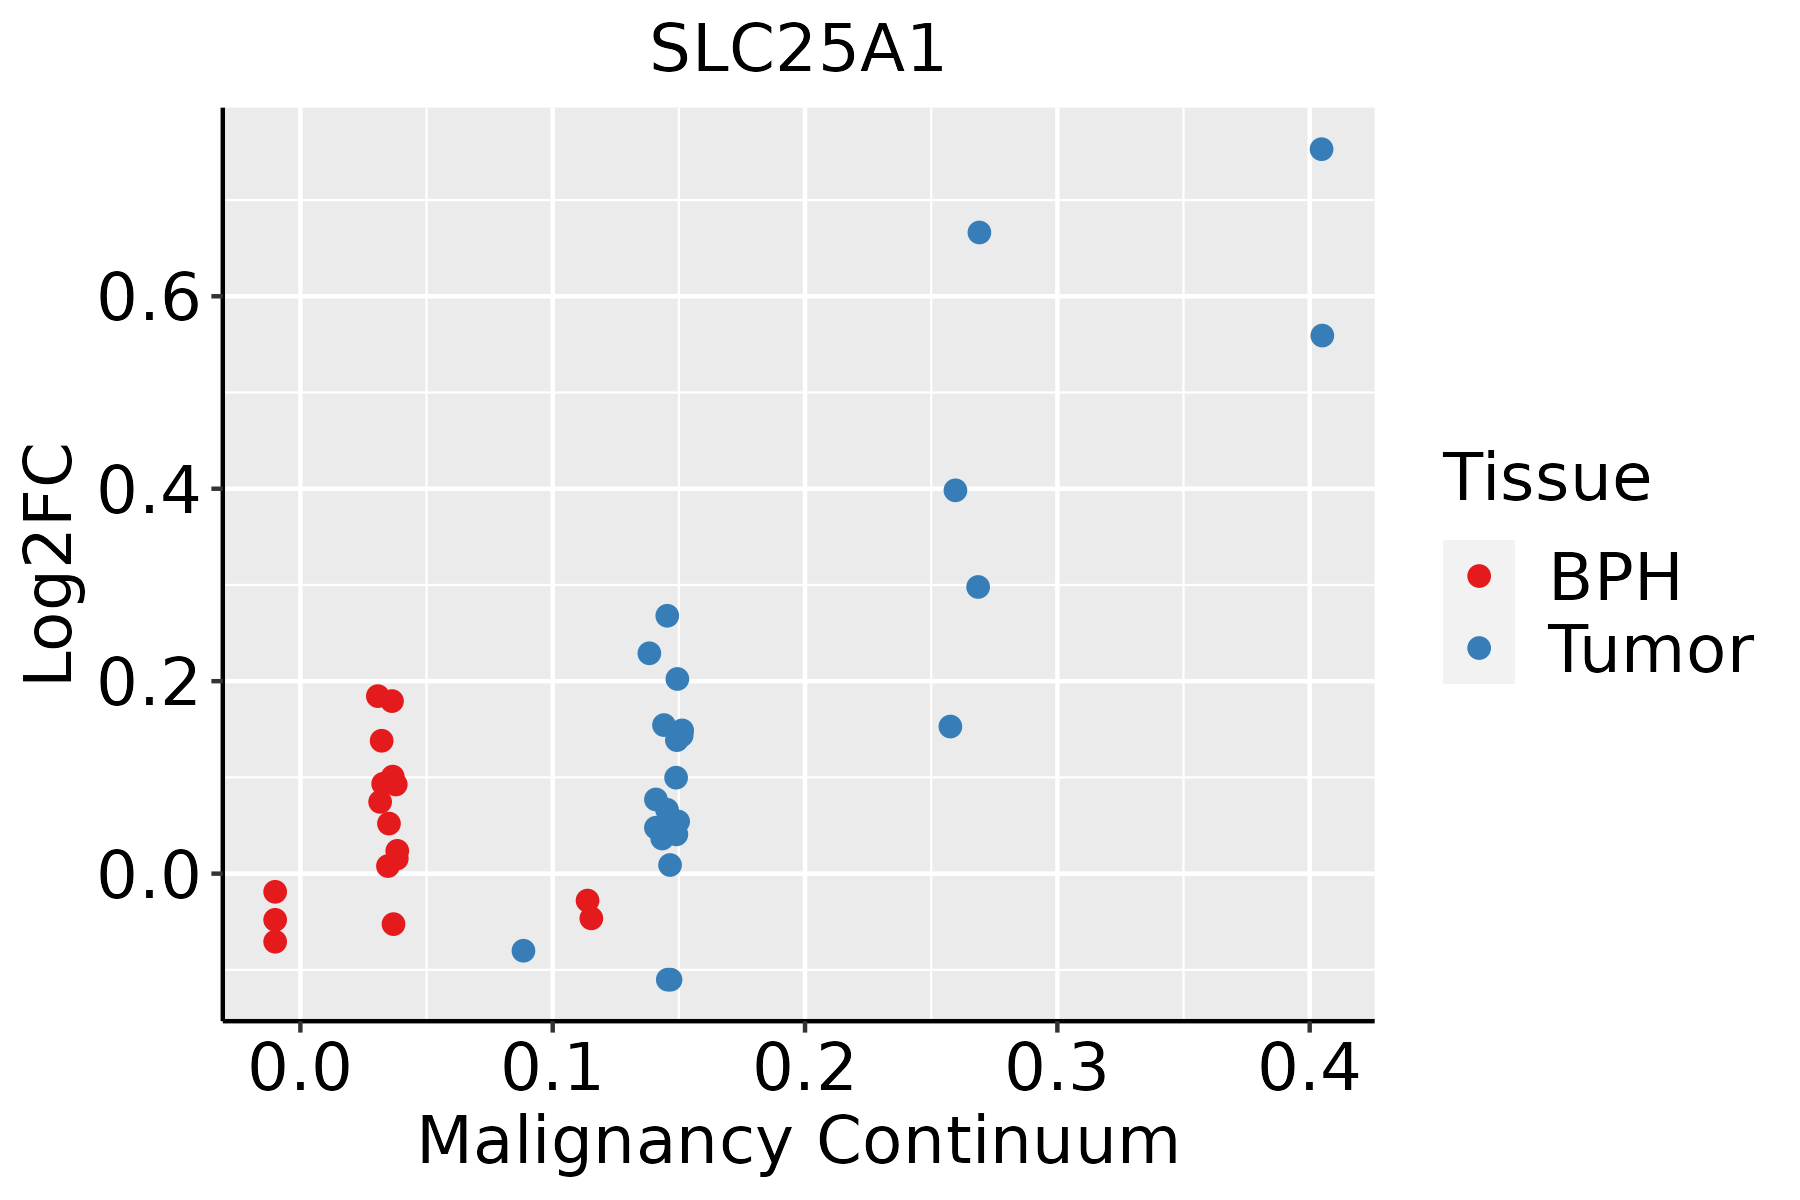
BPH: Benign Prostatic Hyperplasia
SkinThe image shows the transcriptomic changes along malignancy continuum.log2FC in expression of this searched gene in stem-like cells from each diseased tissue sample relative to stem-like cells in normal samples in each tissue plotted against the malignancy continuum. Samples are colored based on if they are from different disease stage.
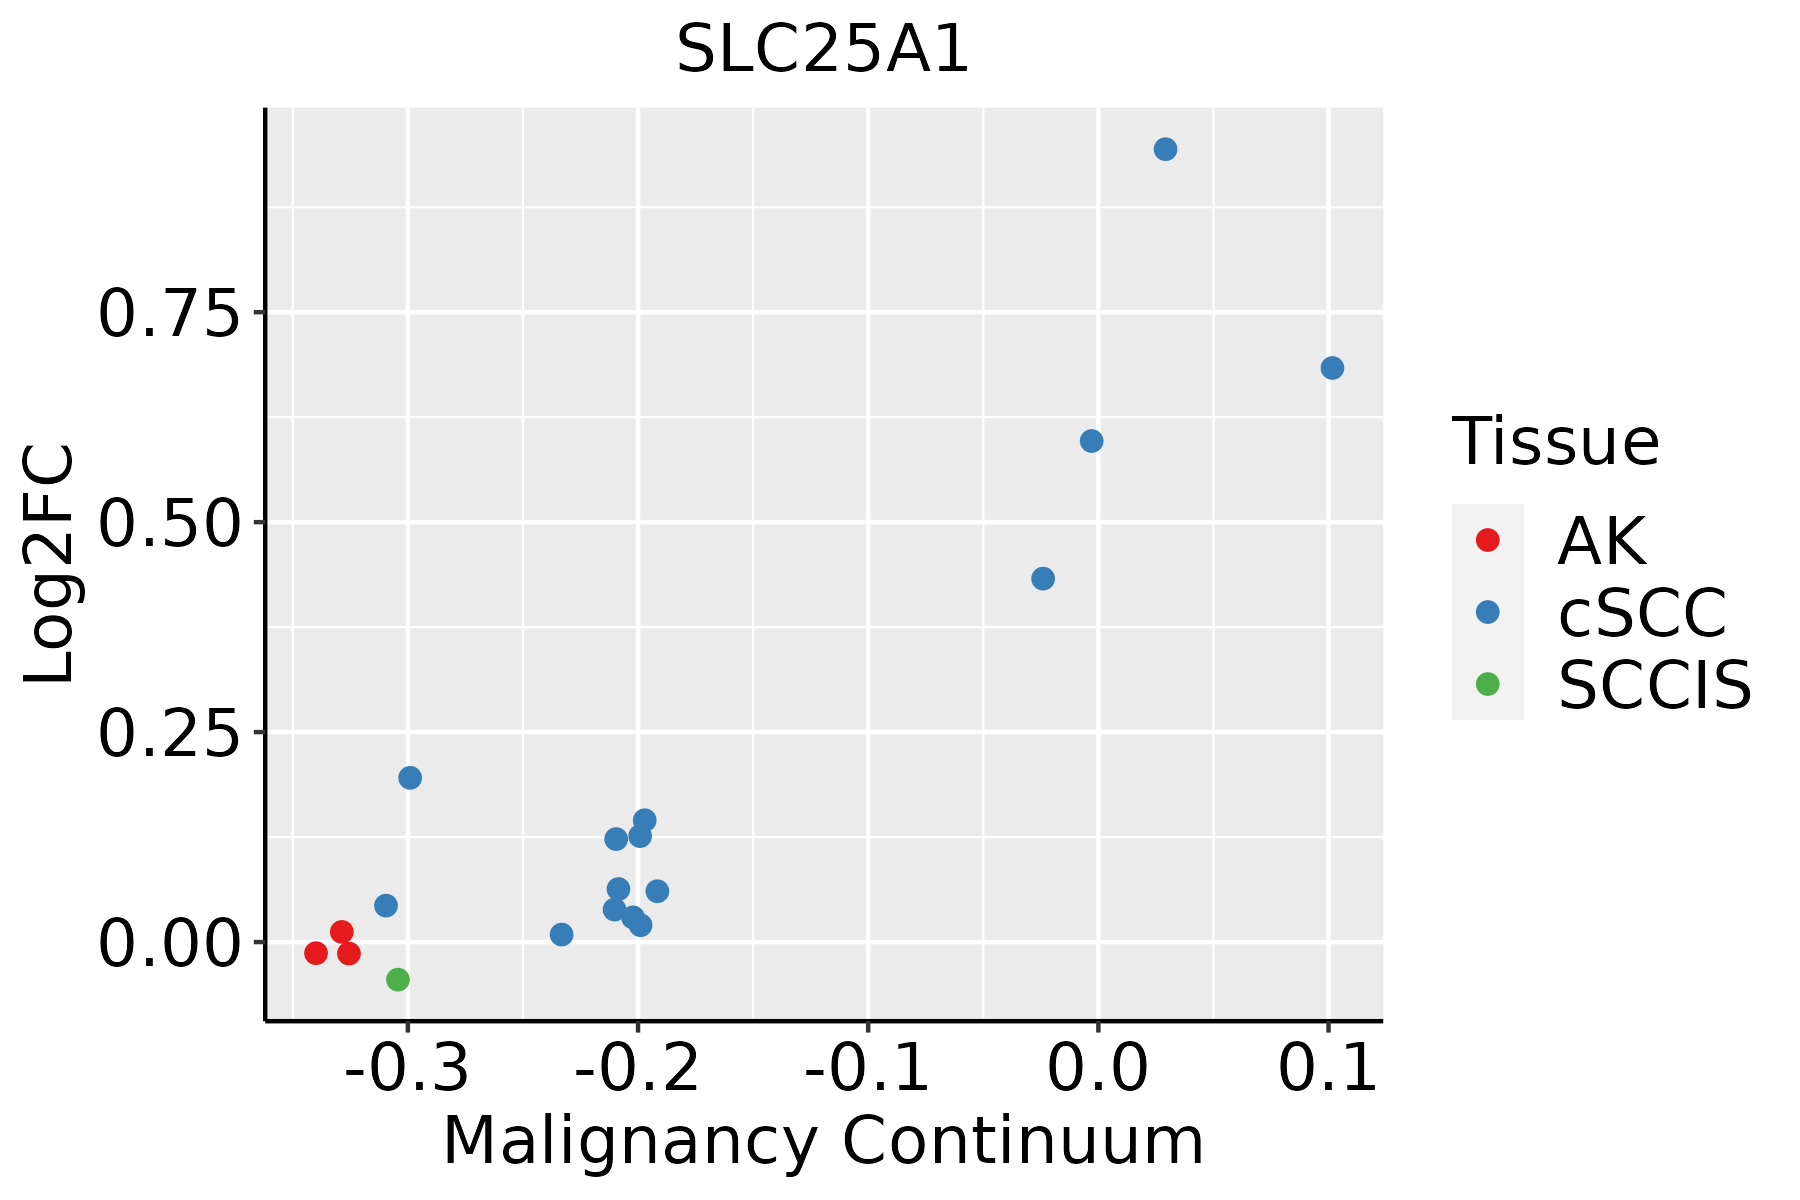
AK: Actinic keratosis
cSCC: Cutaneous squamous cell carcinoma
SCCIS:squamous cell carcinoma in situ
ThyroidThe image shows the transcriptomic changes along malignancy continuum.log2FC in expression of this searched gene in stem-like cells from each diseased tissue sample relative to stem-like cells in normal samples in each tissue plotted against the malignancy continuum. Samples are colored based on if they are from different disease stage.ATC: Anaplastic thyroid cancer
HT: Hashimoto's thyroiditis
PTC: Papillary thyroid cancer
∗log2FC in expression of this searched gene in stem-like cells from each diseased tissue sample relative to stem-like cells in normal samples in each tissue plotted against the malignancy continuum. Samples are colored based on if they are from different disease stage.

Top

Malignant transformation related pathway analysis

check buttonFind out the enriched GO biological processes and KEGG pathways involved in transition from healthy to precancer to cancer
check button Figure of enriched GO biological processes.
TissueDisease StageEnriched GO biological Processes
ColorectumADGO analysis - Figure of enriched GO biological processes: Top 15 enriched GO BP terms are showed in the bar plot of each disease state in each tissue. Each row represents a significant GO biological process which is colored according to the -log10(p.adjust).
ColorectumSERGO analysis - Figure of enriched GO biological processes: Top 15 enriched GO BP terms are showed in the bar plot of each disease state in each tissue. Each row represents a significant GO biological process which is colored according to the -log10(p.adjust).
ColorectumMSSGO analysis - Figure of enriched GO biological processes: Top 15 enriched GO BP terms are showed in the bar plot of each disease state in each tissue. Each row represents a significant GO biological process which is colored according to the -log10(p.adjust).
ColorectumMSI-HGO analysis - Figure of enriched GO biological processes: Top 15 enriched GO BP terms are showed in the bar plot of each disease state in each tissue. Each row represents a significant GO biological process which is colored according to the -log10(p.adjust).
ColorectumFAPGO analysis - Figure of enriched GO biological processes: Top 15 enriched GO BP terms are showed in the bar plot of each disease state in each tissue. Each row represents a significant GO biological process which is colored according to the -log10(p.adjust).
∗Top 15 enriched GO BP terms are showed in the bar plot of each disease state in each tissue. Each row represents a significant GO biological process which is colored according to the -log10(p.adjust).
Page: 1 2 3 4 5 6 7 8 9 

check button Enriched GO biological processes.
GO IDTissueDisease StageDescriptionGene RatioBg Ratiopvaluep.adjustCount
GO:00091416LiverCirrhoticnucleoside triphosphate metabolic process43/4634112/187239.31e-046.62e-0343
GO:00725225LiverCirrhoticpurine-containing compound biosynthetic process69/4634200/187231.22e-038.24e-0369
GO:00061645LiverCirrhoticpurine nucleotide biosynthetic process65/4634191/187232.42e-031.46e-0265
GO:00196271LiverCirrhoticurea metabolic process8/463412/187232.59e-031.53e-028
GO:00719411LiverCirrhoticnitrogen cycle metabolic process8/463412/187232.59e-031.53e-028
GO:00091446LiverCirrhoticpurine nucleoside triphosphate metabolic process34/463488/187232.68e-031.57e-0234
GO:00091425LiverCirrhoticnucleoside triphosphate biosynthetic process33/463485/187232.81e-031.63e-0233
GO:0033866LiverCirrhoticnucleoside bisphosphate biosynthetic process25/463460/187232.92e-031.67e-0225
GO:0034030LiverCirrhoticribonucleoside bisphosphate biosynthetic process25/463460/187232.92e-031.67e-0225
GO:0034033LiverCirrhoticpurine nucleoside bisphosphate biosynthetic process25/463460/187232.92e-031.67e-0225
GO:00090661LiverCirrhoticaspartate family amino acid metabolic process21/463449/187234.13e-032.21e-0221
GO:00091455LiverCirrhoticpurine nucleoside triphosphate biosynthetic process27/463469/187235.74e-032.88e-0227
GO:00092055LiverCirrhoticpurine ribonucleoside triphosphate metabolic process31/463482/187235.87e-032.95e-0231
GO:0035384LiverCirrhoticthioester biosynthetic process19/463445/187237.53e-033.57e-0219
GO:0071616LiverCirrhoticacyl-CoA biosynthetic process19/463445/187237.53e-033.57e-0219
GO:00092065LiverCirrhoticpurine ribonucleoside triphosphate biosynthetic process26/463468/187239.37e-034.29e-0226
GO:000609122LiverHCCgeneration of precursor metabolites and energy340/7958490/187234.04e-342.85e-31340
GO:004533312LiverHCCcellular respiration171/7958230/187236.35e-231.26e-20171
GO:004603422LiverHCCATP metabolic process198/7958277/187238.30e-231.55e-20198
GO:001598022LiverHCCenergy derivation by oxidation of organic compounds221/7958318/187231.02e-221.86e-20221
Page: 1 2 3 4 5 6 7 8 9 10 11 12 13 14 15 16 17 18 19 20 21 22 23 24 25 26 27 28 29 30 31 32 33 34 35 36 37 38 39 

check button Enriched KEGG pathways.
Pathway IDTissueDisease StageDescriptionGene RatioBg Ratiopvaluep.adjustqvalueCount
Page: 1 

Top

Cell-cell communication analysis

check buttonIdentification of potential cell-cell interactions between two cell types and their ligand-receptor pairs for different disease states
LigandReceptorLRpairPathwayTissueDisease Stage
Page: 1 

Top

Single-cell gene regulatory network inference analysis

check buttonFind out the significant the regulons (TFs) and the target genes of each regulon across cell types for different disease states
TFCell TypeTissueDisease StageTarget GeneRSSRegulon Activity
∗The dot plots of a searched regulon are shown for all cell subpopulations in each disease state of each tissue based on the regulon specific score inferred using pySCENIC and by calculating the average expression.
Page: 1 

Top

Somatic mutation of malignant transformation related genes

check buttonAnnotation of somatic variants for genes involved in malignant transformation
Hugo SymbolVariant ClassVariant ClassificationdbSNP RSHGVScHGVSpHGVSp ShortSWISSPROTBIOTYPESIFTPolyPhenTumor Sample BarcodeTissueHistologySexAgeStageTherapy TypesDrugsOutcome
SLC25A1SNVMissense_Mutationc.709N>Ap.Gly237Argp.G237RP53007protein_codingdeleterious(0)probably_damaging(0.996)TCGA-C8-A27B-01Breastbreast invasive carcinomaFemale<65I/IIChemotherapy5-fluorouracilCR
SLC25A1SNVMissense_Mutationrs782258354c.694N>Ap.Ala232Thrp.A232TP53007protein_codingdeleterious(0.03)possibly_damaging(0.846)TCGA-LL-A7SZ-01Breastbreast invasive carcinomaFemale<65I/IIChemotherapyadriamycinCR
SLC25A1insertionFrame_Shift_Insnovelc.226_227insTTACCTTCTCACCTATCAGCTGCTTTTACTTTCAGAATTGp.Arg76LeufsTer26p.R76Lfs*26P53007protein_codingTCGA-A2-A0D1-01Breastbreast invasive carcinomaFemale>=65I/IIChemotherapytaxotereSD
SLC25A1SNVMissense_Mutationc.358G>Ap.Asp120Asnp.D120NP53007protein_codingtolerated(0.27)benign(0.007)TCGA-EX-A1H5-01Cervixcervical & endocervical cancerFemale<65I/IIUnknownUnknownSD
SLC25A1SNVMissense_Mutationrs431905510c.845N>Ap.Arg282Hisp.R282HP53007protein_codingdeleterious(0)probably_damaging(0.975)TCGA-QG-A5Z2-01Colorectumcolon adenocarcinomaMale<65I/IIUnknownUnknownSD
SLC25A1SNVMissense_Mutationnovelc.593N>Ap.Arg198Hisp.R198HP53007protein_codingdeleterious(0)probably_damaging(0.998)TCGA-AP-A051-01Endometriumuterine corpus endometrioid carcinomaFemale>=65I/IIUnknownUnknownSD
SLC25A1SNVMissense_Mutationnovelc.631N>Ap.Gly211Argp.G211RP53007protein_codingdeleterious(0.02)benign(0.445)TCGA-AP-A1DK-01Endometriumuterine corpus endometrioid carcinomaFemale<65I/IIUnknownUnknownSD
SLC25A1SNVMissense_Mutationnovelc.631N>Tp.Gly211Trpp.G211WP53007protein_codingdeleterious(0)probably_damaging(0.994)TCGA-AP-A1DM-01Endometriumuterine corpus endometrioid carcinomaFemale<65I/IIUnknownUnknownSD
SLC25A1SNVMissense_Mutationc.457N>Ap.Asp153Asnp.D153NP53007protein_codingdeleterious(0.03)possibly_damaging(0.709)TCGA-AP-A1E0-01Endometriumuterine corpus endometrioid carcinomaFemale<65III/IVChemotherapypaclitaxelSD
SLC25A1SNVMissense_Mutationnovelc.725N>Gp.Asp242Glyp.D242GP53007protein_codingdeleterious(0)probably_damaging(0.999)TCGA-B5-A3FA-01Endometriumuterine corpus endometrioid carcinomaFemale>=65I/IIUnknownUnknownSD
Page: 1 2 

Top

Related drugs of malignant transformation related genes

check buttonIdentification of chemicals and drugs interact with genes involved in malignant transfromation
(DGIdb 4.0)
Entrez IDSymbolCategoryInteraction TypesDrug Claim NameDrug NamePMIDs
6576SLC25A1TRANSPORTER, DRUGGABLE GENOMEinhibitor178101413
Page: 1