
|
|||||
|
 | |
| |
| |
| |
| |
| |
|
Gene: PRDX2 |
Gene summary for PRDX2 |
| Gene information | Species | Human | Gene symbol | PRDX2 | Gene ID | 7001 |
| Gene name | peroxiredoxin 2 | |
| Gene Alias | HEL-S-2a | |
| Cytomap | 19p13.13 | |
| Gene Type | protein-coding | GO ID | GO:0000165 | UniProtAcc | P32119 |
Top |
Malignant transformation analysis |
| Identification of the aberrant gene expression in precancerous and cancerous lesions by comparing the gene expression of stem-like cells in diseased tissues with normal stem cells |
| Entrez ID | Symbol | Replicates | Species | Organ | Tissue | Adj P-value | Log2FC | Malignancy |
| 7001 | PRDX2 | GSM4909281 | Human | Breast | IDC | 1.18e-02 | 3.08e-01 | 0.21 |
| 7001 | PRDX2 | GSM4909282 | Human | Breast | IDC | 6.87e-39 | 6.09e-01 | -0.0288 |
| 7001 | PRDX2 | GSM4909285 | Human | Breast | IDC | 4.48e-60 | 8.36e-01 | 0.21 |
| 7001 | PRDX2 | GSM4909286 | Human | Breast | IDC | 6.82e-03 | 1.06e-01 | 0.1081 |
| 7001 | PRDX2 | GSM4909287 | Human | Breast | IDC | 4.67e-12 | 3.41e-01 | 0.2057 |
| 7001 | PRDX2 | GSM4909289 | Human | Breast | IDC | 7.11e-06 | 4.58e-01 | 0.1064 |
| 7001 | PRDX2 | GSM4909290 | Human | Breast | IDC | 2.92e-18 | 5.08e-01 | 0.2096 |
| 7001 | PRDX2 | GSM4909291 | Human | Breast | IDC | 1.69e-03 | 2.53e-01 | 0.1753 |
| 7001 | PRDX2 | GSM4909293 | Human | Breast | IDC | 5.60e-14 | 4.91e-01 | 0.1581 |
| 7001 | PRDX2 | GSM4909294 | Human | Breast | IDC | 7.78e-26 | 4.87e-01 | 0.2022 |
| 7001 | PRDX2 | GSM4909296 | Human | Breast | IDC | 1.93e-27 | 3.68e-01 | 0.1524 |
| 7001 | PRDX2 | GSM4909297 | Human | Breast | IDC | 2.46e-22 | 1.06e-01 | 0.1517 |
| 7001 | PRDX2 | GSM4909301 | Human | Breast | IDC | 2.42e-04 | 2.52e-01 | 0.1577 |
| 7001 | PRDX2 | GSM4909302 | Human | Breast | IDC | 2.82e-07 | 2.14e-01 | 0.1545 |
| 7001 | PRDX2 | GSM4909304 | Human | Breast | IDC | 6.66e-42 | 7.09e-01 | 0.1636 |
| 7001 | PRDX2 | GSM4909305 | Human | Breast | IDC | 1.98e-02 | 1.96e-01 | 0.0436 |
| 7001 | PRDX2 | GSM4909306 | Human | Breast | IDC | 1.79e-20 | 5.49e-01 | 0.1564 |
| 7001 | PRDX2 | GSM4909307 | Human | Breast | IDC | 1.45e-15 | 4.35e-01 | 0.1569 |
| 7001 | PRDX2 | GSM4909308 | Human | Breast | IDC | 2.01e-34 | 6.23e-01 | 0.158 |
| 7001 | PRDX2 | GSM4909309 | Human | Breast | IDC | 4.81e-02 | 9.66e-02 | 0.0483 |
| Page: 1 2 3 4 5 6 7 8 9 10 11 12 13 14 15 |
| Tissue | Expression Dynamics | Abbreviation |
| Breast | 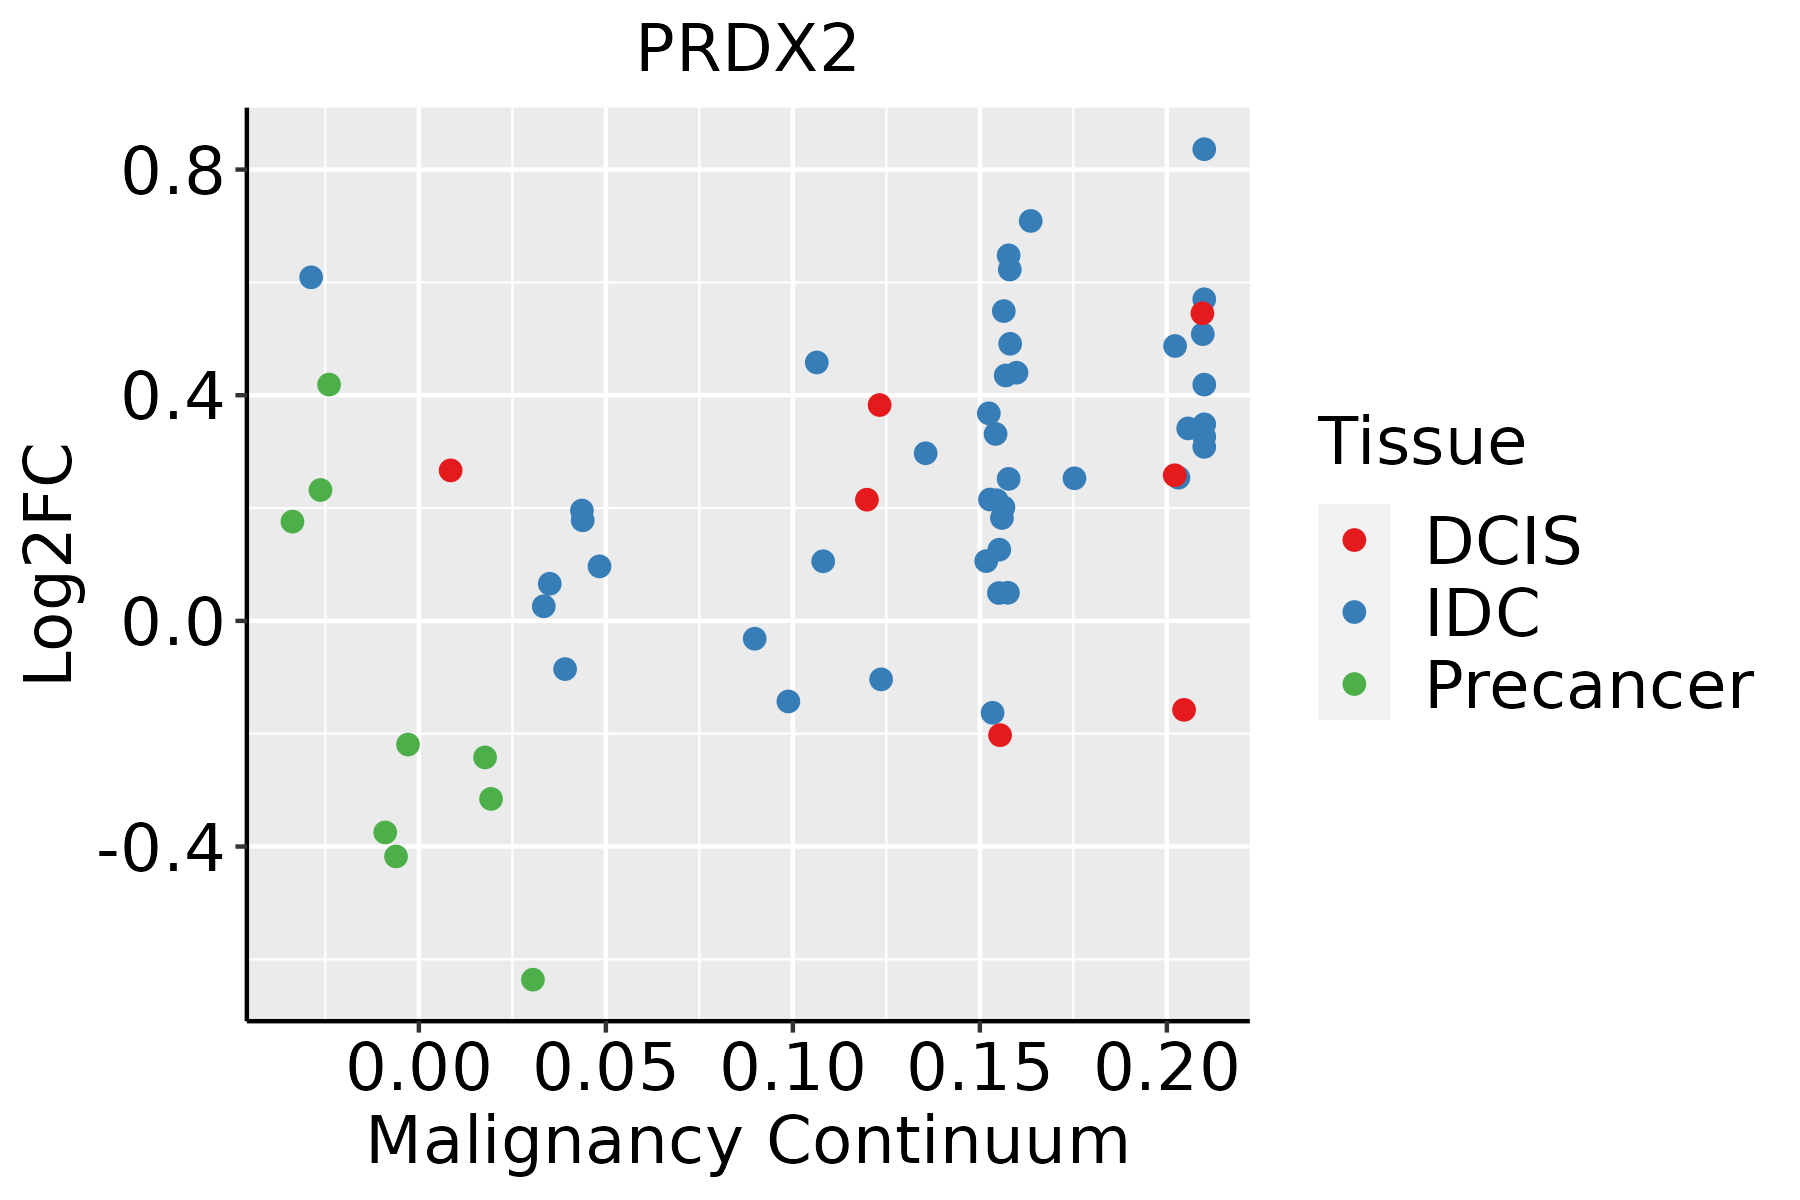 | IDC: Invasive ductal carcinoma |
| DCIS: Ductal carcinoma in situ | ||
| Precancer(BRCA1-mut): Precancerous lesion from BRCA1 mutation carriers | ||
| Cervix | 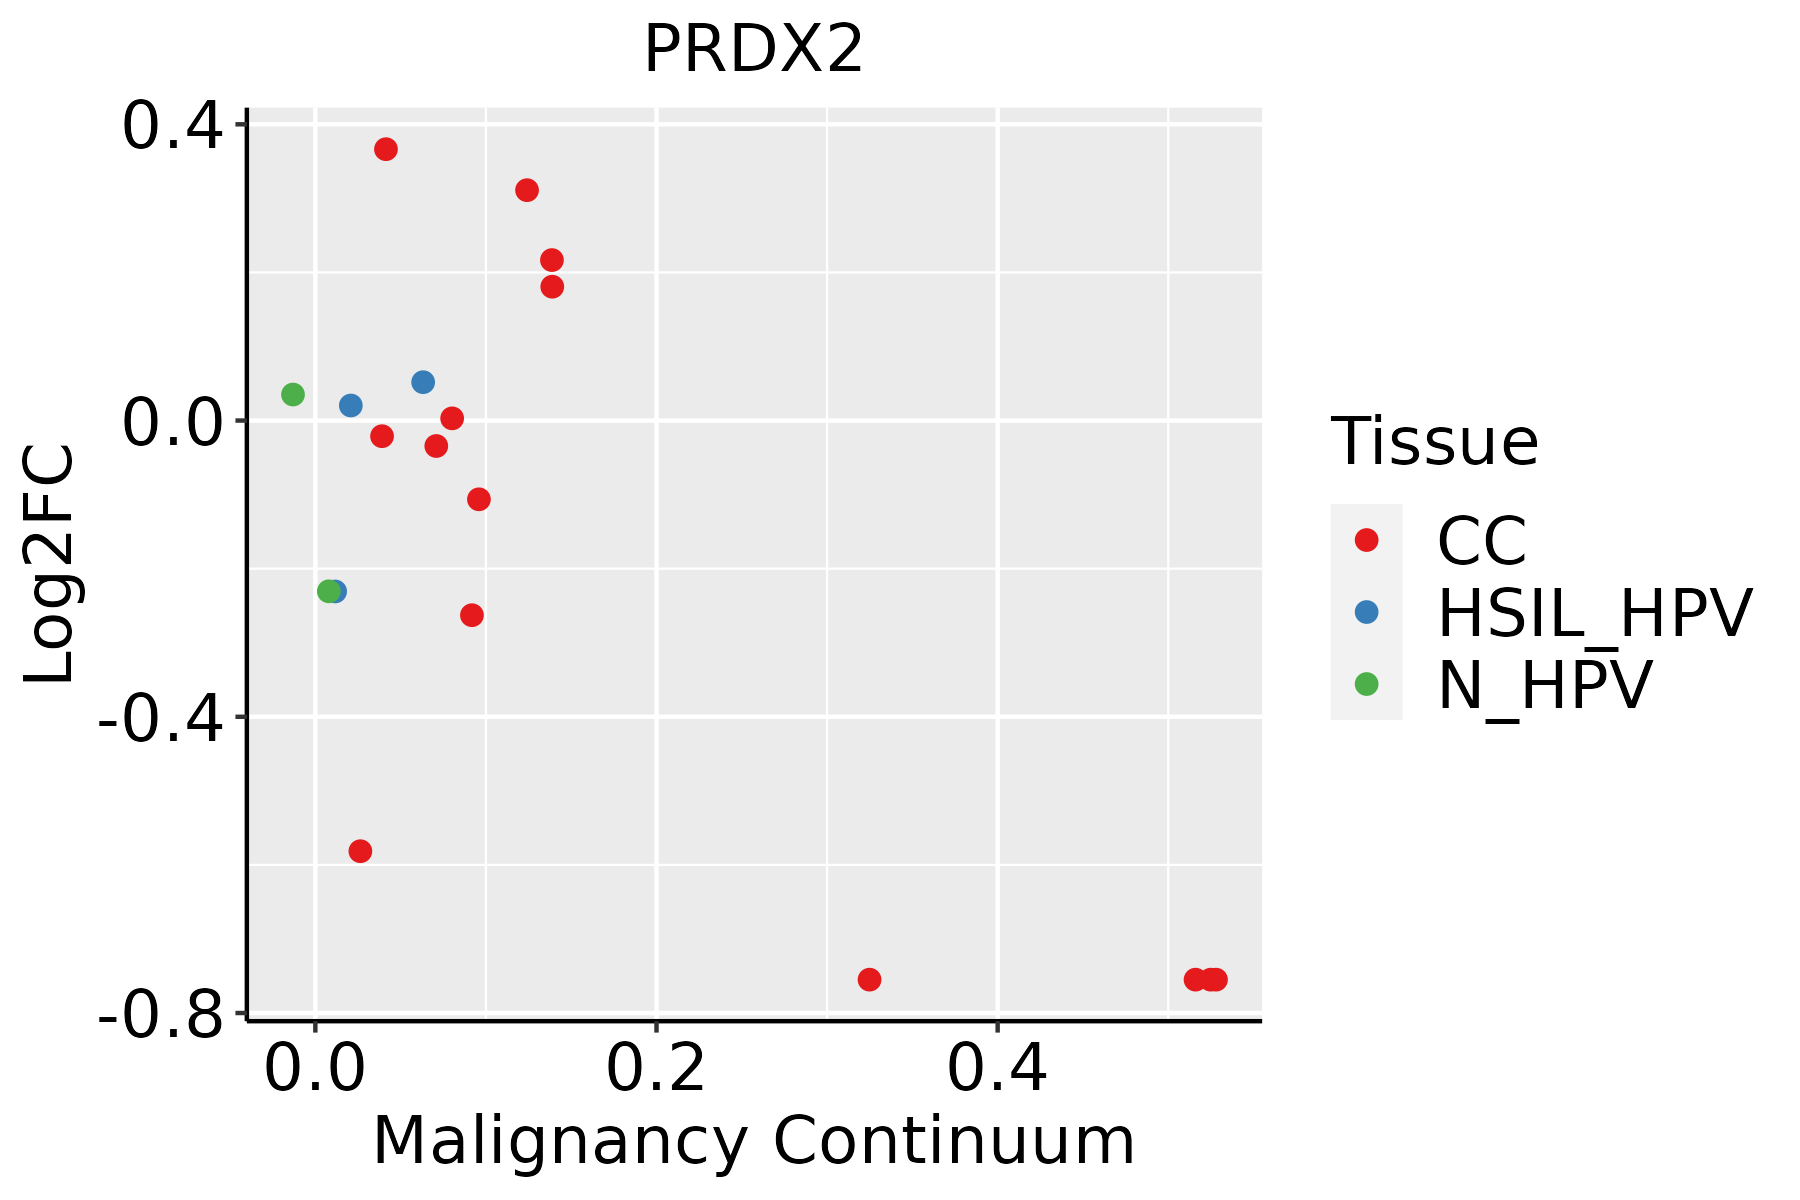 | CC: Cervix cancer |
| HSIL_HPV: HPV-infected high-grade squamous intraepithelial lesions | ||
| N_HPV: HPV-infected normal cervix | ||
| Colorectum (GSE201348) | 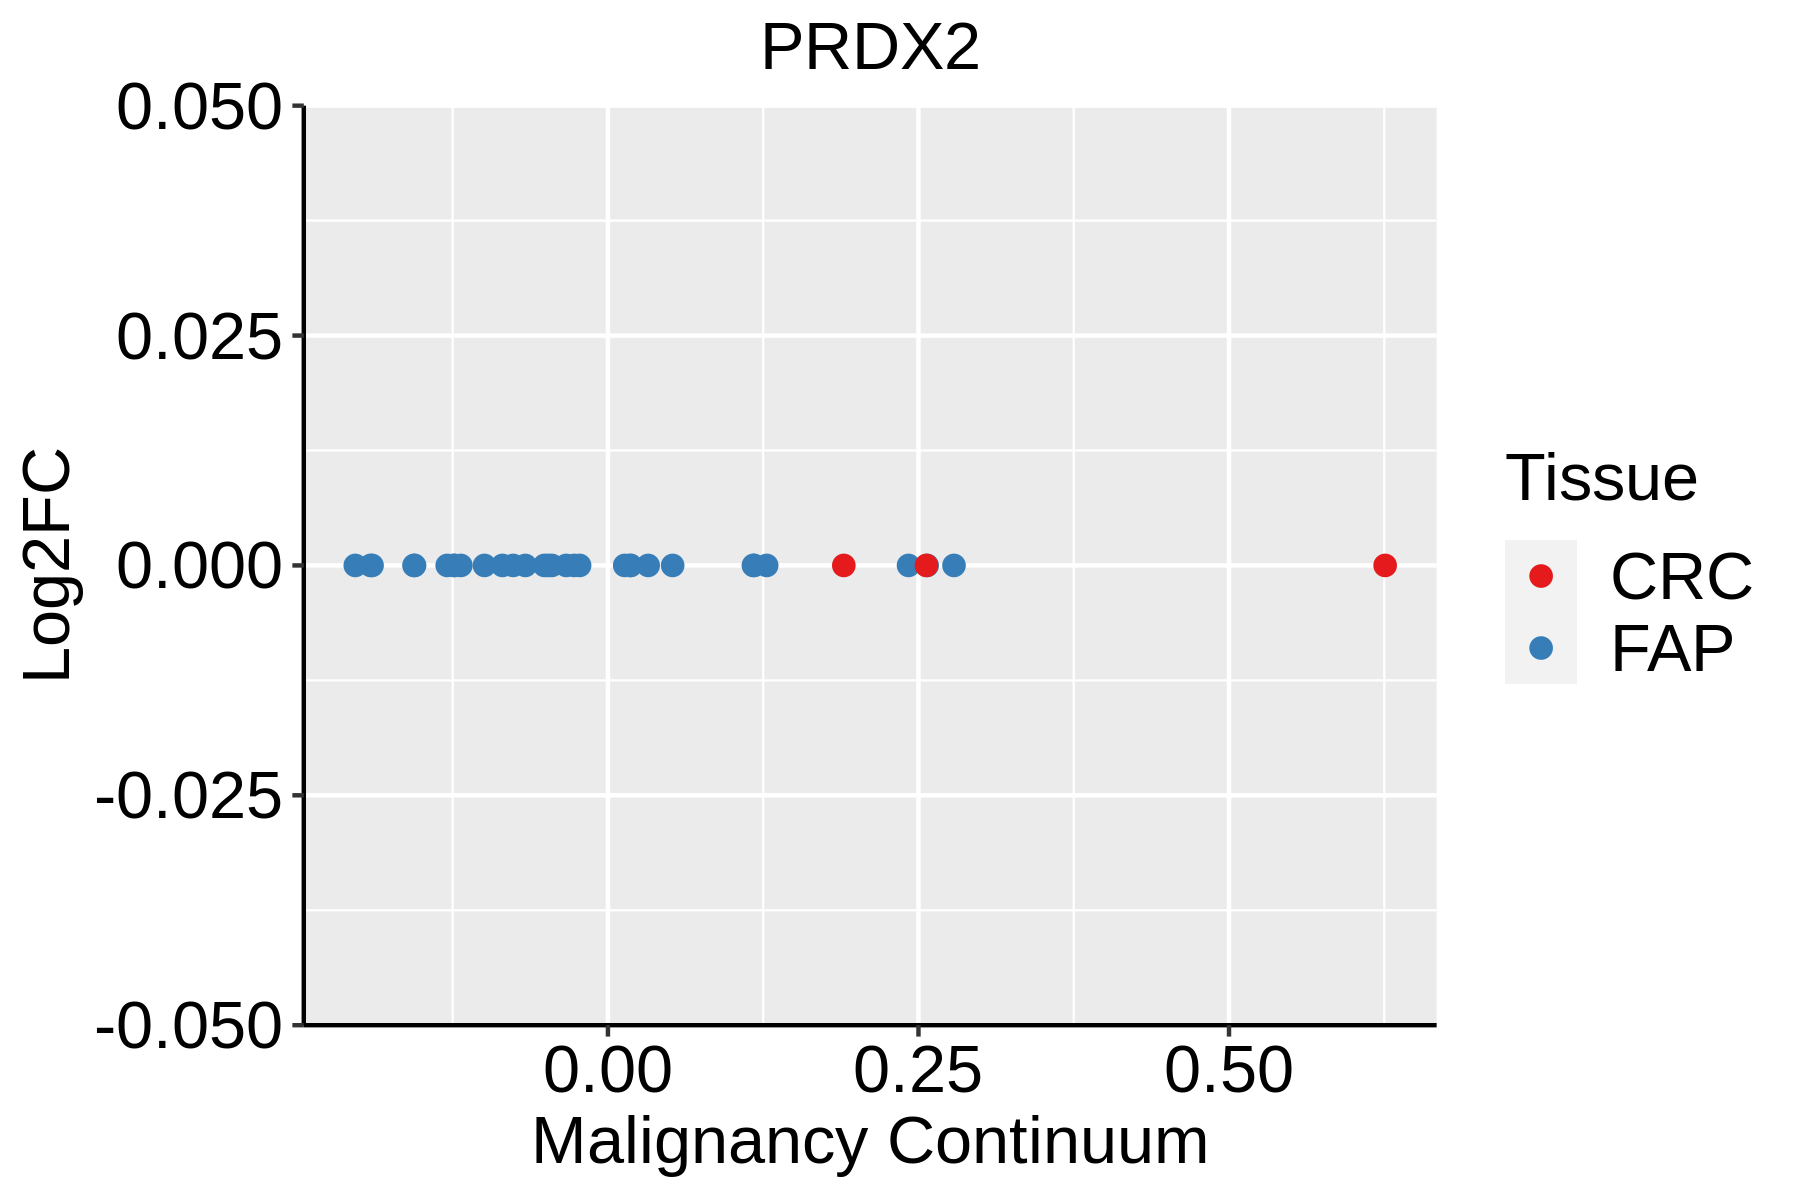 | FAP: Familial adenomatous polyposis |
| CRC: Colorectal cancer | ||
| Colorectum (HTA11) |  | AD: Adenomas |
| SER: Sessile serrated lesions | ||
| MSI-H: Microsatellite-high colorectal cancer | ||
| MSS: Microsatellite stable colorectal cancer | ||
| Endometrium | 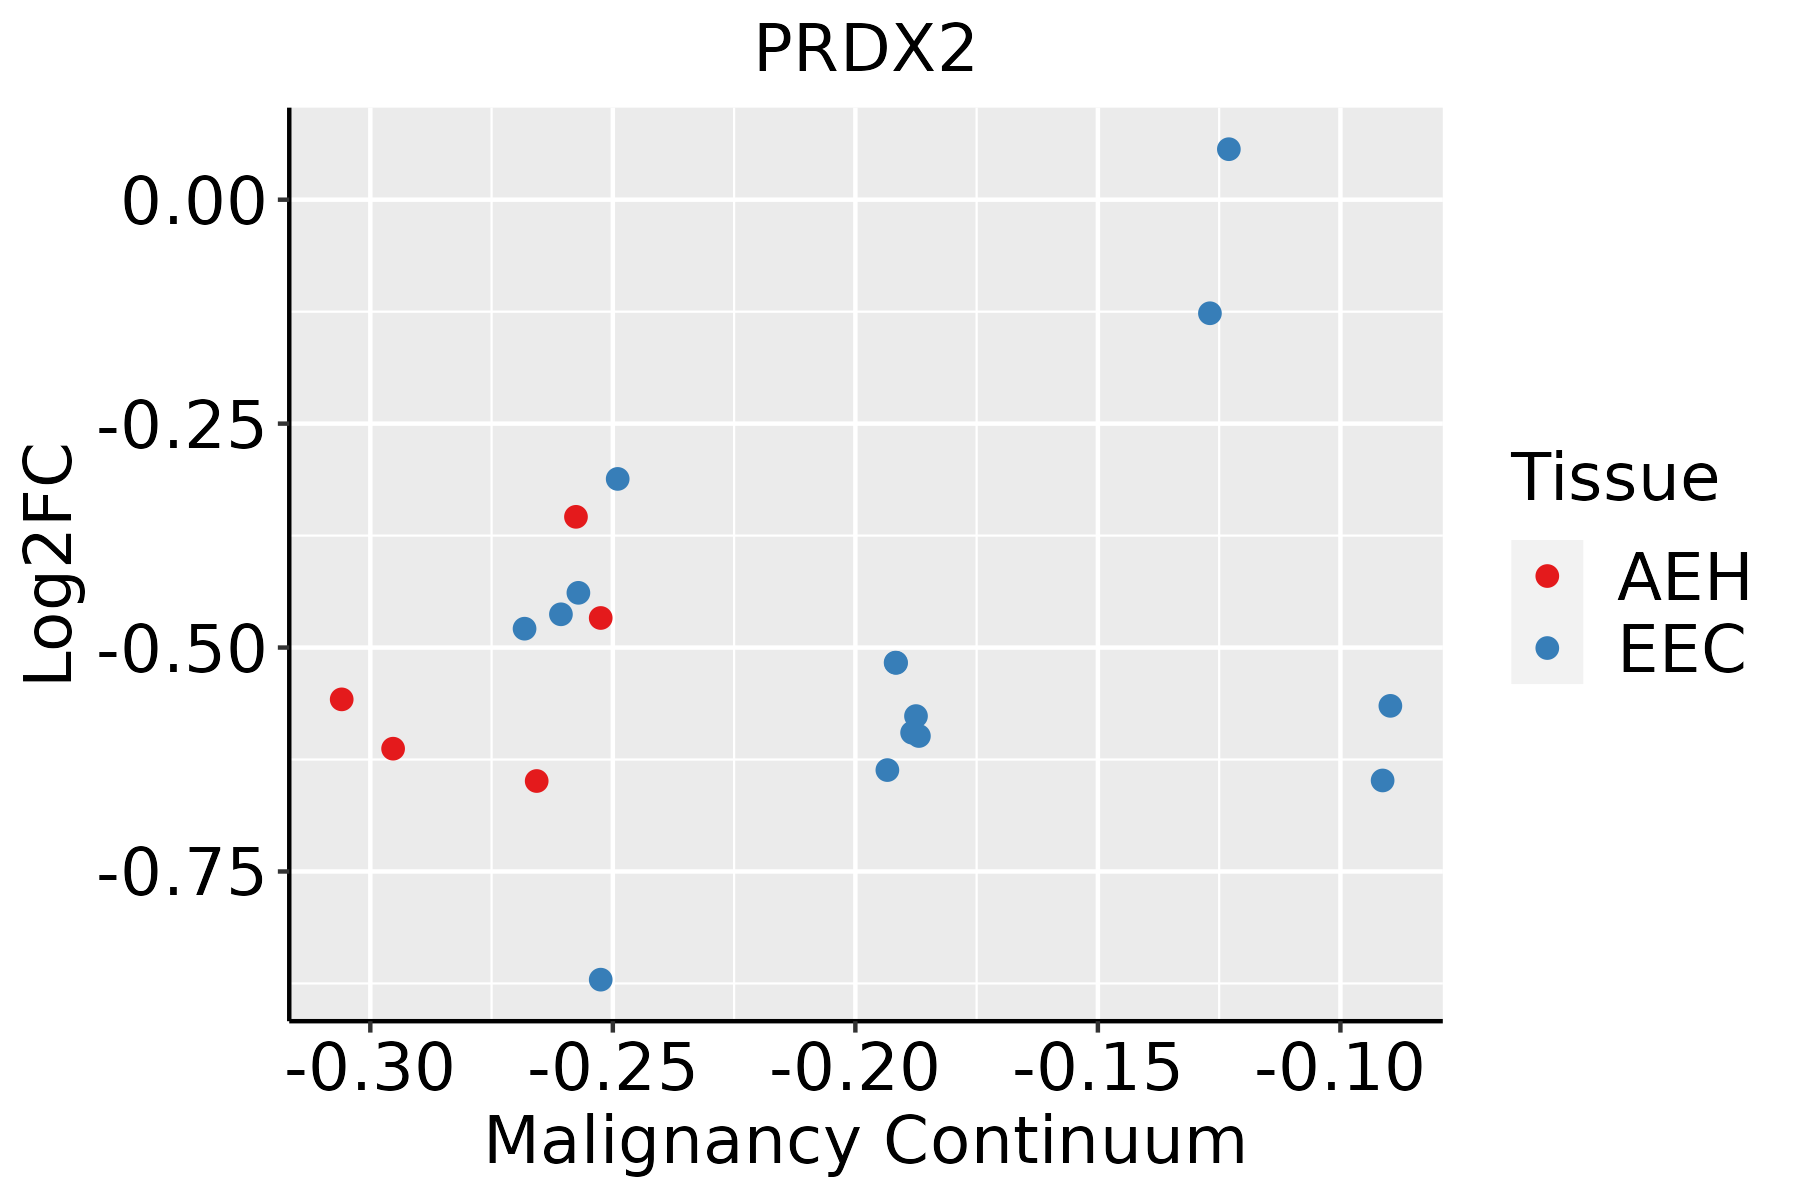 | AEH: Atypical endometrial hyperplasia |
| EEC: Endometrioid Cancer | ||
| Esophagus | 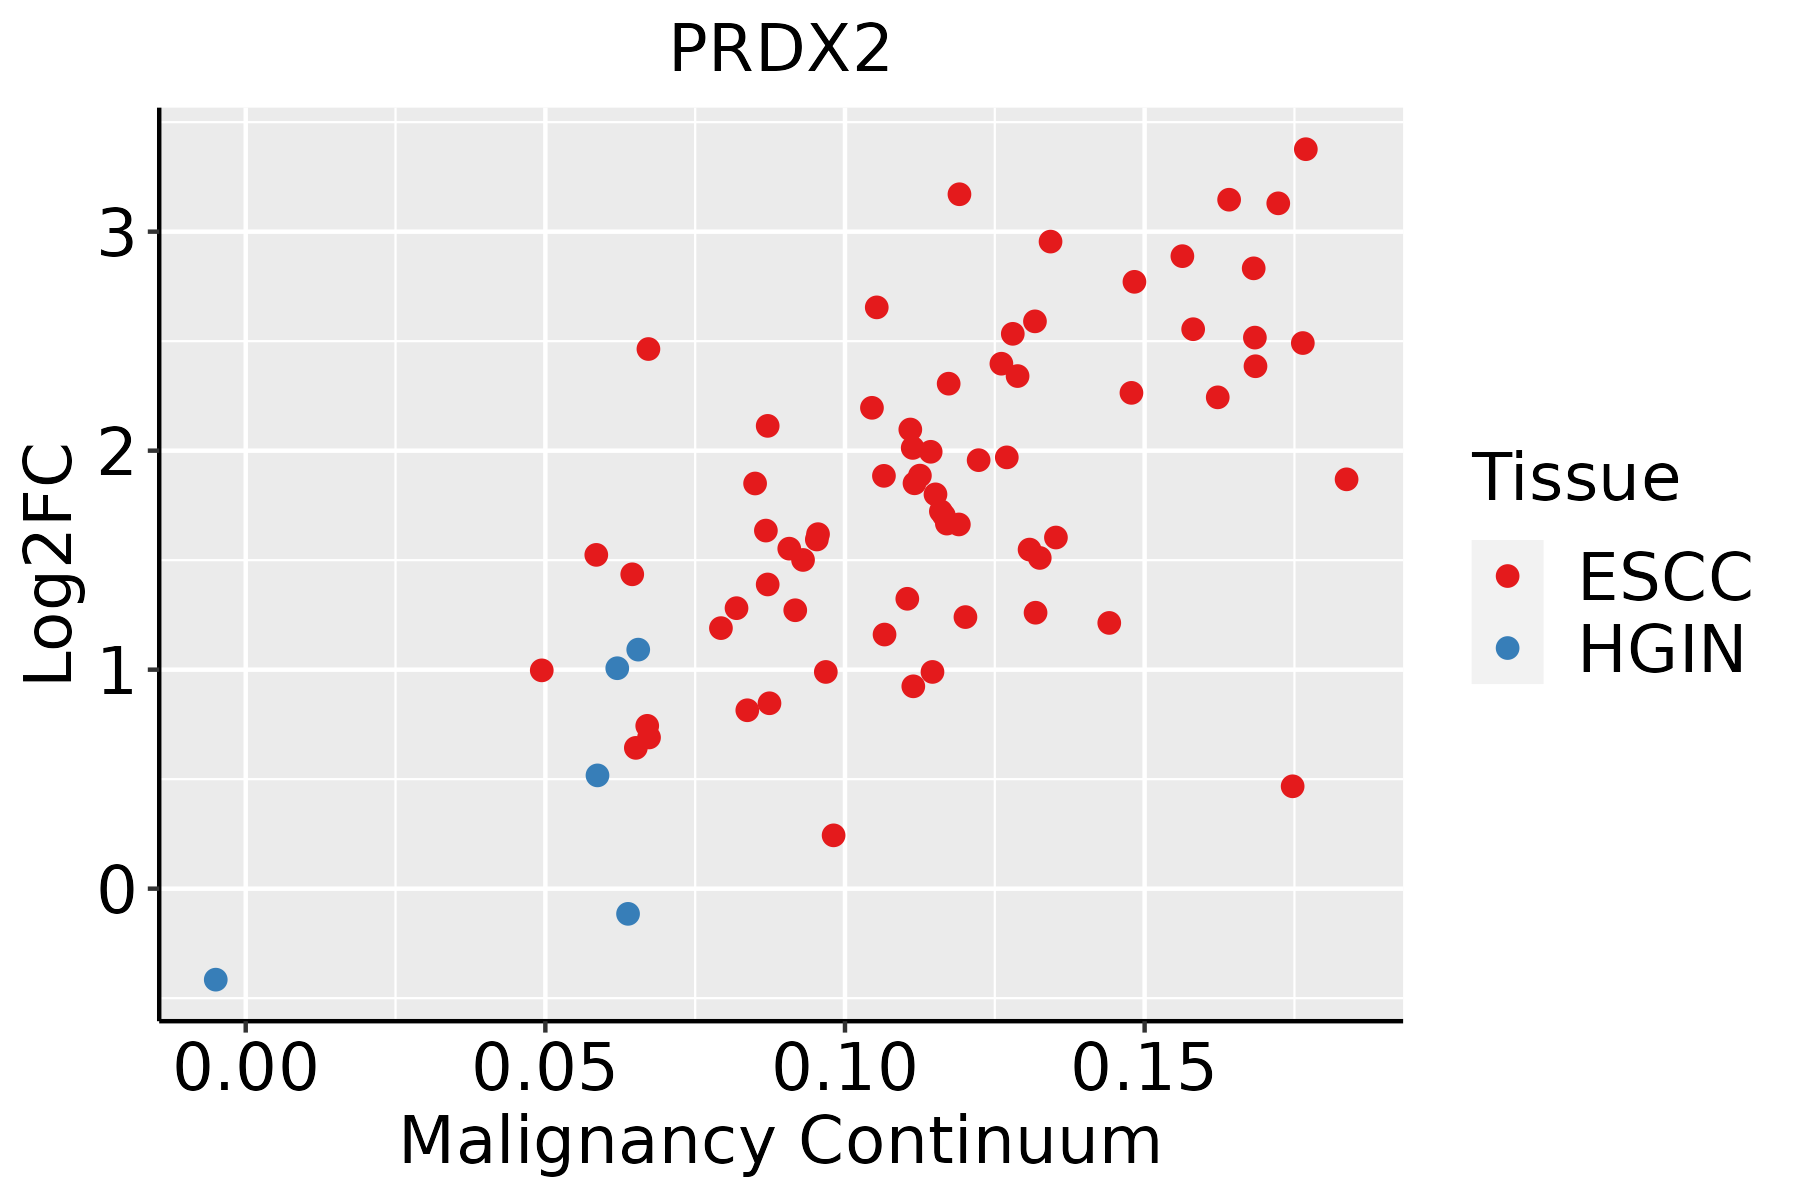 | ESCC: Esophageal squamous cell carcinoma |
| HGIN: High-grade intraepithelial neoplasias | ||
| LGIN: Low-grade intraepithelial neoplasias | ||
| GC | 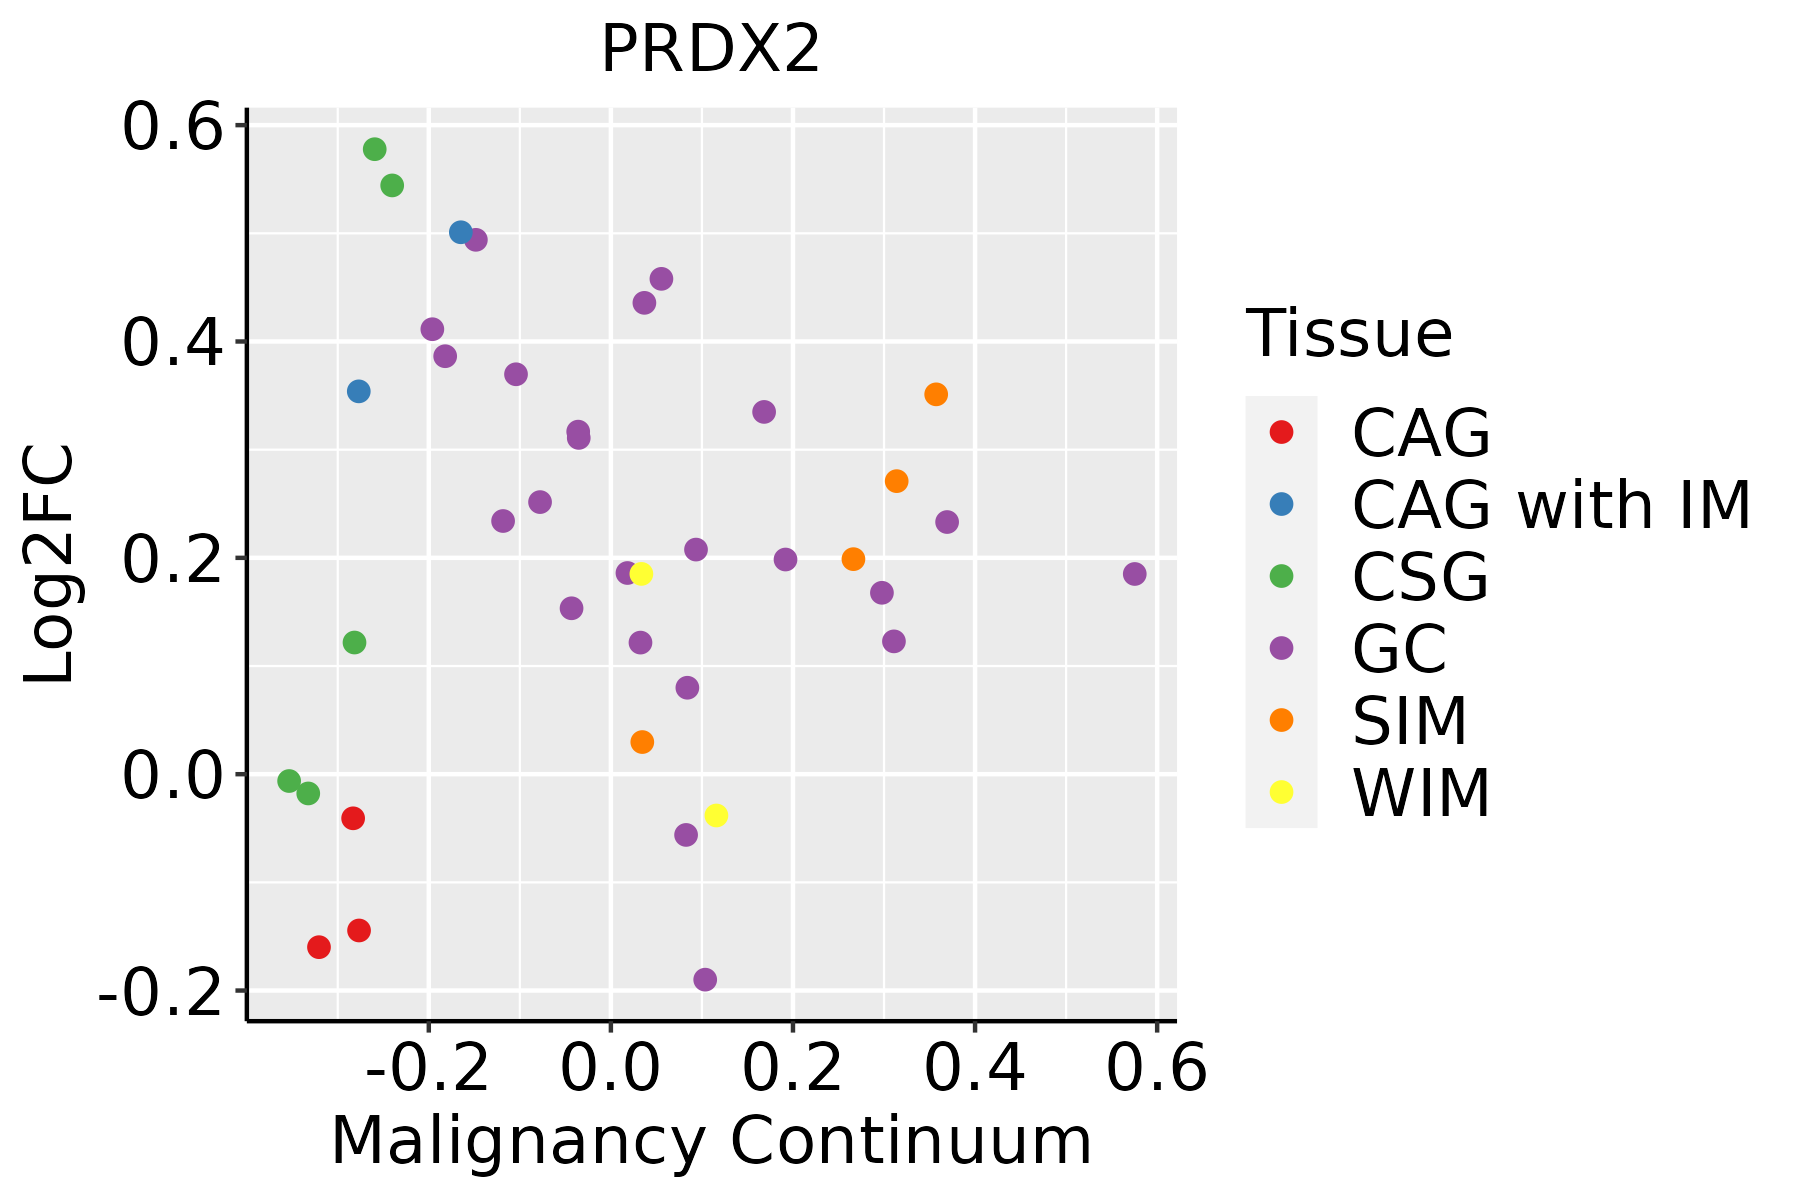 | CAG: Chronic atrophic gastritis |
| CAG with IM: Chronic atrophic gastritis with intestinal metaplasia | ||
| CSG: Chronic superficial gastritis | ||
| GC: Gastric cancer | ||
| SIM: Severe intestinal metaplasia | ||
| WIM: Wild intestinal metaplasia | ||
| Liver |  | HCC: Hepatocellular carcinoma |
| NAFLD: Non-alcoholic fatty liver disease | ||
| Oral Cavity |  | EOLP: Erosive Oral lichen planus |
| LP: leukoplakia | ||
| NEOLP: Non-erosive oral lichen planus | ||
| OSCC: Oral squamous cell carcinoma | ||
| Prostate | 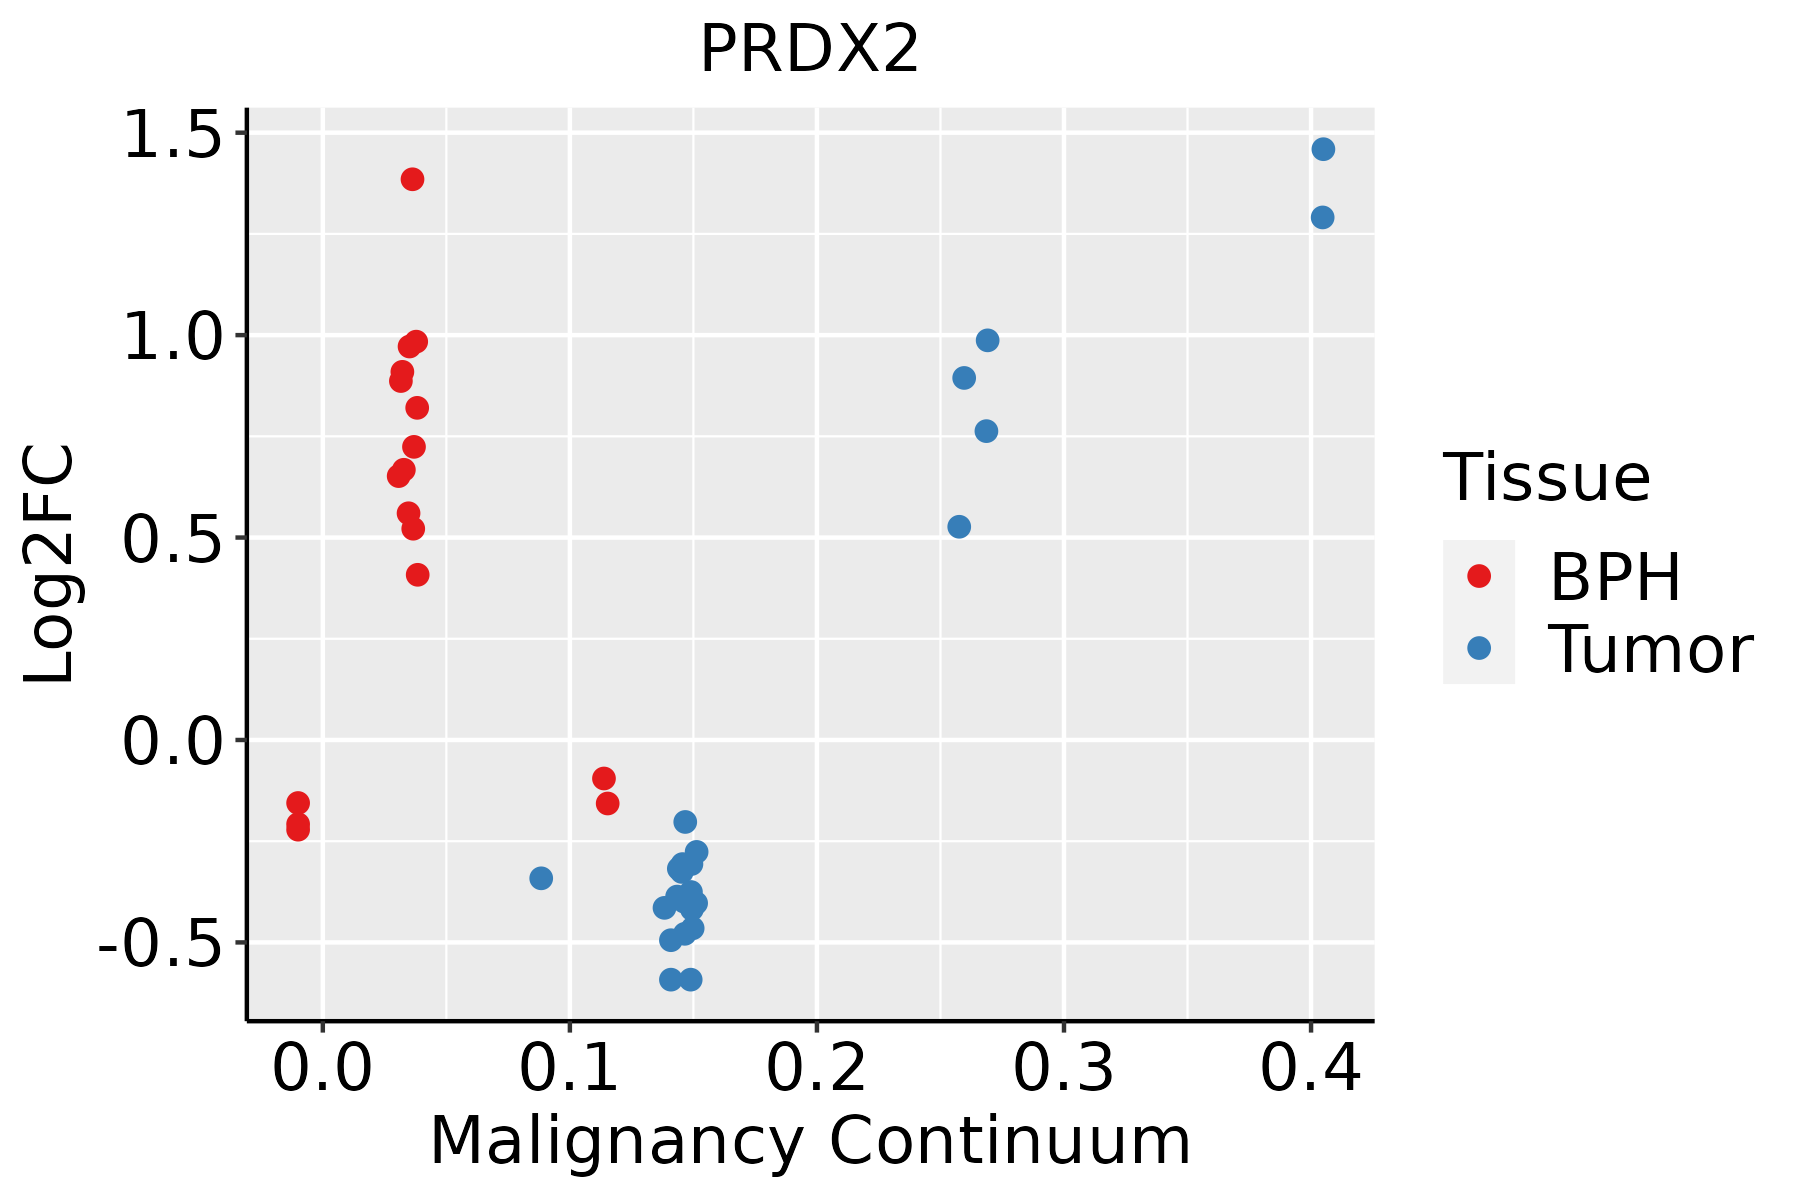 | BPH: Benign Prostatic Hyperplasia |
| Skin | 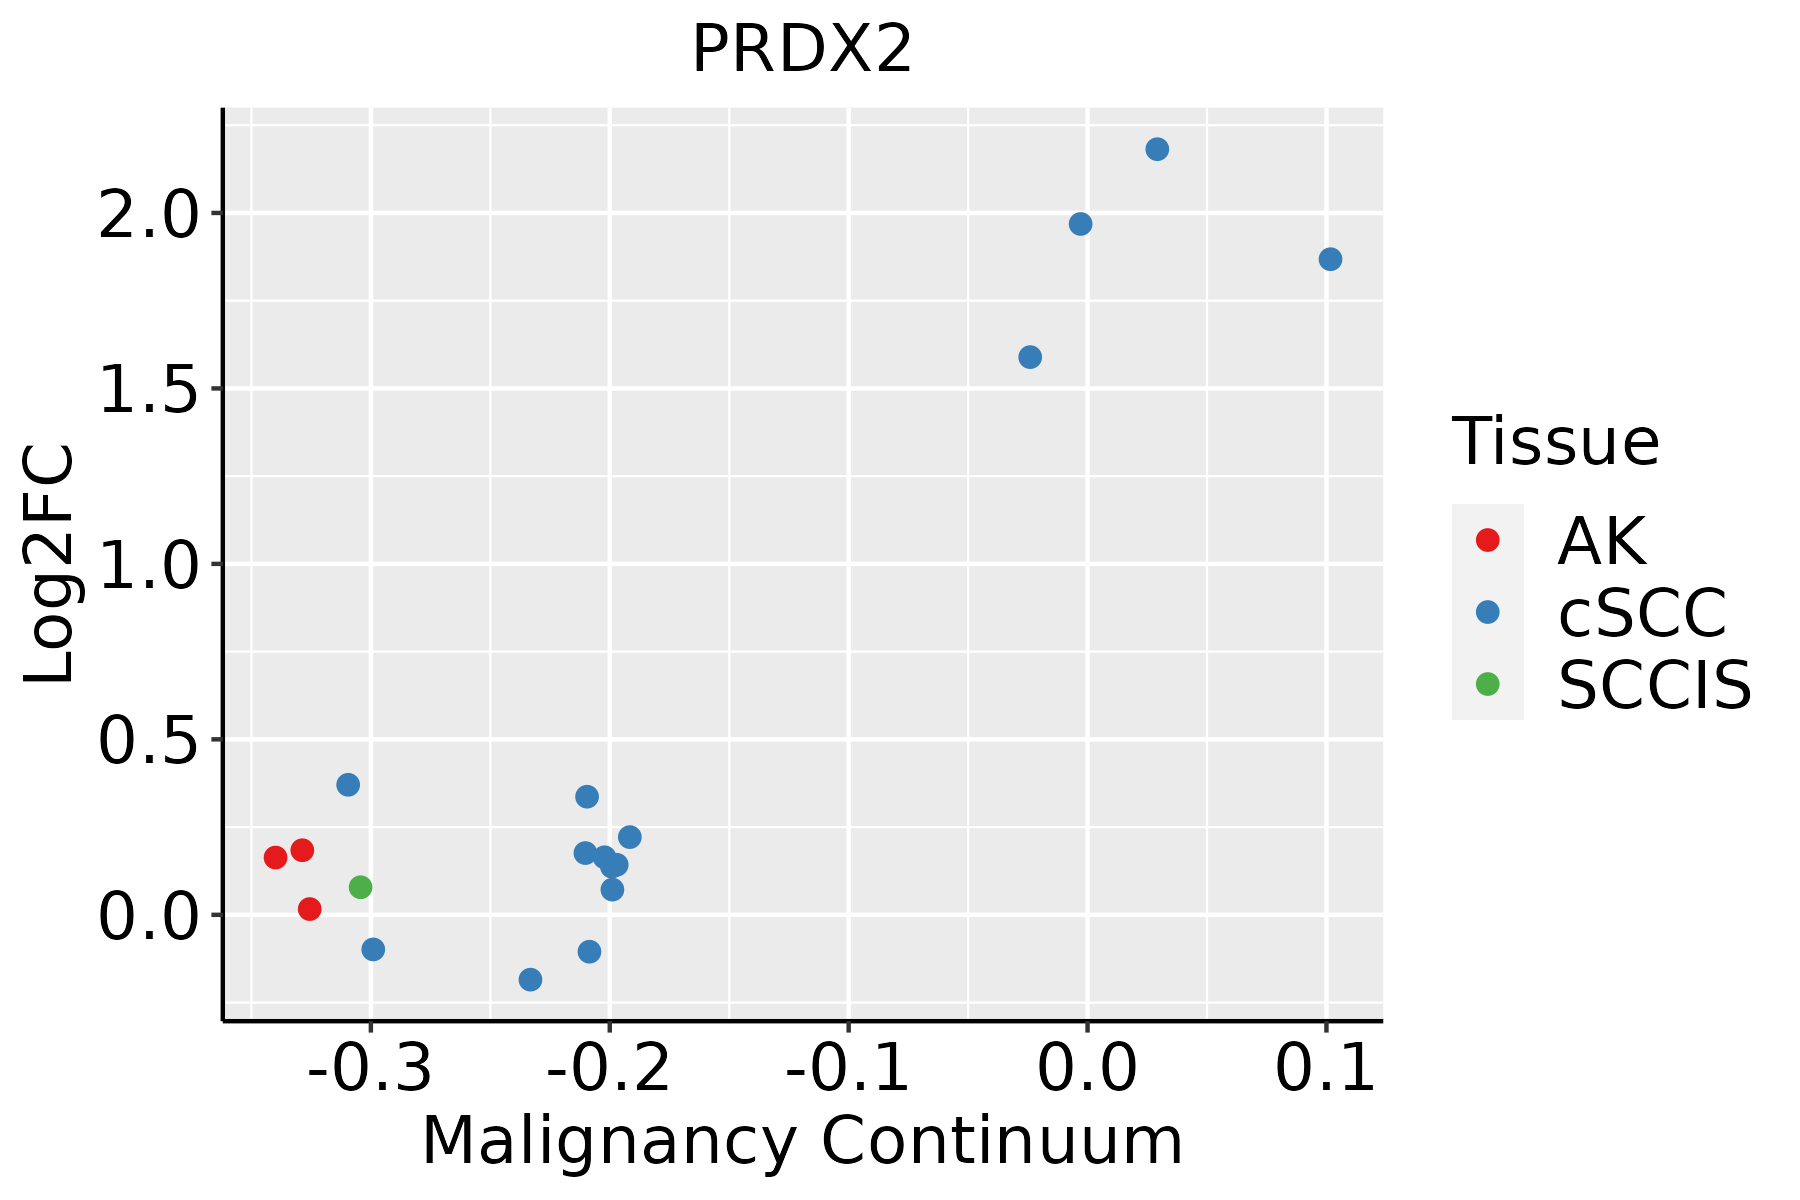 | AK: Actinic keratosis |
| cSCC: Cutaneous squamous cell carcinoma | ||
| SCCIS:squamous cell carcinoma in situ | ||
| Thyroid | 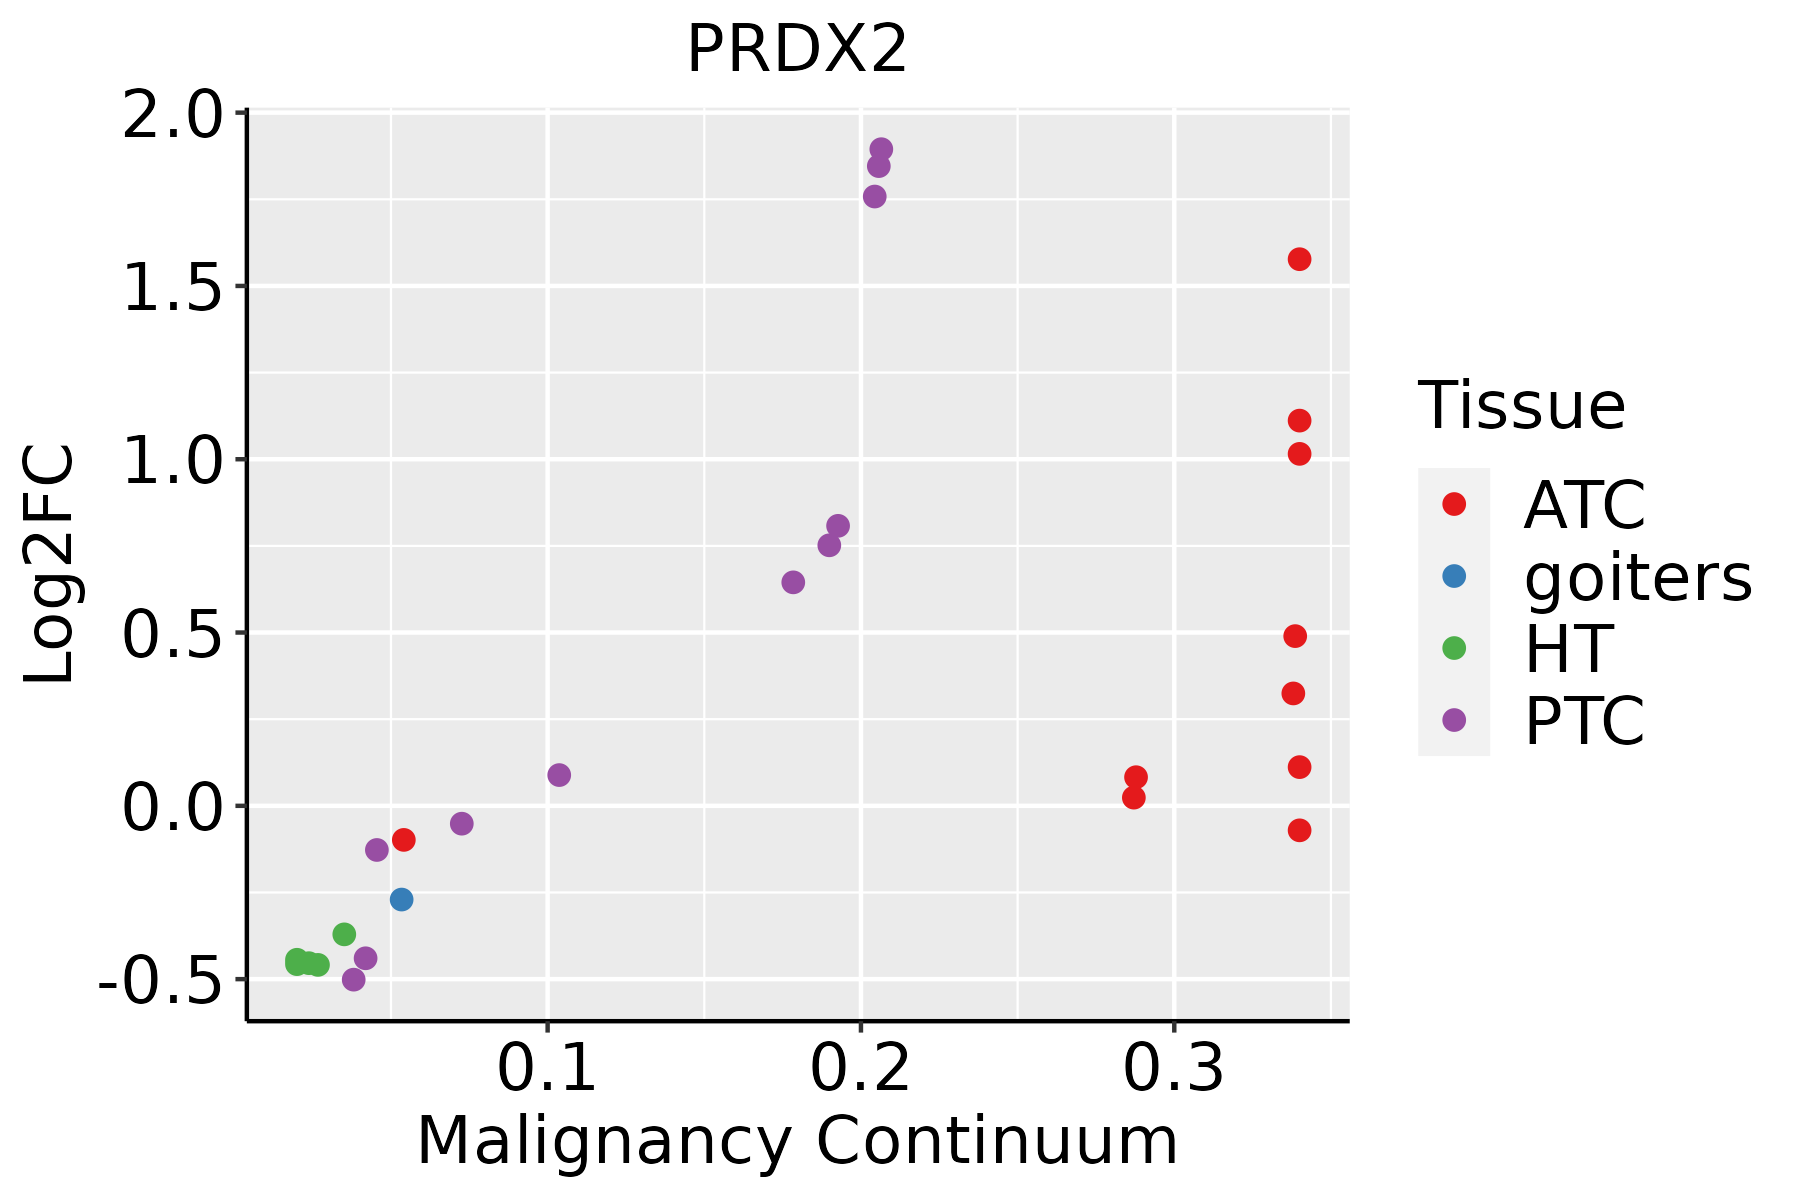 | ATC: Anaplastic thyroid cancer |
| HT: Hashimoto's thyroiditis | ||
| PTC: Papillary thyroid cancer |
| ∗log2FC in expression of this searched gene in stem-like cells from each diseased tissue sample relative to stem-like cells in normal samples in each tissue plotted against the malignancy continuum. Samples are colored based on if they are from different disease stage. |
Top |
Malignant transformation related pathway analysis |
| Find out the enriched GO biological processes and KEGG pathways involved in transition from healthy to precancer to cancer |
| Tissue | Disease Stage | Enriched GO biological Processes |
| Colorectum | AD |  |
| Colorectum | SER |  |
| Colorectum | MSS |  |
| Colorectum | MSI-H |  |
| Colorectum | FAP |  |
| ∗Top 15 enriched GO BP terms are showed in the bar plot of each disease state in each tissue. Each row represents a significant GO biological process which is colored according to the -log10(p.adjust). |
| Page: 1 2 3 4 5 6 7 8 9 |
| GO ID | Tissue | Disease Stage | Description | Gene Ratio | Bg Ratio | pvalue | p.adjust | Count |
| GO:004211018 | Esophagus | ESCC | T cell activation | 256/8552 | 487/18723 | 1.18e-03 | 5.87e-03 | 256 |
| GO:19031317 | Esophagus | ESCC | mononuclear cell differentiation | 226/8552 | 426/18723 | 1.20e-03 | 5.88e-03 | 226 |
| GO:20012394 | Esophagus | ESCC | regulation of extrinsic apoptotic signaling pathway in absence of ligand | 30/8552 | 43/18723 | 1.21e-03 | 5.88e-03 | 30 |
| GO:000223719 | Esophagus | ESCC | response to molecule of bacterial origin | 194/8552 | 363/18723 | 1.64e-03 | 7.61e-03 | 194 |
| GO:190210510 | Esophagus | ESCC | regulation of leukocyte differentiation | 152/8552 | 279/18723 | 1.82e-03 | 8.35e-03 | 152 |
| GO:0097237110 | Esophagus | ESCC | cellular response to toxic substance | 72/8552 | 124/18723 | 3.65e-03 | 1.49e-02 | 72 |
| GO:0098869110 | Esophagus | ESCC | cellular oxidant detoxification | 60/8552 | 101/18723 | 3.76e-03 | 1.53e-02 | 60 |
| GO:00434332 | Esophagus | ESCC | negative regulation of DNA-binding transcription factor activity | 103/8552 | 185/18723 | 3.86e-03 | 1.57e-02 | 103 |
| GO:19010992 | Esophagus | ESCC | negative regulation of signal transduction in absence of ligand | 23/8552 | 33/18723 | 4.57e-03 | 1.78e-02 | 23 |
| GO:20012402 | Esophagus | ESCC | negative regulation of extrinsic apoptotic signaling pathway in absence of ligand | 23/8552 | 33/18723 | 4.57e-03 | 1.78e-02 | 23 |
| GO:190303420 | Esophagus | ESCC | regulation of response to wounding | 93/8552 | 167/18723 | 5.77e-03 | 2.14e-02 | 93 |
| GO:00302176 | Esophagus | ESCC | T cell differentiation | 137/8552 | 257/18723 | 8.09e-03 | 2.87e-02 | 137 |
| GO:007122215 | Esophagus | ESCC | cellular response to lipopolysaccharide | 113/8552 | 209/18723 | 8.79e-03 | 3.10e-02 | 113 |
| GO:00316633 | Esophagus | ESCC | lipopolysaccharide-mediated signaling pathway | 37/8552 | 60/18723 | 9.17e-03 | 3.19e-02 | 37 |
| GO:00103101 | Esophagus | ESCC | regulation of hydrogen peroxide metabolic process | 16/8552 | 22/18723 | 9.46e-03 | 3.28e-02 | 16 |
| GO:007121617 | Esophagus | ESCC | cellular response to biotic stimulus | 131/8552 | 246/18723 | 9.85e-03 | 3.39e-02 | 131 |
| GO:000715918 | Esophagus | ESCC | leukocyte cell-cell adhesion | 192/8552 | 371/18723 | 1.03e-02 | 3.51e-02 | 192 |
| GO:00320882 | Esophagus | ESCC | negative regulation of NF-kappaB transcription factor activity | 54/8552 | 93/18723 | 1.08e-02 | 3.67e-02 | 54 |
| GO:190303617 | Esophagus | ESCC | positive regulation of response to wounding | 43/8552 | 72/18723 | 1.14e-02 | 3.84e-02 | 43 |
| GO:009030310 | Esophagus | ESCC | positive regulation of wound healing | 36/8552 | 59/18723 | 1.27e-02 | 4.21e-02 | 36 |
| Page: 1 2 3 4 5 6 7 8 9 10 11 12 13 14 15 16 17 18 19 20 21 22 23 24 25 26 27 28 29 30 31 32 33 34 35 36 37 38 39 40 41 42 43 44 45 46 47 48 49 50 51 52 53 54 55 56 57 58 59 60 61 62 63 64 65 66 |
| Pathway ID | Tissue | Disease Stage | Description | Gene Ratio | Bg Ratio | pvalue | p.adjust | qvalue | Count |
| Page: 1 |
Top |
Cell-cell communication analysis |
| Identification of potential cell-cell interactions between two cell types and their ligand-receptor pairs for different disease states |
| Ligand | Receptor | LRpair | Pathway | Tissue | Disease Stage |
| Page: 1 |
Top |
Single-cell gene regulatory network inference analysis |
| Find out the significant the regulons (TFs) and the target genes of each regulon across cell types for different disease states |
| TF | Cell Type | Tissue | Disease Stage | Target Gene | RSS | Regulon Activity |
| ∗The dot plots of a searched regulon are shown for all cell subpopulations in each disease state of each tissue based on the regulon specific score inferred using pySCENIC and by calculating the average expression. |
| Page: 1 |
Top |
Somatic mutation of malignant transformation related genes |
| Annotation of somatic variants for genes involved in malignant transformation |
| Hugo Symbol | Variant Class | Variant Classification | dbSNP RS | HGVSc | HGVSp | HGVSp Short | SWISSPROT | BIOTYPE | SIFT | PolyPhen | Tumor Sample Barcode | Tissue | Histology | Sex | Age | Stage | Therapy Types | Drugs | Outcome |
| PRDX2 | SNV | Missense_Mutation | novel | c.544A>T | p.Thr182Ser | p.T182S | P32119 | protein_coding | deleterious(0.03) | possibly_damaging(0.515) | TCGA-A7-A4SA-01 | Breast | breast invasive carcinoma | Female | <65 | I/II | Chemotherapy | doxorubicin | CR |
| PRDX2 | SNV | Missense_Mutation | novel | c.565N>T | p.Asp189Tyr | p.D189Y | P32119 | protein_coding | deleterious(0.01) | benign(0.102) | TCGA-OL-A66L-01 | Breast | breast invasive carcinoma | Female | >=65 | I/II | Unknown | Unknown | SD |
| PRDX2 | insertion | Frame_Shift_Ins | novel | c.245_246insGGGAGGAGGTTGCAGTAAG | p.His83GlyfsTer30 | p.H83Gfs*30 | P32119 | protein_coding | TCGA-A2-A0EV-01 | Breast | breast invasive carcinoma | Female | >=65 | I/II | Unknown | Unknown | SD | ||
| PRDX2 | SNV | Missense_Mutation | novel | c.169N>A | p.Ala57Thr | p.A57T | P32119 | protein_coding | deleterious(0.01) | probably_damaging(0.97) | TCGA-2W-A8YY-01 | Cervix | cervical & endocervical cancer | Female | <65 | I/II | Chemotherapy | cisplatin | CR |
| PRDX2 | SNV | Missense_Mutation | novel | c.452C>T | p.Ser151Phe | p.S151F | P32119 | protein_coding | deleterious(0.03) | probably_damaging(0.996) | TCGA-VS-A958-01 | Cervix | cervical & endocervical cancer | Female | <65 | I/II | Chemotherapy | cisplatin | CR |
| PRDX2 | SNV | Missense_Mutation | rs534702204 | c.334T>C | p.Ser112Pro | p.S112P | P32119 | protein_coding | deleterious(0) | probably_damaging(0.975) | TCGA-CA-6717-01 | Colorectum | colon adenocarcinoma | Male | <65 | I/II | Chemotherapy | oxaliplatin | CR |
| PRDX2 | SNV | Missense_Mutation | rs755166073 | c.448N>T | p.Arg150Cys | p.R150C | P32119 | protein_coding | deleterious(0.05) | probably_damaging(0.98) | TCGA-CK-4951-01 | Colorectum | colon adenocarcinoma | Female | >=65 | I/II | Unknown | Unknown | PD |
| PRDX2 | SNV | Missense_Mutation | rs764907738 | c.559N>A | p.Val187Met | p.V187M | P32119 | protein_coding | tolerated(0.06) | benign(0.376) | TCGA-CM-4746-01 | Colorectum | colon adenocarcinoma | Male | <65 | I/II | Unknown | Unknown | SD |
| PRDX2 | SNV | Missense_Mutation | rs369634820 | c.272G>A | p.Arg91Gln | p.R91Q | P32119 | protein_coding | deleterious(0.03) | possibly_damaging(0.74) | TCGA-D5-7000-01 | Colorectum | colon adenocarcinoma | Female | >=65 | I/II | Unknown | Unknown | SD |
| PRDX2 | SNV | Missense_Mutation | c.38N>T | p.Pro13Leu | p.P13L | P32119 | protein_coding | deleterious(0) | probably_damaging(1) | TCGA-AP-A059-01 | Endometrium | uterine corpus endometrioid carcinoma | Female | >=65 | I/II | Unknown | Unknown | SD |
| Page: 1 2 3 |
Top |
Related drugs of malignant transformation related genes |
| Identification of chemicals and drugs interact with genes involved in malignant transfromation |
| (DGIdb 4.0) |
| Entrez ID | Symbol | Category | Interaction Types | Drug Claim Name | Drug Name | PMIDs |
| Page: 1 |

Copyright 2023-Present -The University of Texas Health Science Center at Houston |