
|
|||||
|
 | |
| |
| |
| |
| |
| |
|
Gene: MPST |
Gene summary for MPST |
| Gene information | Species | Human | Gene symbol | MPST | Gene ID | 4357 |
| Gene name | mercaptopyruvate sulfurtransferase | |
| Gene Alias | MST | |
| Cytomap | 22q12.3 | |
| Gene Type | protein-coding | GO ID | GO:0000096 | UniProtAcc | A0A140VJX3 |
Top |
Malignant transformation analysis |
| Identification of the aberrant gene expression in precancerous and cancerous lesions by comparing the gene expression of stem-like cells in diseased tissues with normal stem cells |
| Entrez ID | Symbol | Replicates | Species | Organ | Tissue | Adj P-value | Log2FC | Malignancy |
| 4357 | MPST | HTA11_3410_2000001011 | Human | Colorectum | AD | 2.18e-11 | 3.37e-01 | 0.0155 |
| 4357 | MPST | HTA11_2487_2000001011 | Human | Colorectum | SER | 8.17e-22 | 9.31e-01 | -0.1808 |
| 4357 | MPST | HTA11_1938_2000001011 | Human | Colorectum | AD | 7.78e-19 | 9.93e-01 | -0.0811 |
| 4357 | MPST | HTA11_78_2000001011 | Human | Colorectum | AD | 3.10e-09 | 5.01e-01 | -0.1088 |
| 4357 | MPST | HTA11_347_2000001011 | Human | Colorectum | AD | 7.34e-50 | 1.09e+00 | -0.1954 |
| 4357 | MPST | HTA11_411_2000001011 | Human | Colorectum | SER | 3.78e-09 | 1.24e+00 | -0.2602 |
| 4357 | MPST | HTA11_2112_2000001011 | Human | Colorectum | SER | 3.51e-09 | 1.09e+00 | -0.2196 |
| 4357 | MPST | HTA11_3361_2000001011 | Human | Colorectum | AD | 3.11e-09 | 6.63e-01 | -0.1207 |
| 4357 | MPST | HTA11_83_2000001011 | Human | Colorectum | SER | 9.98e-19 | 9.80e-01 | -0.1526 |
| 4357 | MPST | HTA11_696_2000001011 | Human | Colorectum | AD | 8.49e-34 | 8.88e-01 | -0.1464 |
| 4357 | MPST | HTA11_866_2000001011 | Human | Colorectum | AD | 1.97e-17 | 6.39e-01 | -0.1001 |
| 4357 | MPST | HTA11_1391_2000001011 | Human | Colorectum | AD | 5.28e-32 | 1.18e+00 | -0.059 |
| 4357 | MPST | HTA11_2992_2000001011 | Human | Colorectum | SER | 5.25e-15 | 9.32e-01 | -0.1706 |
| 4357 | MPST | HTA11_5212_2000001011 | Human | Colorectum | AD | 7.89e-06 | 6.76e-01 | -0.2061 |
| 4357 | MPST | HTA11_5216_2000001011 | Human | Colorectum | SER | 1.80e-09 | 8.39e-01 | -0.1462 |
| 4357 | MPST | HTA11_546_2000001011 | Human | Colorectum | AD | 1.73e-15 | 9.63e-01 | -0.0842 |
| 4357 | MPST | HTA11_7862_2000001011 | Human | Colorectum | AD | 6.37e-05 | 4.49e-01 | -0.0179 |
| 4357 | MPST | HTA11_866_3004761011 | Human | Colorectum | AD | 1.04e-19 | 6.44e-01 | 0.096 |
| 4357 | MPST | HTA11_4255_2000001011 | Human | Colorectum | SER | 5.09e-07 | 9.18e-01 | 0.0446 |
| 4357 | MPST | HTA11_9408_2000001011 | Human | Colorectum | AD | 1.55e-11 | 1.09e+00 | 0.0451 |
| Page: 1 2 3 4 5 6 7 8 9 10 11 |
| Tissue | Expression Dynamics | Abbreviation |
| Colorectum (GSE201348) | 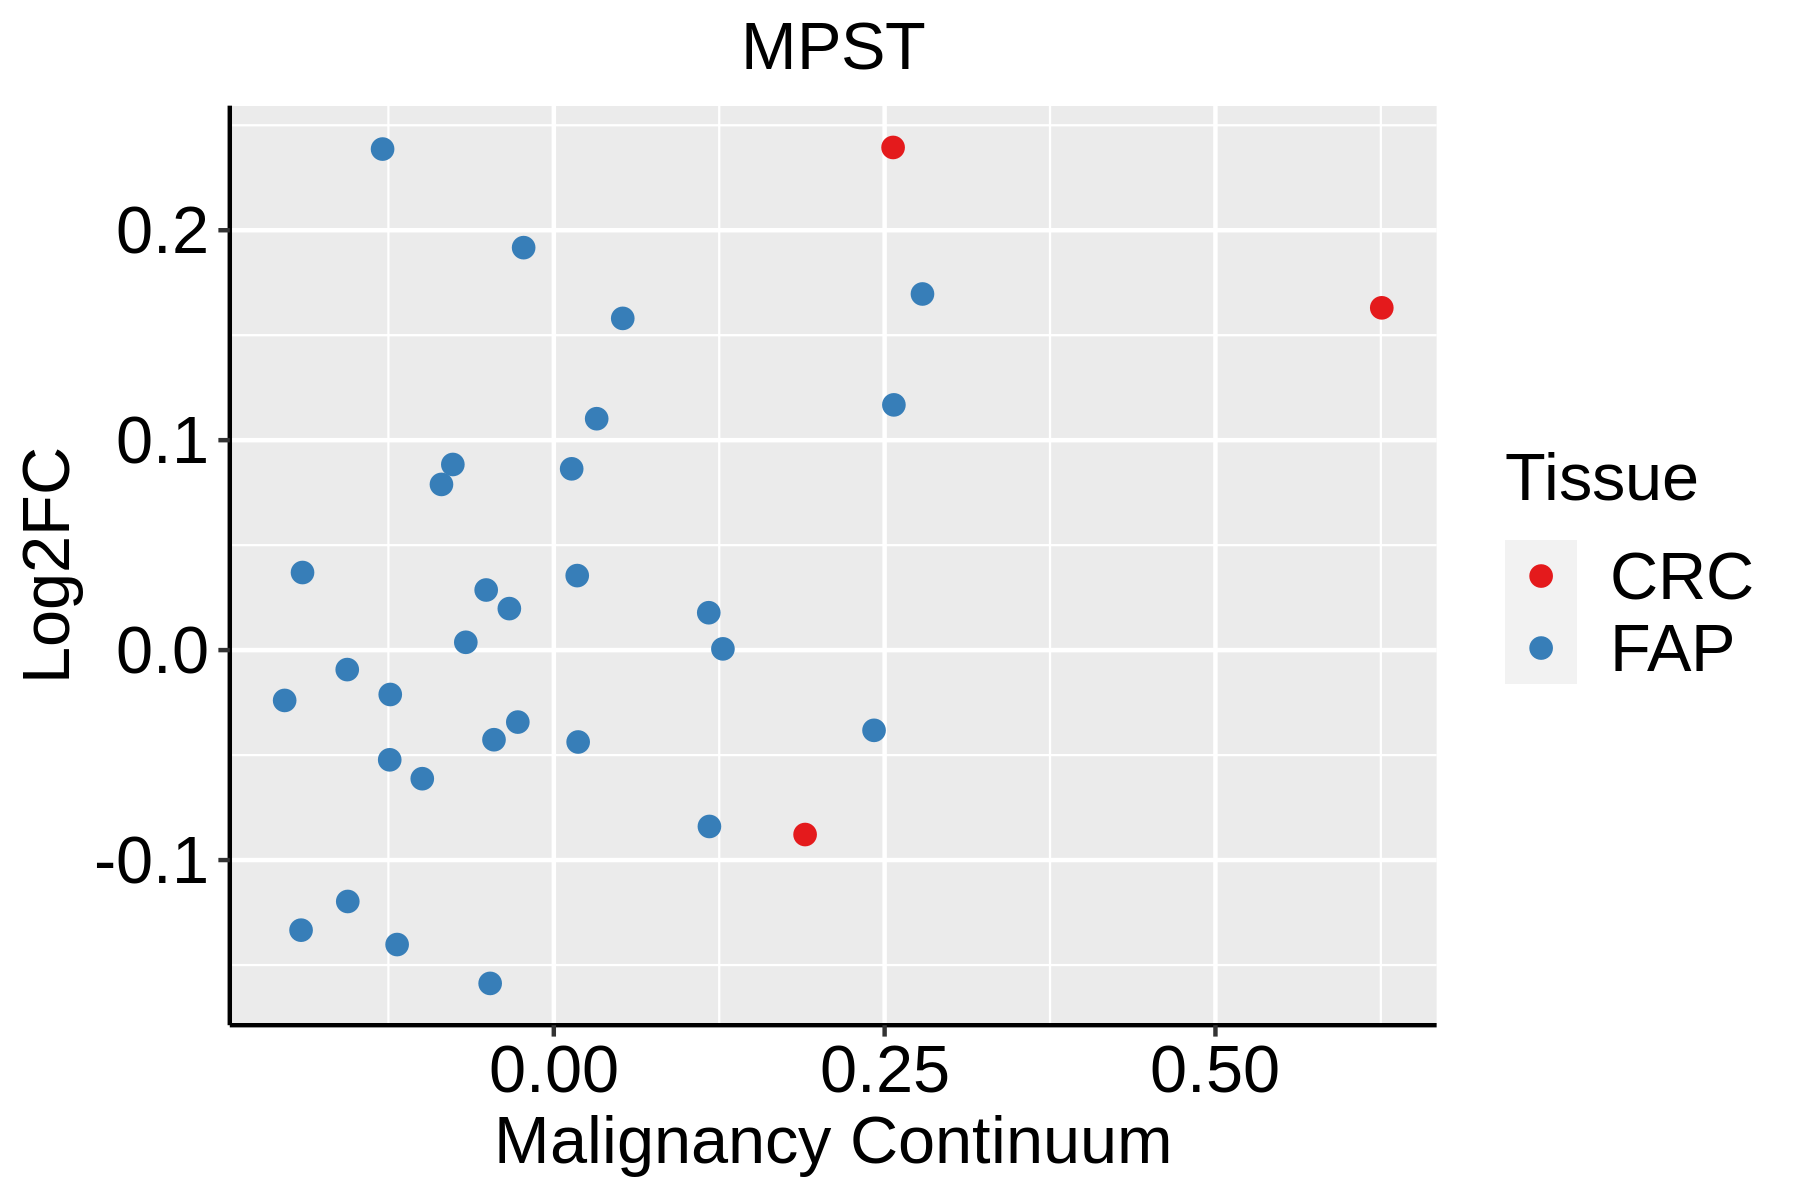 | FAP: Familial adenomatous polyposis |
| CRC: Colorectal cancer | ||
| Colorectum (HTA11) |  | AD: Adenomas |
| SER: Sessile serrated lesions | ||
| MSI-H: Microsatellite-high colorectal cancer | ||
| MSS: Microsatellite stable colorectal cancer | ||
| Endometrium |  | AEH: Atypical endometrial hyperplasia |
| EEC: Endometrioid Cancer | ||
| Esophagus | 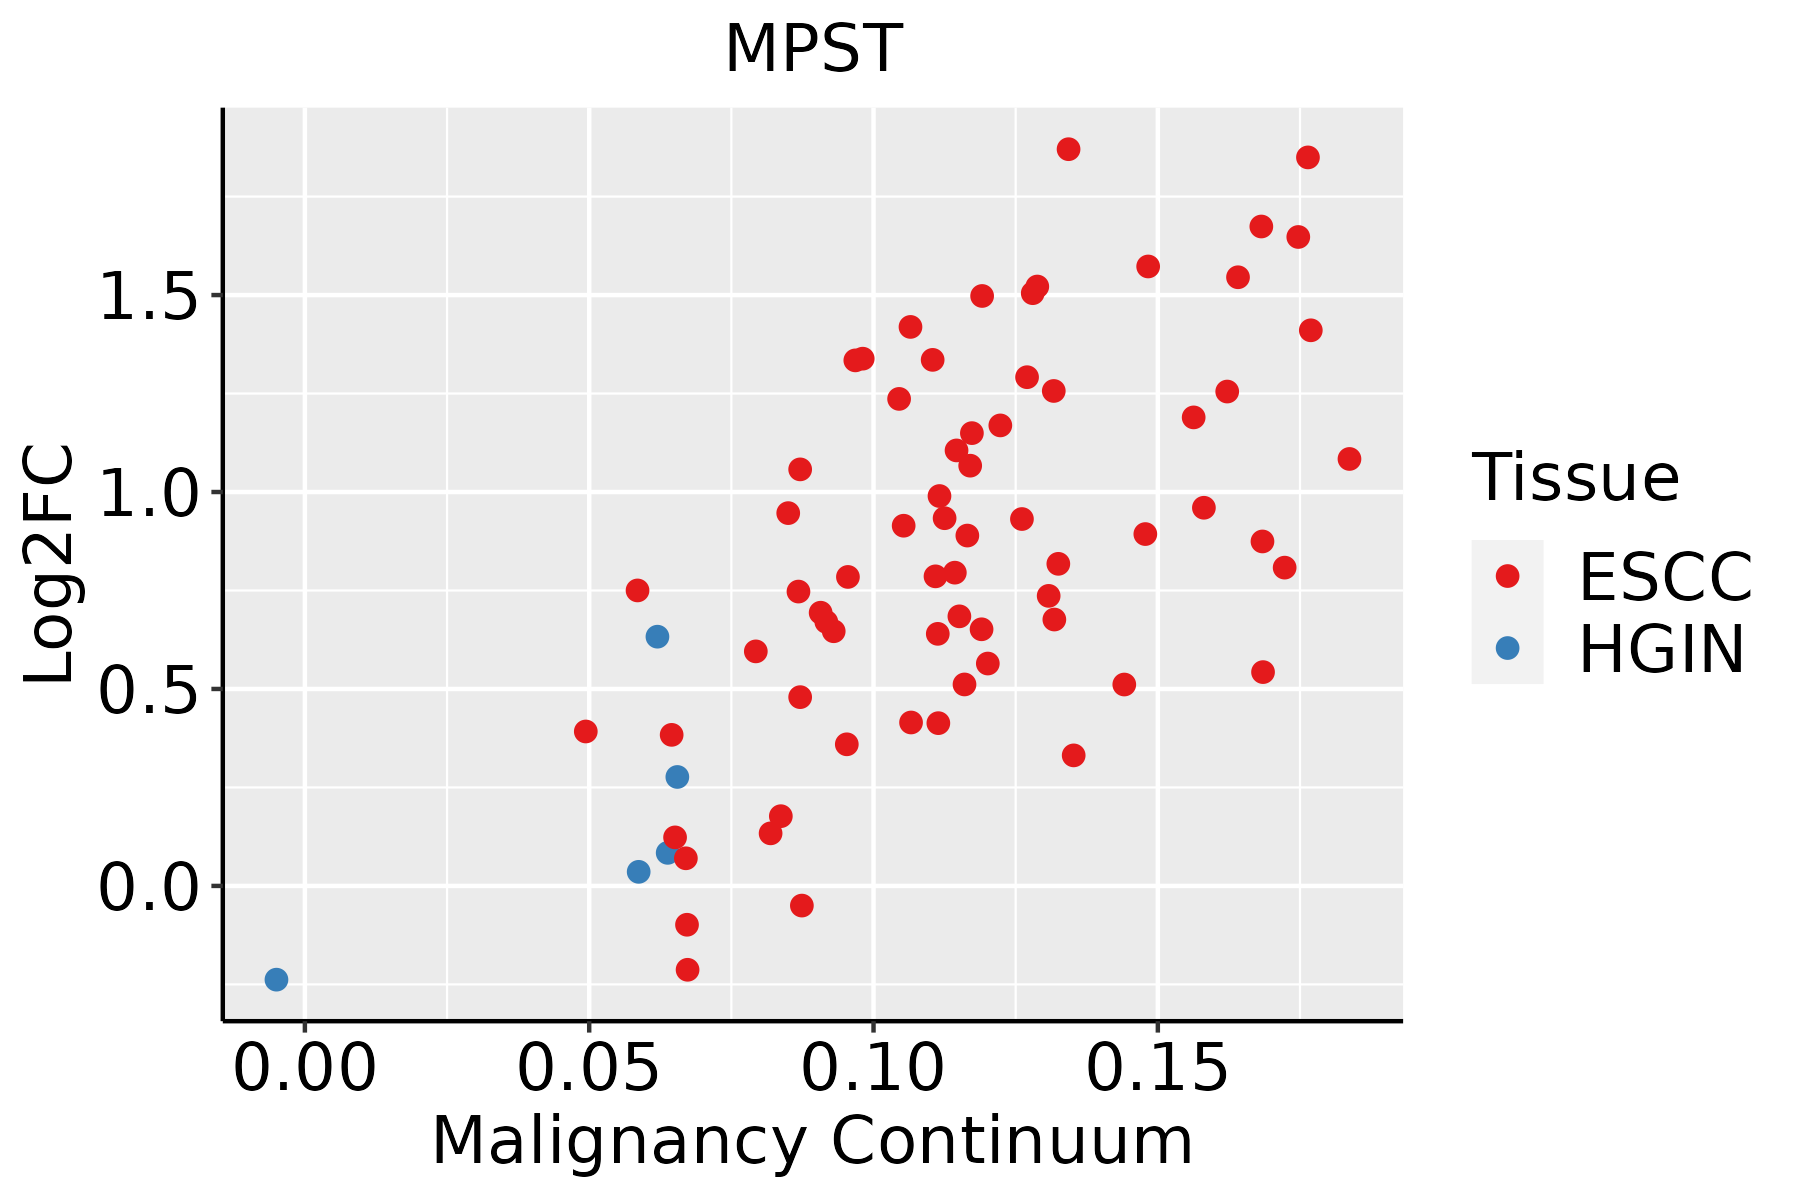 | ESCC: Esophageal squamous cell carcinoma |
| HGIN: High-grade intraepithelial neoplasias | ||
| LGIN: Low-grade intraepithelial neoplasias | ||
| GC |  | CAG: Chronic atrophic gastritis |
| CAG with IM: Chronic atrophic gastritis with intestinal metaplasia | ||
| CSG: Chronic superficial gastritis | ||
| GC: Gastric cancer | ||
| SIM: Severe intestinal metaplasia | ||
| WIM: Wild intestinal metaplasia | ||
| Liver |  | HCC: Hepatocellular carcinoma |
| NAFLD: Non-alcoholic fatty liver disease | ||
| Oral Cavity | 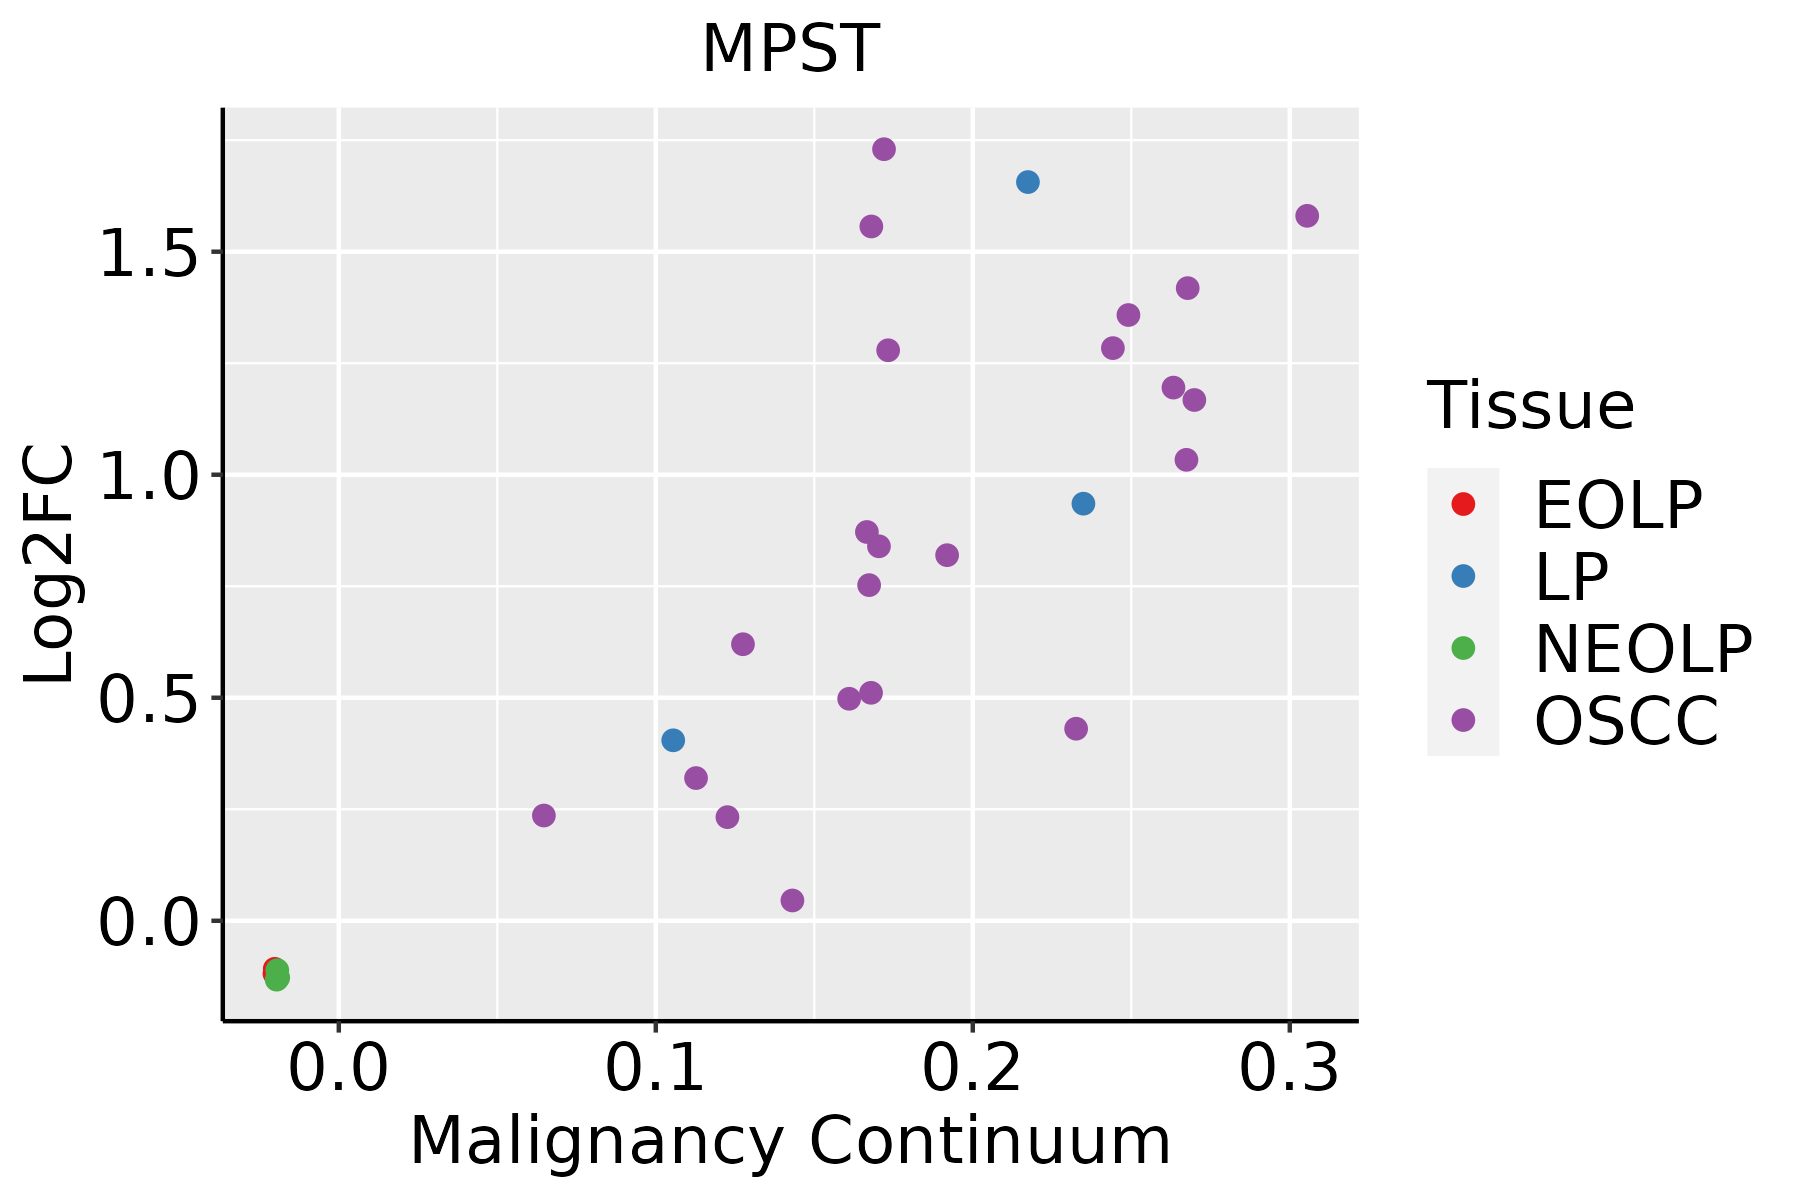 | EOLP: Erosive Oral lichen planus |
| LP: leukoplakia | ||
| NEOLP: Non-erosive oral lichen planus | ||
| OSCC: Oral squamous cell carcinoma | ||
| Prostate | 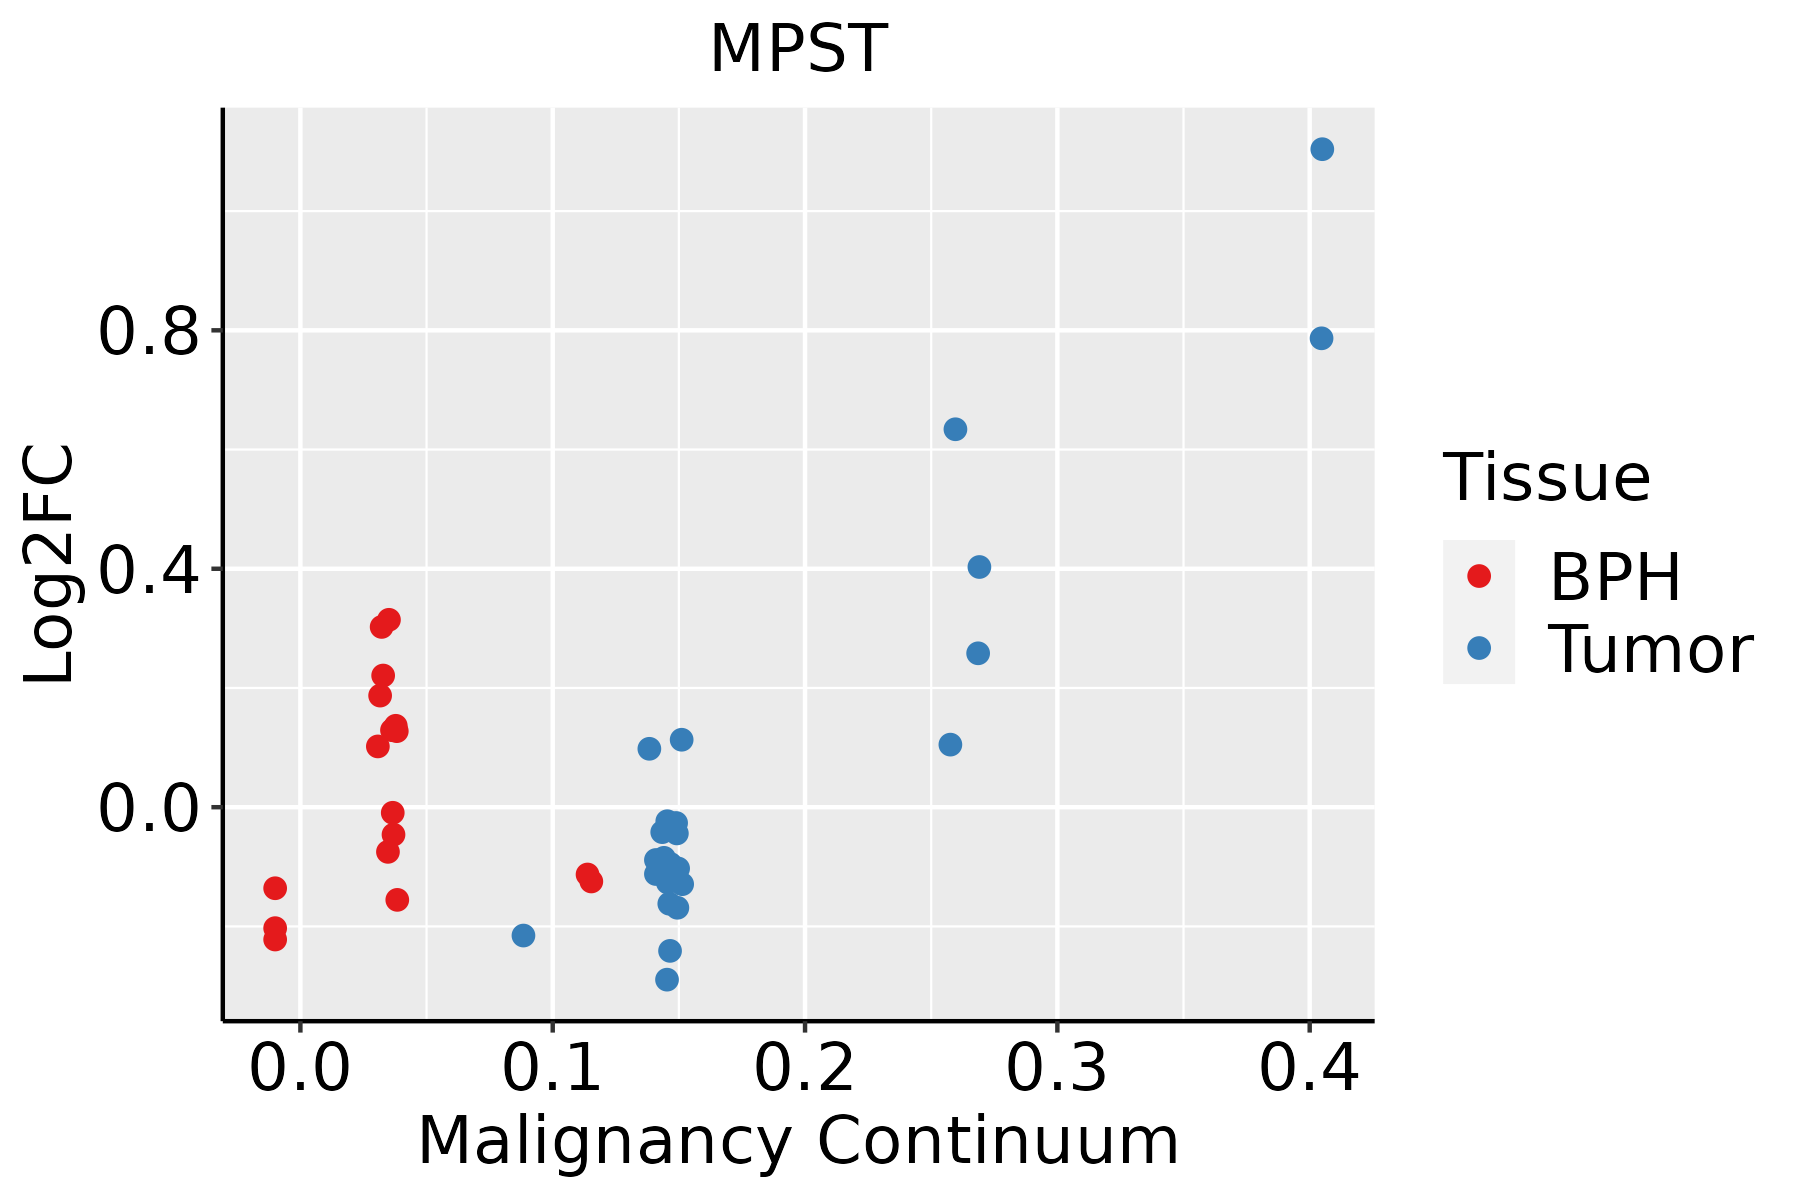 | BPH: Benign Prostatic Hyperplasia |
| Skin |  | AK: Actinic keratosis |
| cSCC: Cutaneous squamous cell carcinoma | ||
| SCCIS:squamous cell carcinoma in situ | ||
| Thyroid | 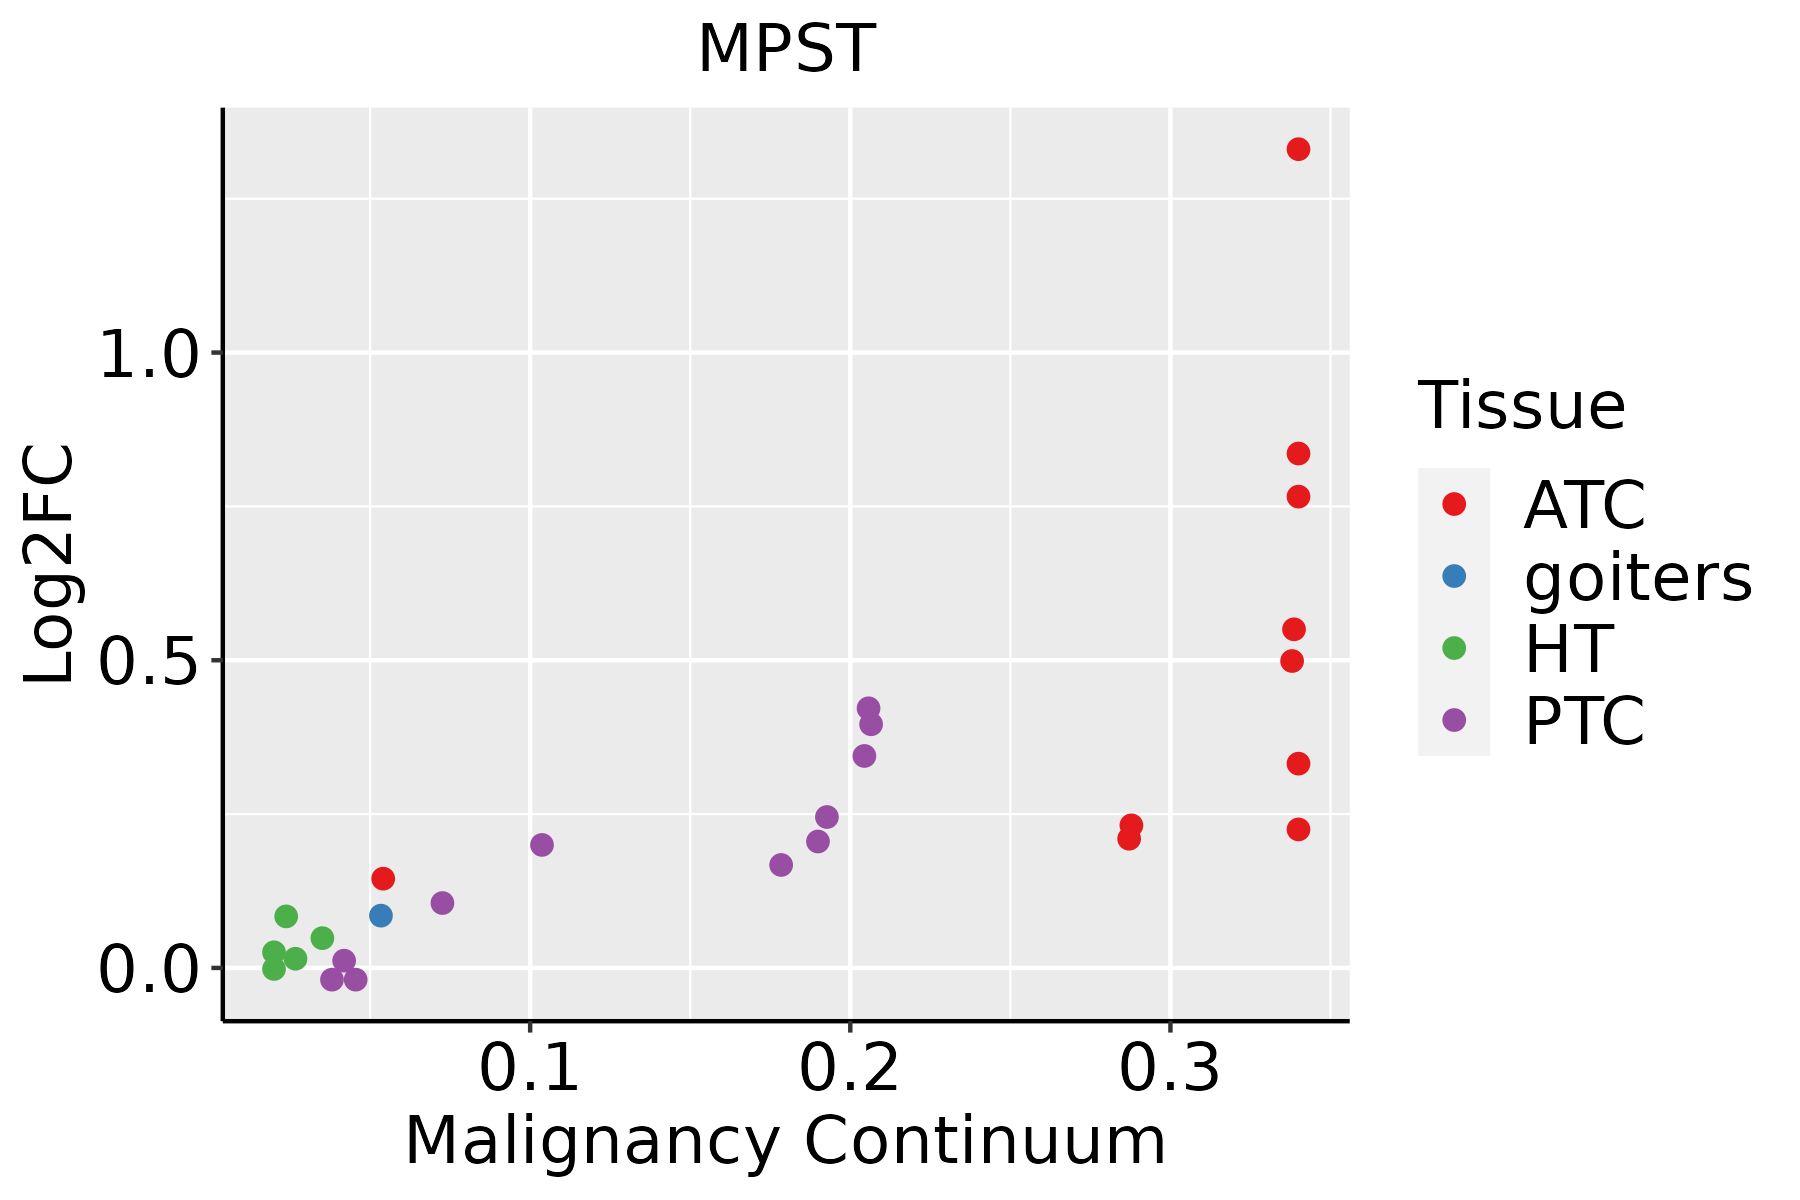 | ATC: Anaplastic thyroid cancer |
| HT: Hashimoto's thyroiditis | ||
| PTC: Papillary thyroid cancer |
| ∗log2FC in expression of this searched gene in stem-like cells from each diseased tissue sample relative to stem-like cells in normal samples in each tissue plotted against the malignancy continuum. Samples are colored based on if they are from different disease stage. |
Top |
Malignant transformation related pathway analysis |
| Find out the enriched GO biological processes and KEGG pathways involved in transition from healthy to precancer to cancer |
| Tissue | Disease Stage | Enriched GO biological Processes |
| Colorectum | AD |  |
| Colorectum | SER |  |
| Colorectum | MSS |  |
| Colorectum | MSI-H |  |
| Colorectum | FAP |  |
| ∗Top 15 enriched GO BP terms are showed in the bar plot of each disease state in each tissue. Each row represents a significant GO biological process which is colored according to the -log10(p.adjust). |
| Page: 1 2 3 4 5 6 7 8 9 |
| GO ID | Tissue | Disease Stage | Description | Gene Ratio | Bg Ratio | pvalue | p.adjust | Count |
| GO:00432445 | Oral cavity | OSCC | regulation of protein-containing complex disassembly | 65/7305 | 121/18723 | 7.08e-04 | 3.90e-03 | 65 |
| GO:00319293 | Oral cavity | OSCC | TOR signaling | 67/7305 | 126/18723 | 8.52e-04 | 4.50e-03 | 67 |
| GO:00016558 | Oral cavity | OSCC | urogenital system development | 160/7305 | 338/18723 | 1.03e-03 | 5.31e-03 | 160 |
| GO:00060068 | Oral cavity | OSCC | glucose metabolic process | 98/7305 | 196/18723 | 1.10e-03 | 5.63e-03 | 98 |
| GO:00714809 | Oral cavity | OSCC | cellular response to gamma radiation | 21/7305 | 31/18723 | 1.13e-03 | 5.75e-03 | 21 |
| GO:00609666 | Oral cavity | OSCC | regulation of gene silencing by RNA | 32/7305 | 53/18723 | 1.32e-03 | 6.56e-03 | 32 |
| GO:00609649 | Oral cavity | OSCC | regulation of gene silencing by miRNA | 30/7305 | 49/18723 | 1.35e-03 | 6.62e-03 | 30 |
| GO:00434142 | Oral cavity | OSCC | macromolecule methylation | 149/7305 | 316/18723 | 1.82e-03 | 8.60e-03 | 149 |
| GO:00601478 | Oral cavity | OSCC | regulation of posttranscriptional gene silencing | 31/7305 | 52/18723 | 2.08e-03 | 9.59e-03 | 31 |
| GO:00435167 | Oral cavity | OSCC | regulation of DNA damage response, signal transduction by p53 class mediator | 22/7305 | 34/18723 | 2.14e-03 | 9.81e-03 | 22 |
| GO:00442826 | Oral cavity | OSCC | small molecule catabolic process | 174/7305 | 376/18723 | 2.25e-03 | 1.00e-02 | 174 |
| GO:00605378 | Oral cavity | OSCC | muscle tissue development | 185/7305 | 403/18723 | 2.60e-03 | 1.14e-02 | 185 |
| GO:00192167 | Oral cavity | OSCC | regulation of lipid metabolic process | 154/7305 | 331/18723 | 3.00e-03 | 1.30e-02 | 154 |
| GO:00322591 | Oral cavity | OSCC | methylation | 168/7305 | 364/18723 | 3.03e-03 | 1.31e-02 | 168 |
| GO:00620128 | Oral cavity | OSCC | regulation of small molecule metabolic process | 155/7305 | 334/18723 | 3.30e-03 | 1.41e-02 | 155 |
| GO:0016572 | Oral cavity | OSCC | histone phosphorylation | 24/7305 | 39/18723 | 3.64e-03 | 1.51e-02 | 24 |
| GO:00603484 | Oral cavity | OSCC | bone development | 99/7305 | 205/18723 | 4.13e-03 | 1.68e-02 | 99 |
| GO:00310507 | Oral cavity | OSCC | dsRNA processing | 31/7305 | 54/18723 | 4.66e-03 | 1.87e-02 | 31 |
| GO:00709187 | Oral cavity | OSCC | production of small RNA involved in gene silencing by RNA | 31/7305 | 54/18723 | 4.66e-03 | 1.87e-02 | 31 |
| GO:00426927 | Oral cavity | OSCC | muscle cell differentiation | 175/7305 | 384/18723 | 4.79e-03 | 1.92e-02 | 175 |
| Page: 1 2 3 4 5 6 7 8 9 10 11 12 13 14 15 16 17 18 19 20 21 22 23 24 25 26 27 28 29 30 31 32 33 34 35 36 37 38 39 40 |
| Pathway ID | Tissue | Disease Stage | Description | Gene Ratio | Bg Ratio | pvalue | p.adjust | qvalue | Count |
| hsa00920 | Colorectum | AD | Sulfur metabolism | 8/2092 | 10/8465 | 3.78e-04 | 2.82e-03 | 1.80e-03 | 8 |
| hsa009201 | Colorectum | AD | Sulfur metabolism | 8/2092 | 10/8465 | 3.78e-04 | 2.82e-03 | 1.80e-03 | 8 |
| hsa009202 | Colorectum | SER | Sulfur metabolism | 8/1580 | 10/8465 | 4.56e-05 | 5.22e-04 | 3.79e-04 | 8 |
| hsa009203 | Colorectum | SER | Sulfur metabolism | 8/1580 | 10/8465 | 4.56e-05 | 5.22e-04 | 3.79e-04 | 8 |
| hsa009204 | Colorectum | MSS | Sulfur metabolism | 6/1875 | 10/8465 | 1.07e-02 | 3.74e-02 | 2.29e-02 | 6 |
| hsa009205 | Colorectum | MSS | Sulfur metabolism | 6/1875 | 10/8465 | 1.07e-02 | 3.74e-02 | 2.29e-02 | 6 |
| hsa009206 | Colorectum | FAP | Sulfur metabolism | 6/1404 | 10/8465 | 2.36e-03 | 1.13e-02 | 6.85e-03 | 6 |
| hsa009207 | Colorectum | FAP | Sulfur metabolism | 6/1404 | 10/8465 | 2.36e-03 | 1.13e-02 | 6.85e-03 | 6 |
| hsa002704 | Endometrium | EEC | Cysteine and methionine metabolism | 15/1237 | 52/8465 | 6.02e-03 | 3.12e-02 | 2.33e-02 | 15 |
| hsa0027011 | Endometrium | EEC | Cysteine and methionine metabolism | 15/1237 | 52/8465 | 6.02e-03 | 3.12e-02 | 2.33e-02 | 15 |
| hsa0092010 | Esophagus | ESCC | Sulfur metabolism | 9/4205 | 10/8465 | 1.01e-02 | 2.38e-02 | 1.22e-02 | 9 |
| hsa0092011 | Esophagus | ESCC | Sulfur metabolism | 9/4205 | 10/8465 | 1.01e-02 | 2.38e-02 | 1.22e-02 | 9 |
| hsa00270 | Liver | Cirrhotic | Cysteine and methionine metabolism | 27/2530 | 52/8465 | 6.98e-04 | 4.15e-03 | 2.56e-03 | 27 |
| hsa002701 | Liver | Cirrhotic | Cysteine and methionine metabolism | 27/2530 | 52/8465 | 6.98e-04 | 4.15e-03 | 2.56e-03 | 27 |
| hsa002702 | Liver | HCC | Cysteine and methionine metabolism | 35/4020 | 52/8465 | 3.03e-03 | 9.94e-03 | 5.53e-03 | 35 |
| hsa002703 | Liver | HCC | Cysteine and methionine metabolism | 35/4020 | 52/8465 | 3.03e-03 | 9.94e-03 | 5.53e-03 | 35 |
| Page: 1 |
Top |
Cell-cell communication analysis |
| Identification of potential cell-cell interactions between two cell types and their ligand-receptor pairs for different disease states |
| Ligand | Receptor | LRpair | Pathway | Tissue | Disease Stage |
| Page: 1 |
Top |
Single-cell gene regulatory network inference analysis |
| Find out the significant the regulons (TFs) and the target genes of each regulon across cell types for different disease states |
| TF | Cell Type | Tissue | Disease Stage | Target Gene | RSS | Regulon Activity |
| ∗The dot plots of a searched regulon are shown for all cell subpopulations in each disease state of each tissue based on the regulon specific score inferred using pySCENIC and by calculating the average expression. |
| Page: 1 |
Top |
Somatic mutation of malignant transformation related genes |
| Annotation of somatic variants for genes involved in malignant transformation |
| Hugo Symbol | Variant Class | Variant Classification | dbSNP RS | HGVSc | HGVSp | HGVSp Short | SWISSPROT | BIOTYPE | SIFT | PolyPhen | Tumor Sample Barcode | Tissue | Histology | Sex | Age | Stage | Therapy Types | Drugs | Outcome |
| MPST | SNV | Missense_Mutation | rs377346580 | c.916N>A | p.Glu306Lys | p.E306K | P25325 | protein_coding | deleterious(0.03) | benign(0.097) | TCGA-VS-A958-01 | Cervix | cervical & endocervical cancer | Female | <65 | I/II | Chemotherapy | cisplatin | CR |
| MPST | SNV | Missense_Mutation | c.664C>T | p.Pro222Ser | p.P222S | P25325 | protein_coding | tolerated(0.3) | benign(0.007) | TCGA-AD-A5EJ-01 | Colorectum | colon adenocarcinoma | Female | >=65 | I/II | Unknown | Unknown | SD | |
| MPST | SNV | Missense_Mutation | novel | c.587N>A | p.Arg196Gln | p.R196Q | P25325 | protein_coding | tolerated(0.16) | benign(0.003) | TCGA-A5-A1OF-01 | Endometrium | uterine corpus endometrioid carcinoma | Female | <65 | I/II | Unknown | Unknown | SD |
| MPST | SNV | Missense_Mutation | novel | c.469N>T | p.Arg157Cys | p.R157C | P25325 | protein_coding | deleterious(0.01) | possibly_damaging(0.546) | TCGA-AJ-A3BG-01 | Endometrium | uterine corpus endometrioid carcinoma | Female | >=65 | I/II | Chemotherapy | carboplatin | PD |
| MPST | SNV | Missense_Mutation | novel | c.431N>T | p.Ala144Val | p.A144V | P25325 | protein_coding | tolerated(0.08) | benign(0.023) | TCGA-AP-A1DK-01 | Endometrium | uterine corpus endometrioid carcinoma | Female | <65 | I/II | Unknown | Unknown | SD |
| MPST | SNV | Missense_Mutation | novel | c.949N>T | p.His317Tyr | p.H317Y | P25325 | protein_coding | deleterious_low_confidence(0.01) | benign(0.007) | TCGA-AP-A1DK-01 | Endometrium | uterine corpus endometrioid carcinoma | Female | <65 | I/II | Unknown | Unknown | SD |
| MPST | SNV | Missense_Mutation | novel | c.389C>T | p.Ala130Val | p.A130V | P25325 | protein_coding | deleterious(0) | probably_damaging(0.996) | TCGA-AX-A2HJ-01 | Endometrium | uterine corpus endometrioid carcinoma | Female | <65 | I/II | Unknown | Unknown | SD |
| MPST | SNV | Missense_Mutation | novel | c.476N>T | p.Asn159Ile | p.N159I | P25325 | protein_coding | deleterious(0) | benign(0.123) | TCGA-B5-A3FC-01 | Endometrium | uterine corpus endometrioid carcinoma | Female | <65 | I/II | Unknown | Unknown | SD |
| MPST | SNV | Missense_Mutation | novel | c.632G>A | p.Gly211Asp | p.G211D | P25325 | protein_coding | deleterious(0) | probably_damaging(0.996) | TCGA-DF-A2KU-01 | Endometrium | uterine corpus endometrioid carcinoma | Female | Unknown | I/II | Unknown | Unknown | SD |
| MPST | SNV | Missense_Mutation | novel | c.433G>A | p.Val145Met | p.V145M | P25325 | protein_coding | deleterious(0) | probably_damaging(0.998) | TCGA-FI-A2D0-01 | Endometrium | uterine corpus endometrioid carcinoma | Female | <65 | I/II | Unknown | Unknown | SD |
| Page: 1 2 |
Top |
Related drugs of malignant transformation related genes |
| Identification of chemicals and drugs interact with genes involved in malignant transfromation |
| (DGIdb 4.0) |
| Entrez ID | Symbol | Category | Interaction Types | Drug Claim Name | Drug Name | PMIDs |
| 4357 | MPST | ENZYME, DRUGGABLE GENOME | inhibitor | 381744892 | ||
| 4357 | MPST | ENZYME, DRUGGABLE GENOME | THYROXINE | THYROXINE | 10709617 |
| Page: 1 |

Copyright 2023-Present -The University of Texas Health Science Center at Houston |