
|
|||||
|
 | |
| |
| |
| |
| |
| |
|
Gene: IRS2 |
Gene summary for IRS2 |
| Gene information | Species | Human | Gene symbol | IRS2 | Gene ID | 8660 |
| Gene name | insulin receptor substrate 2 | |
| Gene Alias | IRS-2 | |
| Cytomap | 13q34 | |
| Gene Type | protein-coding | GO ID | GO:0000271 | UniProtAcc | Q9P084 |
Top |
Malignant transformation analysis |
| Identification of the aberrant gene expression in precancerous and cancerous lesions by comparing the gene expression of stem-like cells in diseased tissues with normal stem cells |
| Entrez ID | Symbol | Replicates | Species | Organ | Tissue | Adj P-value | Log2FC | Malignancy |
| 8660 | IRS2 | HTA11_1938_2000001011 | Human | Colorectum | AD | 1.83e-12 | 8.53e-01 | -0.0811 |
| 8660 | IRS2 | HTA11_78_2000001011 | Human | Colorectum | AD | 3.11e-02 | 4.21e-01 | -0.1088 |
| 8660 | IRS2 | HTA11_99999970781_79442 | Human | Colorectum | MSS | 3.97e-70 | 1.89e+00 | 0.294 |
| 8660 | IRS2 | HTA11_99999965062_69753 | Human | Colorectum | MSI-H | 5.50e-05 | 1.14e+00 | 0.3487 |
| 8660 | IRS2 | HTA11_99999965104_69814 | Human | Colorectum | MSS | 2.43e-21 | 1.22e+00 | 0.281 |
| 8660 | IRS2 | HTA11_99999971662_82457 | Human | Colorectum | MSS | 1.01e-50 | 1.89e+00 | 0.3859 |
| 8660 | IRS2 | HTA11_99999973899_84307 | Human | Colorectum | MSS | 2.26e-26 | 2.16e+00 | 0.2585 |
| 8660 | IRS2 | A015-C-203 | Human | Colorectum | FAP | 2.86e-07 | -1.97e-01 | -0.1294 |
| 8660 | IRS2 | A002-C-205 | Human | Colorectum | FAP | 7.96e-04 | -2.27e-01 | -0.1236 |
| 8660 | IRS2 | A015-C-106 | Human | Colorectum | FAP | 3.62e-03 | -1.53e-01 | -0.0511 |
| 8660 | IRS2 | A015-C-104 | Human | Colorectum | FAP | 1.69e-05 | -1.65e-01 | -0.1899 |
| 8660 | IRS2 | A002-C-116 | Human | Colorectum | FAP | 4.37e-05 | -1.84e-01 | -0.0452 |
| 8660 | IRS2 | F034 | Human | Colorectum | FAP | 1.02e-03 | -1.50e-01 | -0.0665 |
| 8660 | IRS2 | LZE4T | Human | Esophagus | ESCC | 4.16e-07 | -2.52e-01 | 0.0811 |
| 8660 | IRS2 | LZE8T | Human | Esophagus | ESCC | 1.29e-04 | -3.01e-01 | 0.067 |
| 8660 | IRS2 | LZE22D1 | Human | Esophagus | HGIN | 1.22e-02 | -4.29e-01 | 0.0595 |
| 8660 | IRS2 | LZE24T | Human | Esophagus | ESCC | 7.48e-17 | -2.60e-01 | 0.0596 |
| 8660 | IRS2 | LZE6T | Human | Esophagus | ESCC | 1.69e-02 | -4.77e-01 | 0.0845 |
| 8660 | IRS2 | P2T-E | Human | Esophagus | ESCC | 4.46e-12 | 2.83e-02 | 0.1177 |
| 8660 | IRS2 | P4T-E | Human | Esophagus | ESCC | 6.28e-11 | -1.73e-01 | 0.1323 |
| Page: 1 2 3 4 5 |
| Tissue | Expression Dynamics | Abbreviation |
| Colorectum (GSE201348) |  | FAP: Familial adenomatous polyposis |
| CRC: Colorectal cancer | ||
| Colorectum (HTA11) | 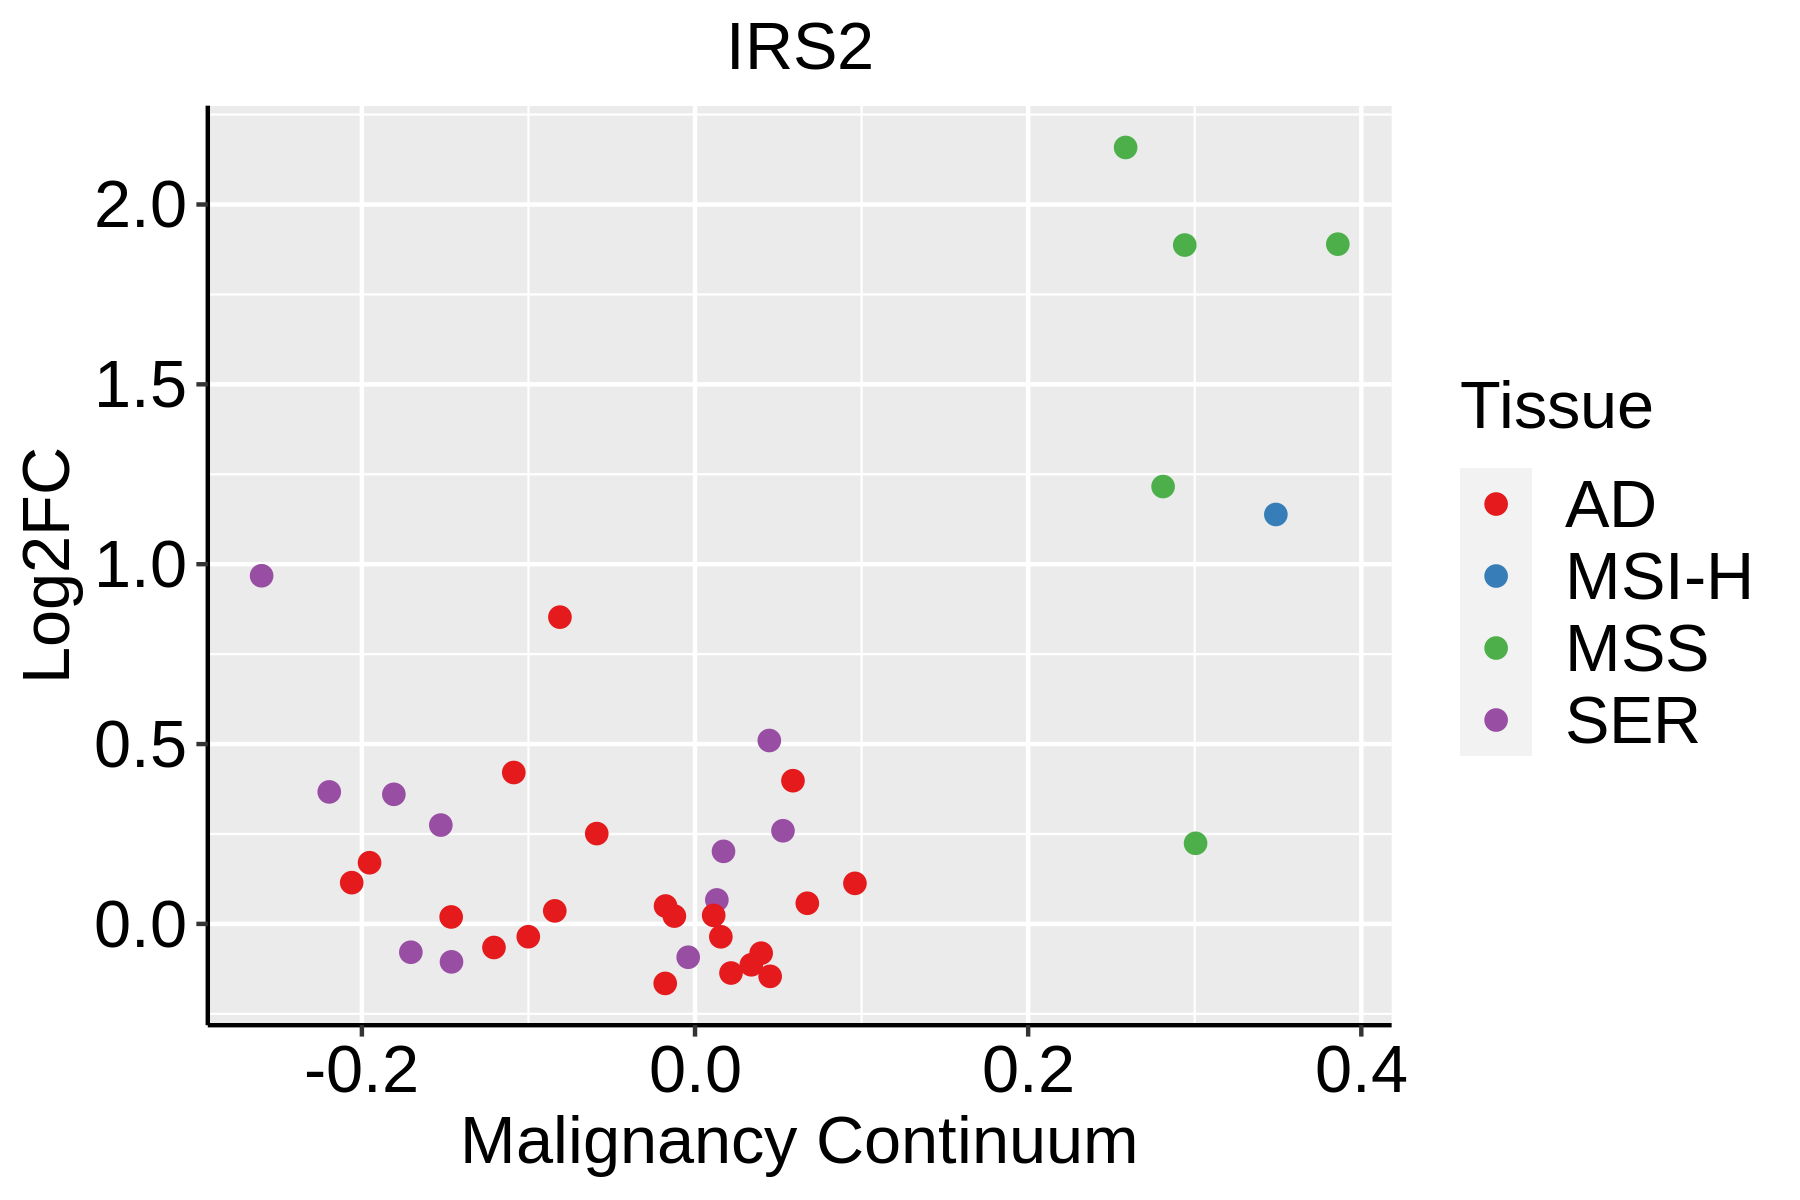 | AD: Adenomas |
| SER: Sessile serrated lesions | ||
| MSI-H: Microsatellite-high colorectal cancer | ||
| MSS: Microsatellite stable colorectal cancer | ||
| Esophagus | 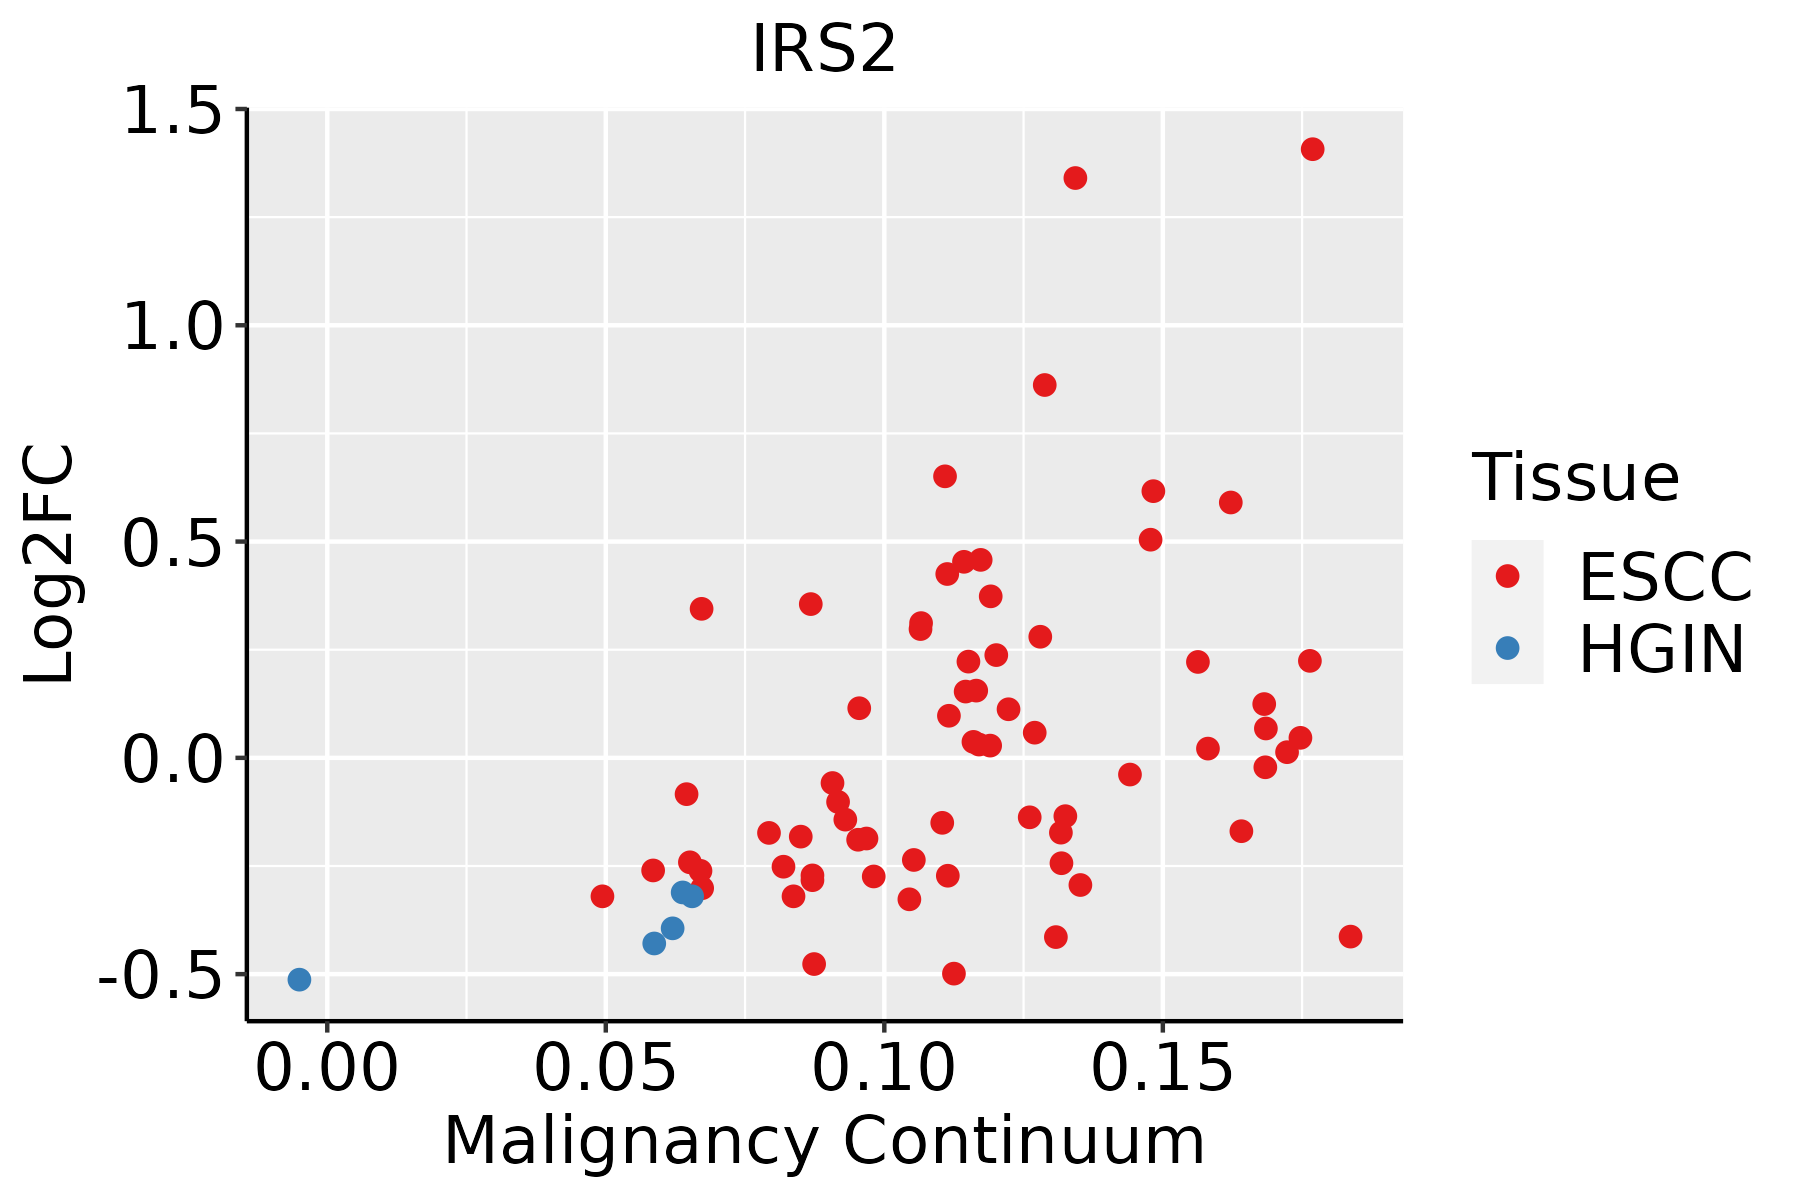 | ESCC: Esophageal squamous cell carcinoma |
| HGIN: High-grade intraepithelial neoplasias | ||
| LGIN: Low-grade intraepithelial neoplasias | ||
| Liver |  | HCC: Hepatocellular carcinoma |
| NAFLD: Non-alcoholic fatty liver disease | ||
| Oral Cavity | 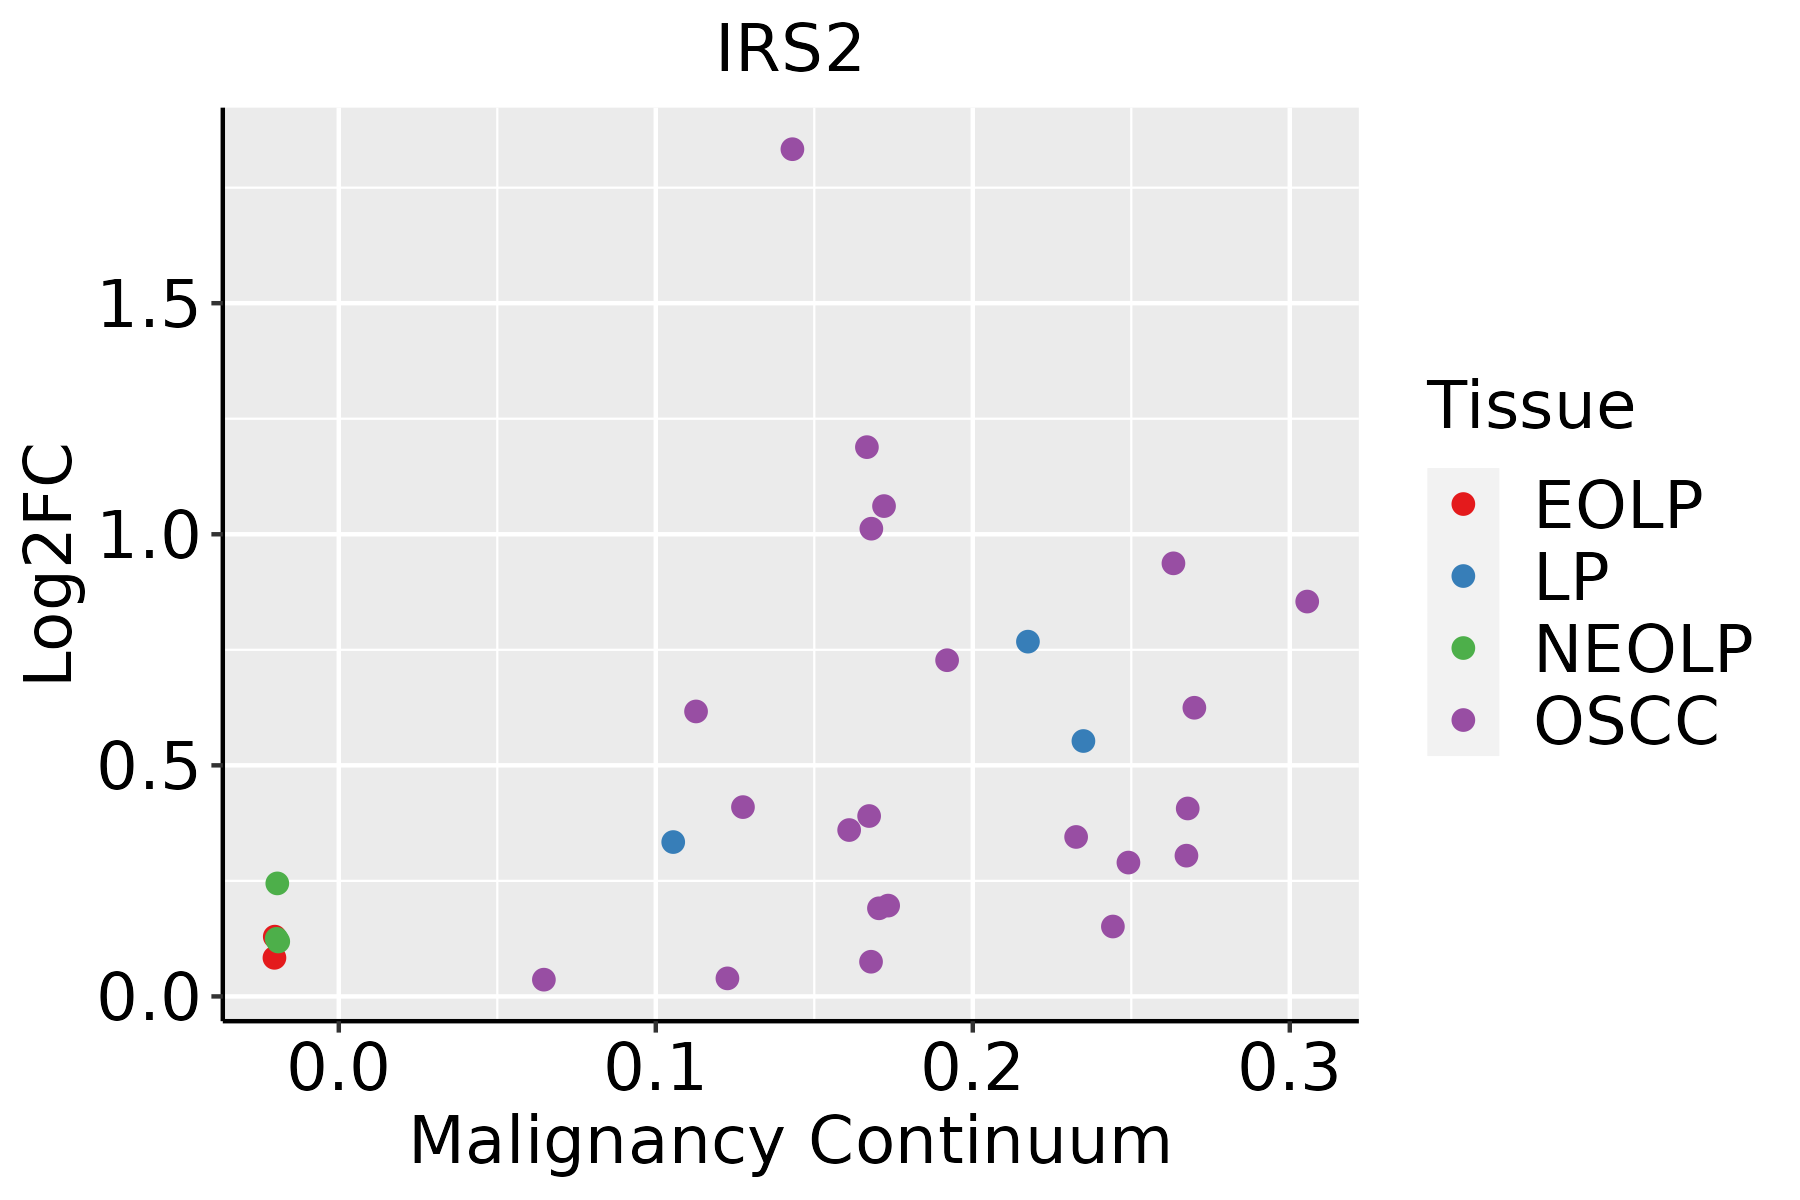 | EOLP: Erosive Oral lichen planus |
| LP: leukoplakia | ||
| NEOLP: Non-erosive oral lichen planus | ||
| OSCC: Oral squamous cell carcinoma | ||
| Prostate | 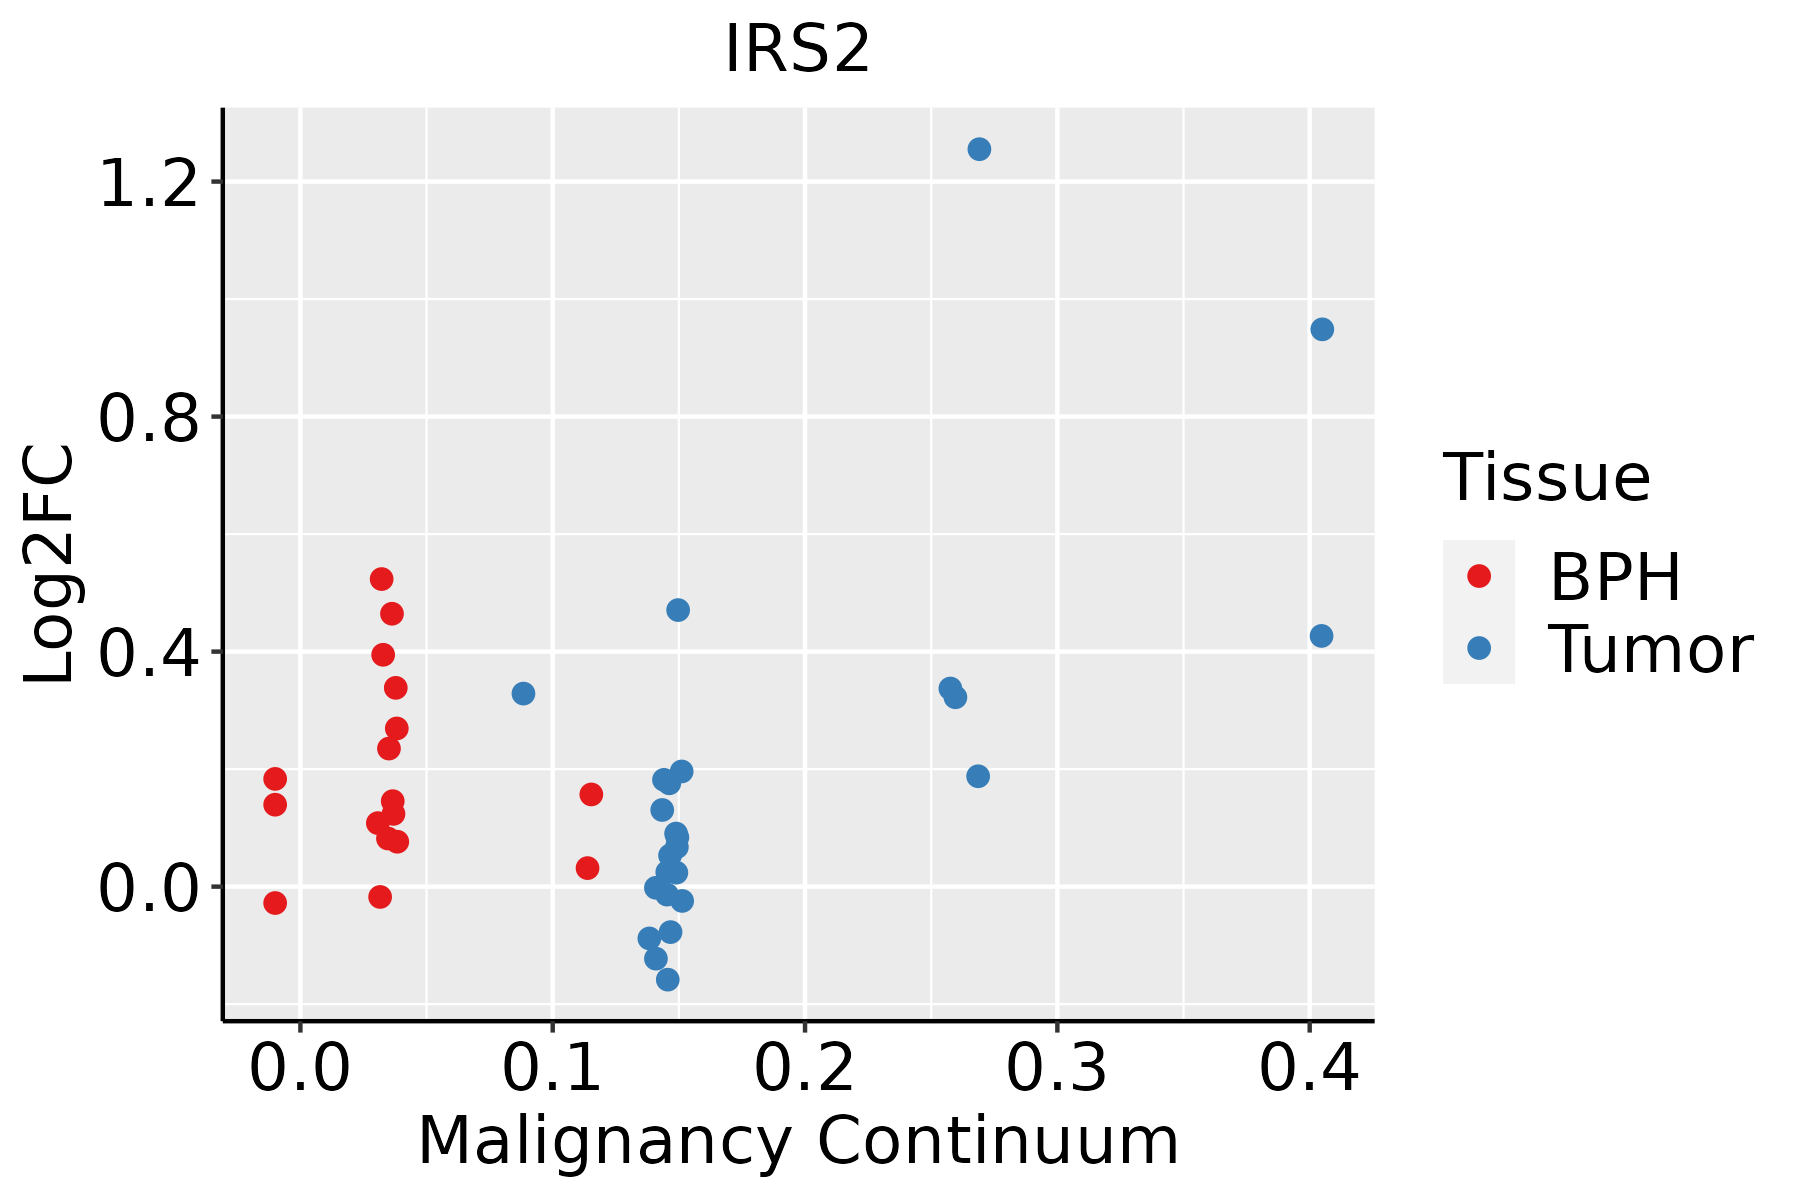 | BPH: Benign Prostatic Hyperplasia |
| ∗log2FC in expression of this searched gene in stem-like cells from each diseased tissue sample relative to stem-like cells in normal samples in each tissue plotted against the malignancy continuum. Samples are colored based on if they are from different disease stage. |
Top |
Malignant transformation related pathway analysis |
| Find out the enriched GO biological processes and KEGG pathways involved in transition from healthy to precancer to cancer |
| Tissue | Disease Stage | Enriched GO biological Processes |
| Colorectum | AD |  |
| Colorectum | SER |  |
| Colorectum | MSS |  |
| Colorectum | MSI-H |  |
| Colorectum | FAP |  |
| ∗Top 15 enriched GO BP terms are showed in the bar plot of each disease state in each tissue. Each row represents a significant GO biological process which is colored according to the -log10(p.adjust). |
| Page: 1 2 3 4 5 6 7 8 9 |
| GO ID | Tissue | Disease Stage | Description | Gene Ratio | Bg Ratio | pvalue | p.adjust | Count |
| GO:007137511 | Liver | Cirrhotic | cellular response to peptide hormone stimulus | 110/4634 | 290/18723 | 3.73e-07 | 8.82e-06 | 110 |
| GO:000906211 | Liver | Cirrhotic | fatty acid catabolic process | 48/4634 | 100/18723 | 3.87e-07 | 9.13e-06 | 48 |
| GO:004873212 | Liver | Cirrhotic | gland development | 154/4634 | 436/18723 | 4.03e-07 | 9.42e-06 | 154 |
| GO:004346712 | Liver | Cirrhotic | regulation of generation of precursor metabolites and energy | 58/4634 | 130/18723 | 5.81e-07 | 1.28e-05 | 58 |
| GO:000663512 | Liver | Cirrhotic | fatty acid beta-oxidation | 38/4634 | 74/18723 | 7.41e-07 | 1.57e-05 | 38 |
| GO:004593612 | Liver | Cirrhotic | negative regulation of phosphate metabolic process | 154/4634 | 441/18723 | 8.78e-07 | 1.83e-05 | 154 |
| GO:001056312 | Liver | Cirrhotic | negative regulation of phosphorus metabolic process | 154/4634 | 442/18723 | 1.02e-06 | 2.11e-05 | 154 |
| GO:190165311 | Liver | Cirrhotic | cellular response to peptide | 129/4634 | 359/18723 | 1.23e-06 | 2.49e-05 | 129 |
| GO:000974612 | Liver | Cirrhotic | response to hexose | 86/4634 | 219/18723 | 1.30e-06 | 2.59e-05 | 86 |
| GO:003286911 | Liver | Cirrhotic | cellular response to insulin stimulus | 80/4634 | 203/18723 | 2.55e-06 | 4.63e-05 | 80 |
| GO:001921611 | Liver | Cirrhotic | regulation of lipid metabolic process | 119/4634 | 331/18723 | 3.05e-06 | 5.39e-05 | 119 |
| GO:004232612 | Liver | Cirrhotic | negative regulation of phosphorylation | 135/4634 | 385/18723 | 3.17e-06 | 5.58e-05 | 135 |
| GO:00097497 | Liver | Cirrhotic | response to glucose | 82/4634 | 212/18723 | 4.54e-06 | 7.51e-05 | 82 |
| GO:004424212 | Liver | Cirrhotic | cellular lipid catabolic process | 82/4634 | 214/18723 | 6.91e-06 | 1.08e-04 | 82 |
| GO:000610911 | Liver | Cirrhotic | regulation of carbohydrate metabolic process | 70/4634 | 178/18723 | 1.14e-05 | 1.62e-04 | 70 |
| GO:004218011 | Liver | Cirrhotic | cellular ketone metabolic process | 80/4634 | 211/18723 | 1.40e-05 | 1.95e-04 | 80 |
| GO:001604212 | Liver | Cirrhotic | lipid catabolic process | 112/4634 | 320/18723 | 2.31e-05 | 3.03e-04 | 112 |
| GO:003286811 | Liver | Cirrhotic | response to insulin | 95/4634 | 264/18723 | 2.77e-05 | 3.54e-04 | 95 |
| GO:001087611 | Liver | Cirrhotic | lipid localization | 147/4634 | 448/18723 | 6.24e-05 | 7.12e-04 | 147 |
| GO:005134812 | Liver | Cirrhotic | negative regulation of transferase activity | 93/4634 | 268/18723 | 1.55e-04 | 1.47e-03 | 93 |
| Page: 1 2 3 4 5 6 7 8 9 10 11 12 13 14 15 16 17 18 19 20 21 22 23 24 25 26 27 28 29 30 31 32 33 34 35 36 |
| Pathway ID | Tissue | Disease Stage | Description | Gene Ratio | Bg Ratio | pvalue | p.adjust | qvalue | Count |
| hsa05010 | Colorectum | AD | Alzheimer disease | 174/2092 | 384/8465 | 1.82e-19 | 9.26e-18 | 5.91e-18 | 174 |
| hsa04932 | Colorectum | AD | Non-alcoholic fatty liver disease | 90/2092 | 155/8465 | 4.83e-19 | 1.80e-17 | 1.15e-17 | 90 |
| hsa04152 | Colorectum | AD | AMPK signaling pathway | 47/2092 | 121/8465 | 3.74e-04 | 2.82e-03 | 1.80e-03 | 47 |
| hsa04213 | Colorectum | AD | Longevity regulating pathway - multiple species | 27/2092 | 62/8465 | 8.72e-04 | 5.96e-03 | 3.80e-03 | 27 |
| hsa04140 | Colorectum | AD | Autophagy - animal | 49/2092 | 141/8465 | 4.58e-03 | 2.20e-02 | 1.40e-02 | 49 |
| hsa04211 | Colorectum | AD | Longevity regulating pathway | 33/2092 | 89/8465 | 6.15e-03 | 2.68e-02 | 1.71e-02 | 33 |
| hsa050101 | Colorectum | AD | Alzheimer disease | 174/2092 | 384/8465 | 1.82e-19 | 9.26e-18 | 5.91e-18 | 174 |
| hsa049321 | Colorectum | AD | Non-alcoholic fatty liver disease | 90/2092 | 155/8465 | 4.83e-19 | 1.80e-17 | 1.15e-17 | 90 |
| hsa041521 | Colorectum | AD | AMPK signaling pathway | 47/2092 | 121/8465 | 3.74e-04 | 2.82e-03 | 1.80e-03 | 47 |
| hsa042131 | Colorectum | AD | Longevity regulating pathway - multiple species | 27/2092 | 62/8465 | 8.72e-04 | 5.96e-03 | 3.80e-03 | 27 |
| hsa041401 | Colorectum | AD | Autophagy - animal | 49/2092 | 141/8465 | 4.58e-03 | 2.20e-02 | 1.40e-02 | 49 |
| hsa042111 | Colorectum | AD | Longevity regulating pathway | 33/2092 | 89/8465 | 6.15e-03 | 2.68e-02 | 1.71e-02 | 33 |
| hsa050104 | Colorectum | MSS | Alzheimer disease | 169/1875 | 384/8465 | 1.21e-22 | 1.01e-20 | 6.21e-21 | 169 |
| hsa049324 | Colorectum | MSS | Non-alcoholic fatty liver disease | 85/1875 | 155/8465 | 4.19e-19 | 1.17e-17 | 7.17e-18 | 85 |
| hsa042134 | Colorectum | MSS | Longevity regulating pathway - multiple species | 27/1875 | 62/8465 | 1.33e-04 | 1.17e-03 | 7.18e-04 | 27 |
| hsa04935 | Colorectum | MSS | Growth hormone synthesis, secretion and action | 42/1875 | 120/8465 | 8.17e-04 | 5.16e-03 | 3.16e-03 | 42 |
| hsa042112 | Colorectum | MSS | Longevity regulating pathway | 33/1875 | 89/8465 | 9.33e-04 | 5.58e-03 | 3.42e-03 | 33 |
| hsa041522 | Colorectum | MSS | AMPK signaling pathway | 41/1875 | 121/8465 | 1.91e-03 | 9.83e-03 | 6.03e-03 | 41 |
| hsa041404 | Colorectum | MSS | Autophagy - animal | 45/1875 | 141/8465 | 4.42e-03 | 1.90e-02 | 1.16e-02 | 45 |
| hsa04931 | Colorectum | MSS | Insulin resistance | 36/1875 | 108/8465 | 4.74e-03 | 2.01e-02 | 1.23e-02 | 36 |
| Page: 1 2 3 4 5 6 7 8 9 |
Top |
Cell-cell communication analysis |
| Identification of potential cell-cell interactions between two cell types and their ligand-receptor pairs for different disease states |
| Ligand | Receptor | LRpair | Pathway | Tissue | Disease Stage |
| Page: 1 |
Top |
Single-cell gene regulatory network inference analysis |
| Find out the significant the regulons (TFs) and the target genes of each regulon across cell types for different disease states |
| TF | Cell Type | Tissue | Disease Stage | Target Gene | RSS | Regulon Activity |
| ∗The dot plots of a searched regulon are shown for all cell subpopulations in each disease state of each tissue based on the regulon specific score inferred using pySCENIC and by calculating the average expression. |
| Page: 1 |
Top |
Somatic mutation of malignant transformation related genes |
| Annotation of somatic variants for genes involved in malignant transformation |
| Hugo Symbol | Variant Class | Variant Classification | dbSNP RS | HGVSc | HGVSp | HGVSp Short | SWISSPROT | BIOTYPE | SIFT | PolyPhen | Tumor Sample Barcode | Tissue | Histology | Sex | Age | Stage | Therapy Types | Drugs | Outcome |
| IRS2 | SNV | Missense_Mutation | novel | c.3410N>A | p.Arg1137His | p.R1137H | Q9Y4H2 | protein_coding | deleterious(0) | probably_damaging(0.994) | TCGA-5M-AAT6-01 | Colorectum | colon adenocarcinoma | Female | <65 | III/IV | Unknown | Unknown | PD |
| IRS2 | SNV | Missense_Mutation | c.2272N>T | p.Gly758Cys | p.G758C | Q9Y4H2 | protein_coding | deleterious(0) | possibly_damaging(0.65) | TCGA-A6-2686-01 | Colorectum | colon adenocarcinoma | Female | >=65 | I/II | Unknown | Unknown | SD | |
| IRS2 | SNV | Missense_Mutation | c.2411N>T | p.Ser804Ile | p.S804I | Q9Y4H2 | protein_coding | tolerated(0.38) | possibly_damaging(0.571) | TCGA-AY-6197-01 | Colorectum | colon adenocarcinoma | Male | <65 | I/II | Unknown | Unknown | SD | |
| IRS2 | SNV | Missense_Mutation | novel | c.1617N>A | p.Phe539Leu | p.F539L | Q9Y4H2 | protein_coding | tolerated(1) | benign(0) | TCGA-AZ-4315-01 | Colorectum | colon adenocarcinoma | Male | <65 | I/II | Unknown | Unknown | SD |
| IRS2 | SNV | Missense_Mutation | c.1879N>T | p.Pro627Ser | p.P627S | Q9Y4H2 | protein_coding | tolerated(0.45) | probably_damaging(0.986) | TCGA-CK-4951-01 | Colorectum | colon adenocarcinoma | Female | >=65 | I/II | Unknown | Unknown | PD | |
| IRS2 | SNV | Missense_Mutation | c.974N>G | p.His325Arg | p.H325R | Q9Y4H2 | protein_coding | tolerated(0.63) | benign(0.015) | TCGA-CM-4746-01 | Colorectum | colon adenocarcinoma | Male | <65 | I/II | Unknown | Unknown | SD | |
| IRS2 | SNV | Missense_Mutation | rs767024195 | c.2392G>A | p.Val798Ile | p.V798I | Q9Y4H2 | protein_coding | tolerated(0.47) | benign(0.001) | TCGA-G4-6309-01 | Colorectum | colon adenocarcinoma | Female | <65 | III/IV | Chemotherapy | xeloda | PD |
| IRS2 | SNV | Missense_Mutation | c.3523N>A | p.Ala1175Thr | p.A1175T | Q9Y4H2 | protein_coding | deleterious(0.02) | probably_damaging(0.992) | TCGA-G4-6588-01 | Colorectum | colon adenocarcinoma | Female | <65 | I/II | Unknown | Unknown | SD | |
| IRS2 | SNV | Missense_Mutation | novel | c.1948N>T | p.Asp650Tyr | p.D650Y | Q9Y4H2 | protein_coding | deleterious(0) | probably_damaging(0.915) | TCGA-A5-A0G1-01 | Endometrium | uterine corpus endometrioid carcinoma | Female | >=65 | I/II | Unknown | Unknown | SD |
| IRS2 | SNV | Missense_Mutation | novel | c.1808C>T | p.Ala603Val | p.A603V | Q9Y4H2 | protein_coding | tolerated(0.11) | benign(0.311) | TCGA-A5-A1OF-01 | Endometrium | uterine corpus endometrioid carcinoma | Female | <65 | I/II | Unknown | Unknown | SD |
| Page: 1 2 3 4 5 |
Top |
Related drugs of malignant transformation related genes |
| Identification of chemicals and drugs interact with genes involved in malignant transfromation |
| (DGIdb 4.0) |
| Entrez ID | Symbol | Category | Interaction Types | Drug Claim Name | Drug Name | PMIDs |
| 8660 | IRS2 | KINASE, CLINICALLY ACTIONABLE | DEXAMETHASONE | DEXAMETHASONE | 16943575 | |
| 8660 | IRS2 | KINASE, CLINICALLY ACTIONABLE | ASPIRIN | ASPIRIN | 18059035 | |
| 8660 | IRS2 | KINASE, CLINICALLY ACTIONABLE | INSULIN | INSULIN | 11522686,9421369,16037106,12687350 | |
| 8660 | IRS2 | KINASE, CLINICALLY ACTIONABLE | DUAL IGF-1R/INSR INHIBITOR BMS-754807 | 25527633 |
| Page: 1 |

Copyright 2023-Present -The University of Texas Health Science Center at Houston |