Schematic overview of the cellular and molecular mechanisms involved in the cancer progression, including the proposed cellular and molecular mechanisms in cancer cells trajectory. AT1: alveolar type 1 cells; AT2: alveolar type 2 cells; AAH: atypical adenomatous hyperplasia; AIS: adenocarcinoma in situ; MIA: minimally invasive adenocarcinoma; IA: invasive adenocarcinoma; EMT: epithelial-mesenchymal transition

Home

Download

Statistics

Help

Contact

Center for Computational Systems Medicine
leaf

Gene summary

leaf

Malignant transformation analysis

leaf

Malignant transformation related pathway analysis

leaf

Cell-cell communication analysis

leaf

Single-cell gene regulatory network inference analysis

leaf

Somatic mutation of malignant transformation related genes

leaf

Related drugs of malignant transformation related genes

Gene: INSIG1

Gene summary for INSIG1

check button Gene summary.

Gene informationSpeciesHuman
Gene symbol

INSIG1

Gene ID

3638

Gene nameinsulin induced gene 1
Gene AliasCL6
Cytomap7q36.3
Gene Typeprotein-coding
GO ID

GO:0001501

UniProtAcc

A4D2M9


Top

Malignant transformation analysis

check button Identification of the aberrant gene expression in precancerous and cancerous lesions by comparing the gene expression of stem-like cells in diseased tissues with normal stem cells
check button Malignant transformation involving gene list.
Entrez IDSymbolReplicatesSpeciesOrganTissueAdj P-valueLog2FCMalignancy
3638INSIG1LZE2THumanEsophagusESCC2.88e-047.22e-010.082
3638INSIG1LZE4THumanEsophagusESCC2.76e-035.46e-010.0811
3638INSIG1LZE8THumanEsophagusESCC7.53e-03-1.77e-010.067
3638INSIG1LZE20THumanEsophagusESCC6.94e-073.14e-020.0662
3638INSIG1LZE24THumanEsophagusESCC2.17e-056.54e-010.0596
3638INSIG1LZE21THumanEsophagusESCC1.74e-038.17e-010.0655
3638INSIG1LZE6THumanEsophagusESCC7.89e-04-2.89e-010.0845
3638INSIG1P2T-EHumanEsophagusESCC8.61e-042.69e-010.1177
3638INSIG1P4T-EHumanEsophagusESCC1.44e-341.94e+000.1323
3638INSIG1P5T-EHumanEsophagusESCC5.11e-341.71e+000.1327
3638INSIG1P8T-EHumanEsophagusESCC8.58e-063.81e-010.0889
3638INSIG1P9T-EHumanEsophagusESCC8.46e-107.51e-010.1131
3638INSIG1P10T-EHumanEsophagusESCC1.25e-401.86e+000.116
3638INSIG1P11T-EHumanEsophagusESCC1.23e-049.38e-010.1426
3638INSIG1P12T-EHumanEsophagusESCC3.20e-073.15e-010.1122
3638INSIG1P15T-EHumanEsophagusESCC3.38e-271.46e+000.1149
3638INSIG1P17T-EHumanEsophagusESCC1.27e-02-1.90e-020.1278
3638INSIG1P20T-EHumanEsophagusESCC9.48e-168.70e-010.1124
3638INSIG1P21T-EHumanEsophagusESCC6.17e-191.43e+000.1617
3638INSIG1P22T-EHumanEsophagusESCC4.16e-239.29e-010.1236
Page: 1 2 3 4 5 6 7 

check button Transcriptomic changes along malignancy continuum.
TissueExpression DynamicsAbbreviation
EsophagusThe image shows the transcriptomic changes along malignancy continuum.log2FC in expression of this searched gene in stem-like cells from each diseased tissue sample relative to stem-like cells in normal samples in each tissue plotted against the malignancy continuum. Samples are colored based on if they are from different disease stage.ESCC: Esophageal squamous cell carcinoma
HGIN: High-grade intraepithelial neoplasias
LGIN: Low-grade intraepithelial neoplasias
GCThe image shows the transcriptomic changes along malignancy continuum.log2FC in expression of this searched gene in stem-like cells from each diseased tissue sample relative to stem-like cells in normal samples in each tissue plotted against the malignancy continuum. Samples are colored based on if they are from different disease stage.
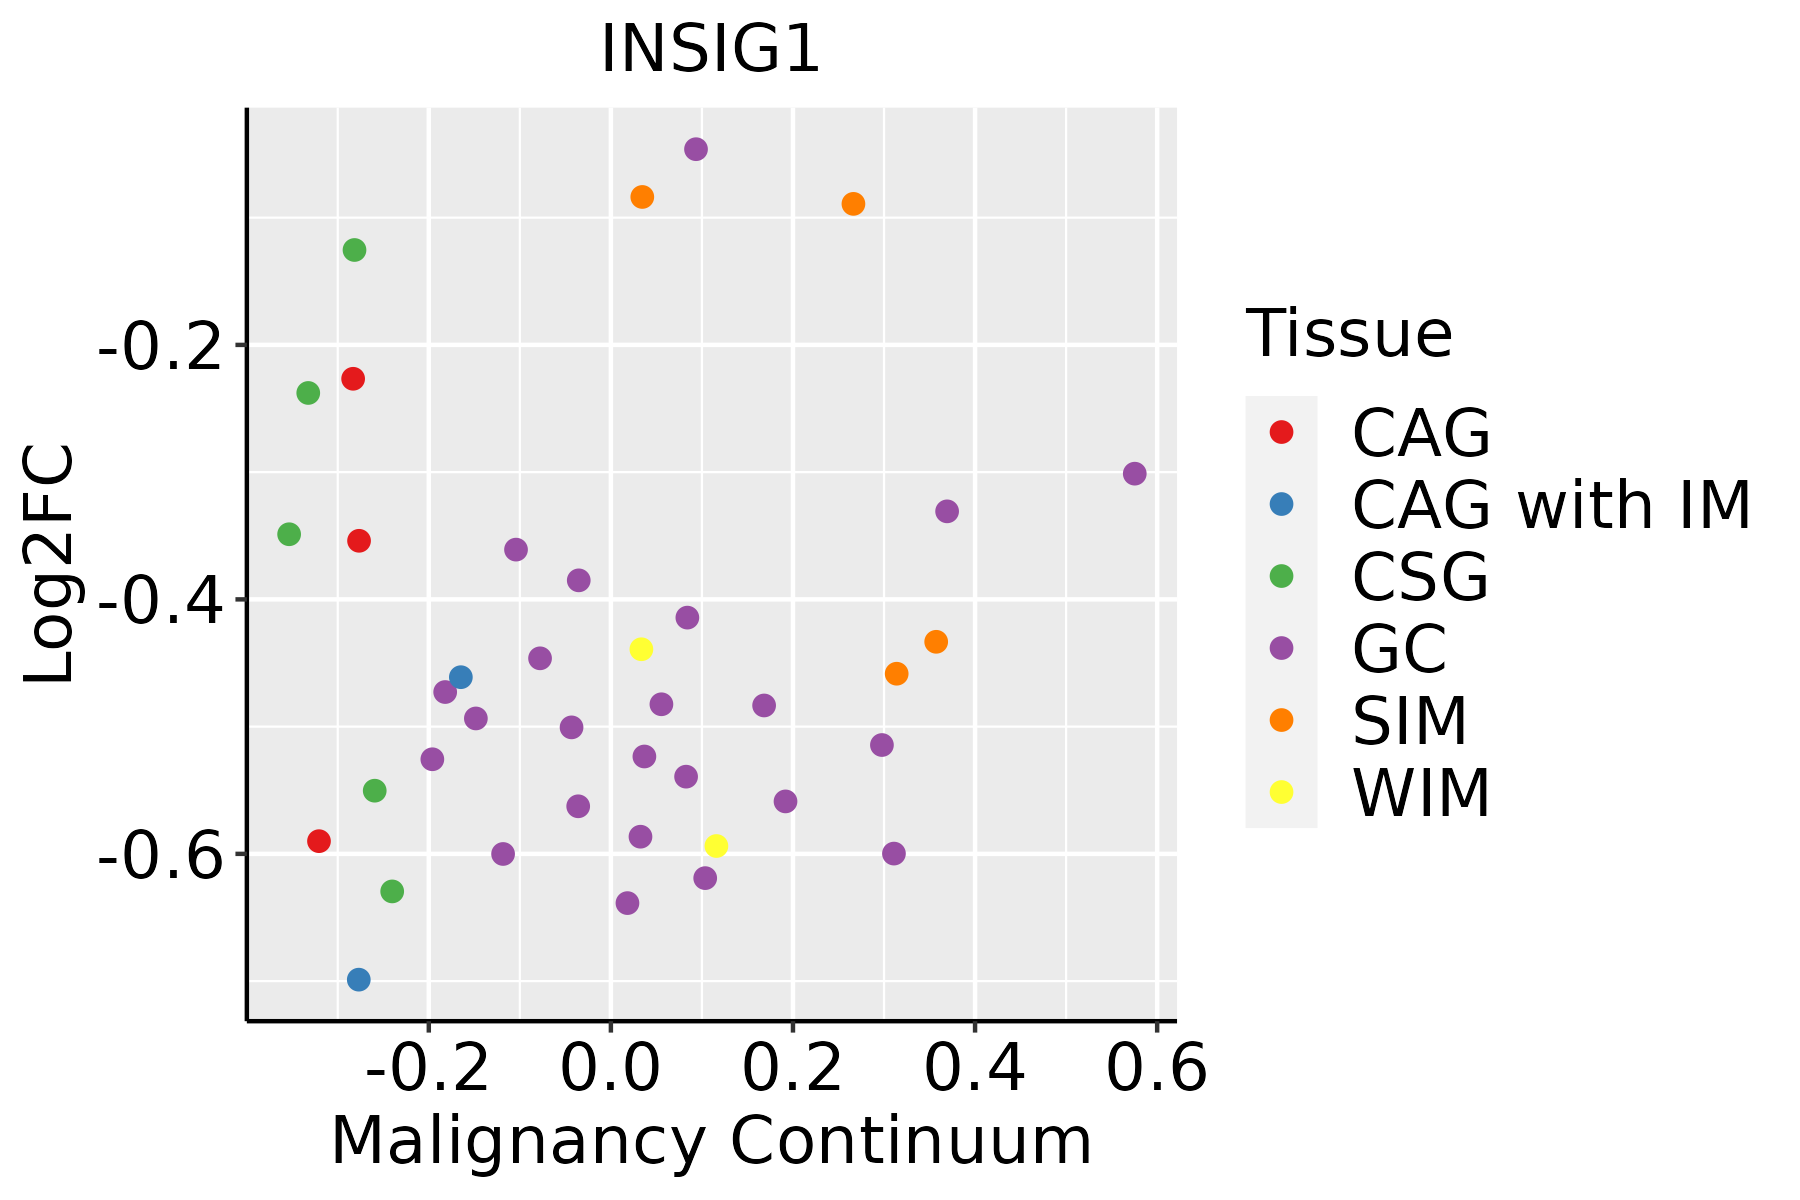
CAG: Chronic atrophic gastritis
CAG with IM: Chronic atrophic gastritis with intestinal metaplasia
CSG: Chronic superficial gastritis
GC: Gastric cancer
SIM: Severe intestinal metaplasia
WIM: Wild intestinal metaplasia
LiverThe image shows the transcriptomic changes along malignancy continuum.log2FC in expression of this searched gene in stem-like cells from each diseased tissue sample relative to stem-like cells in normal samples in each tissue plotted against the malignancy continuum. Samples are colored based on if they are from different disease stage.
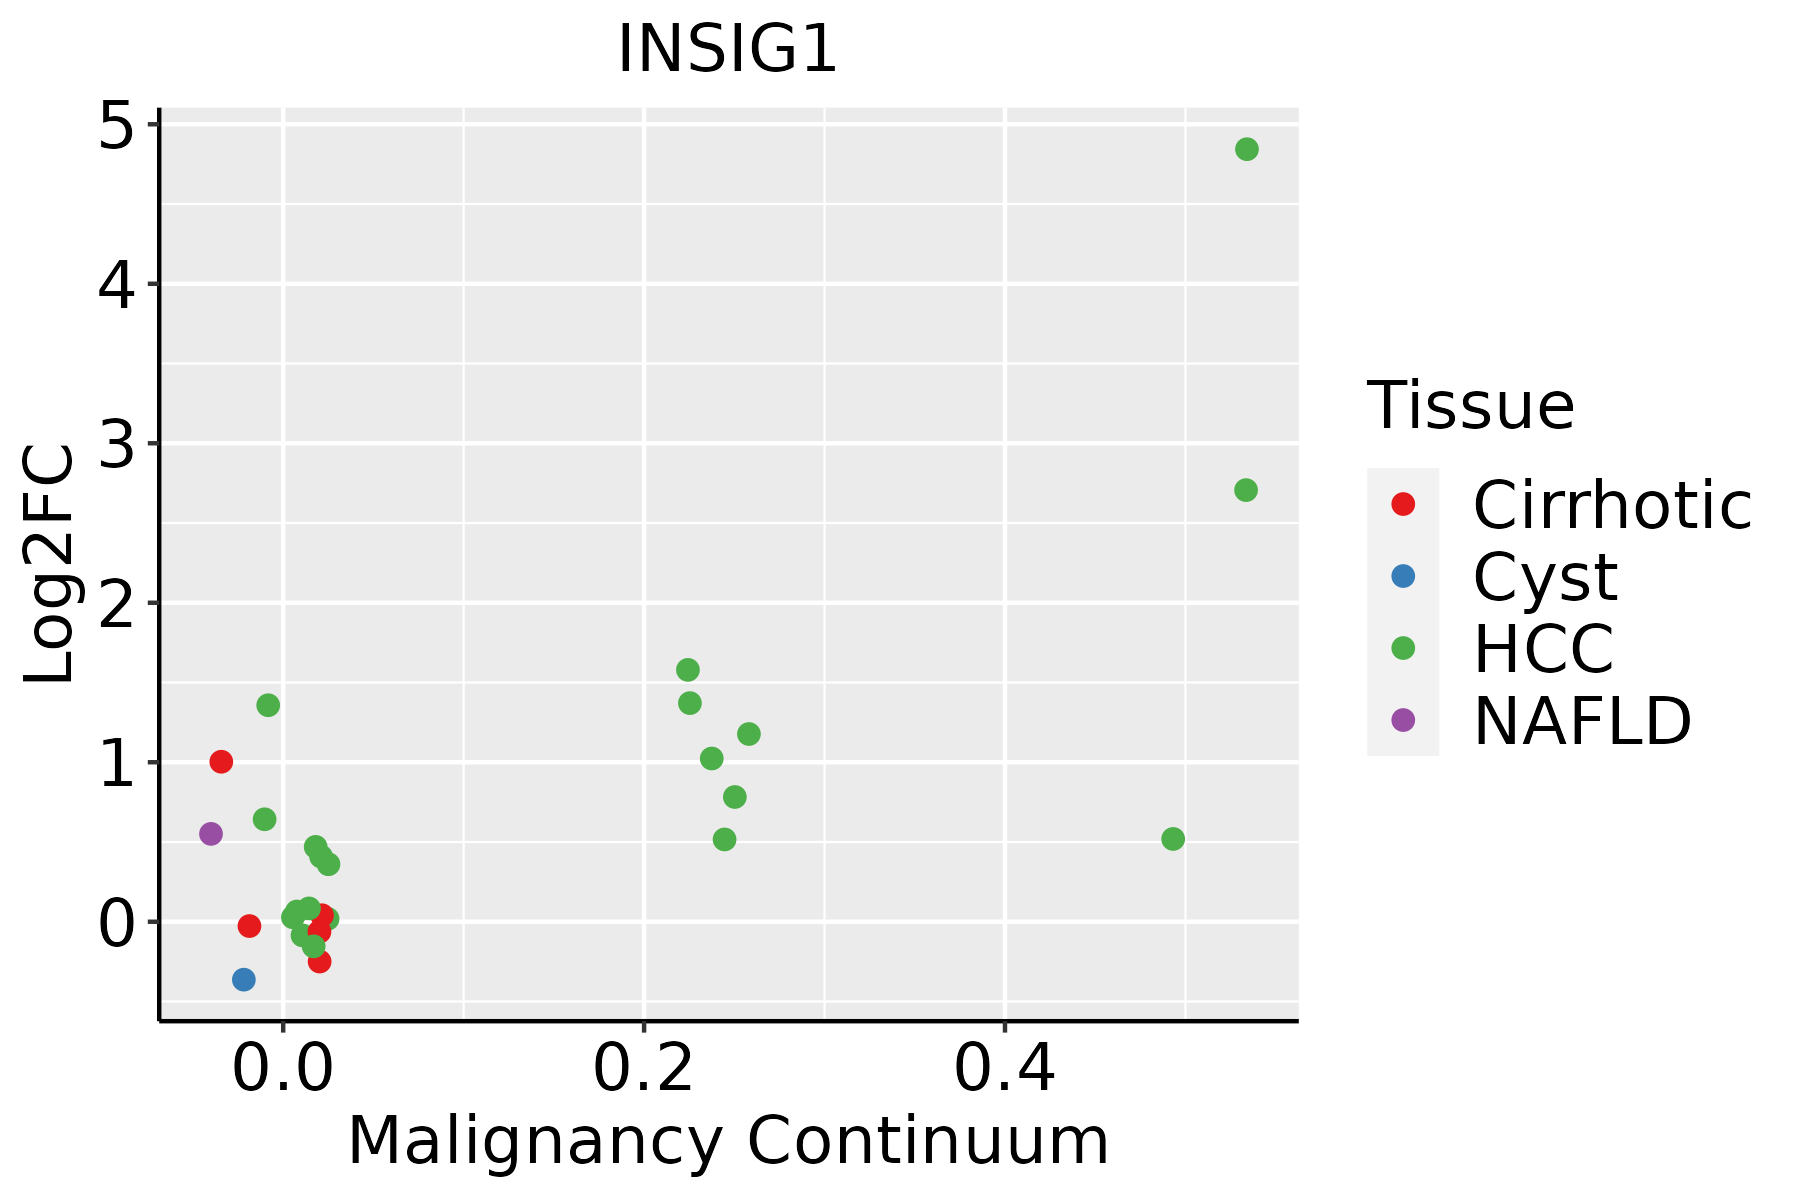
HCC: Hepatocellular carcinoma
NAFLD: Non-alcoholic fatty liver disease
Oral CavityThe image shows the transcriptomic changes along malignancy continuum.log2FC in expression of this searched gene in stem-like cells from each diseased tissue sample relative to stem-like cells in normal samples in each tissue plotted against the malignancy continuum. Samples are colored based on if they are from different disease stage.
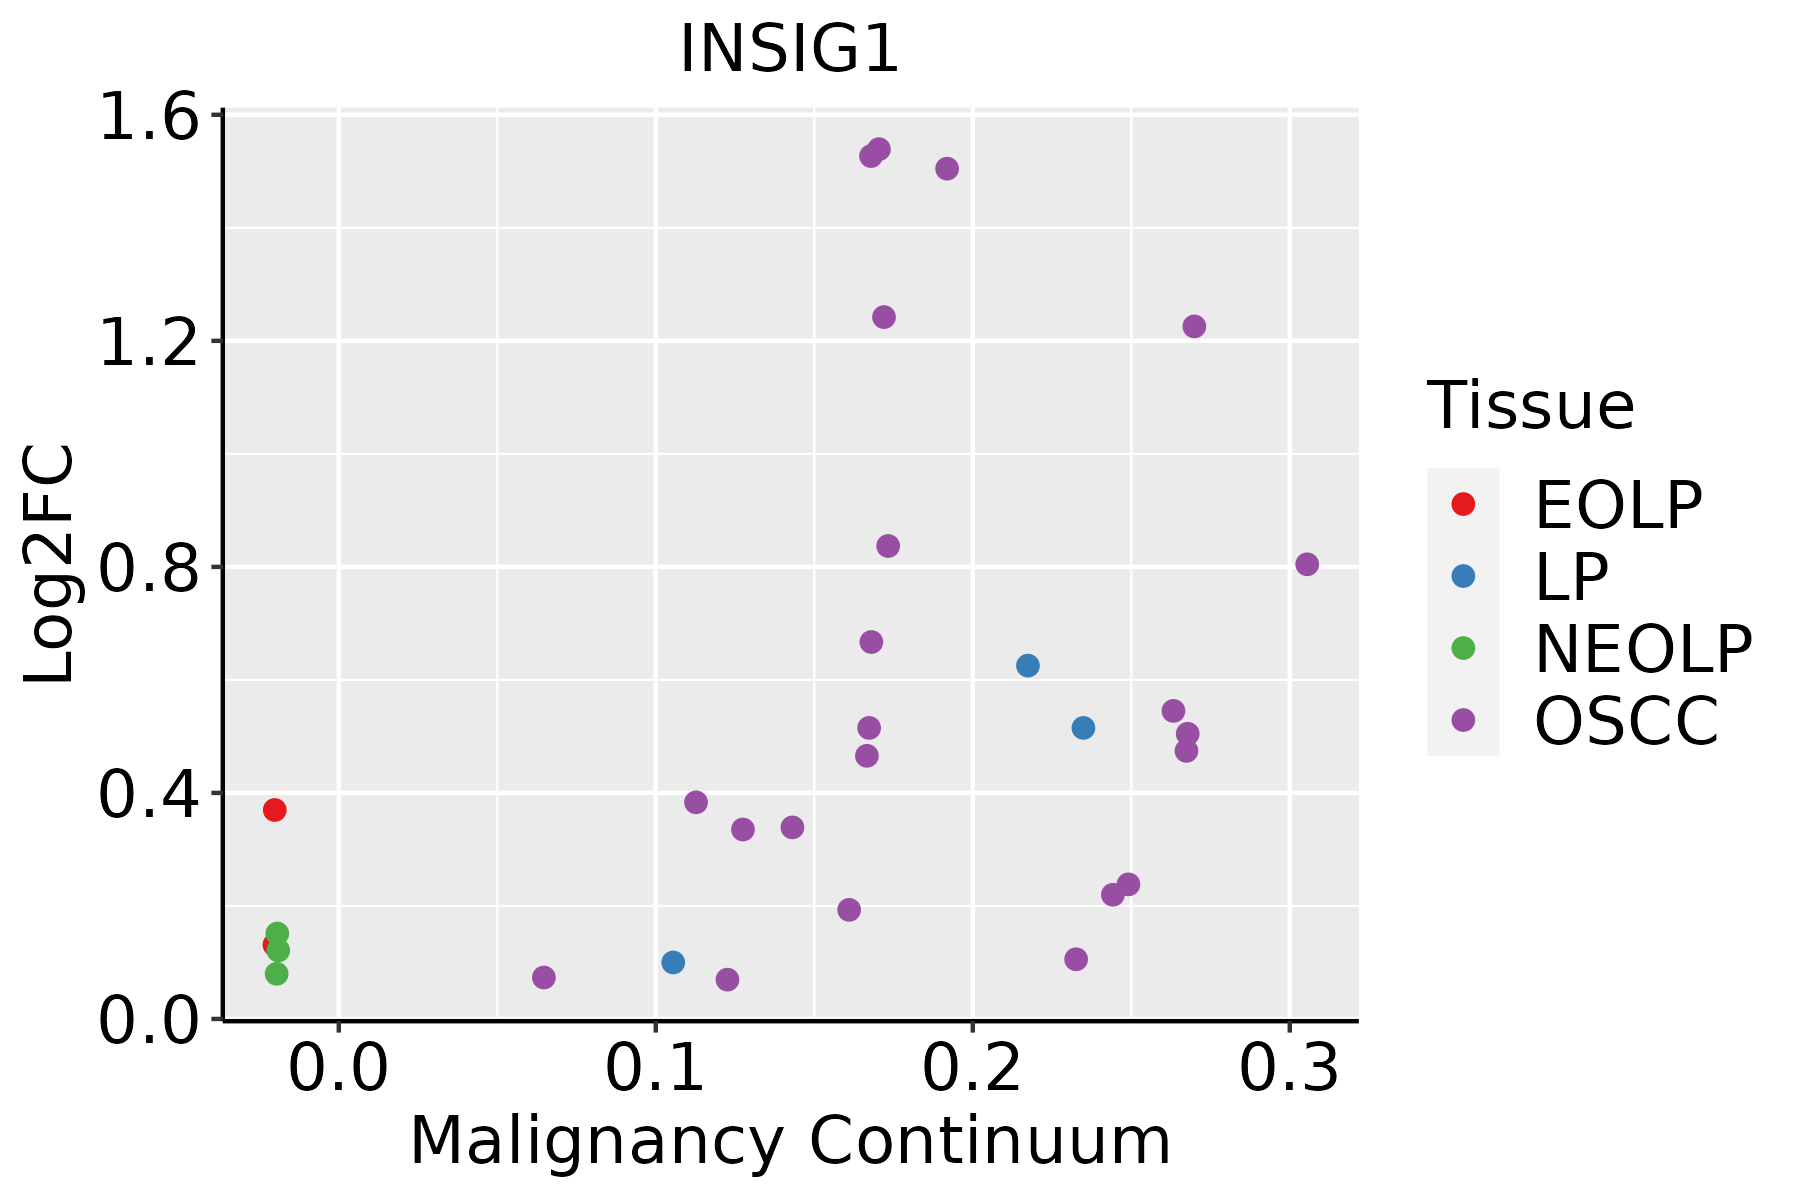
EOLP: Erosive Oral lichen planus
LP: leukoplakia
NEOLP: Non-erosive oral lichen planus
OSCC: Oral squamous cell carcinoma
SkinThe image shows the transcriptomic changes along malignancy continuum.log2FC in expression of this searched gene in stem-like cells from each diseased tissue sample relative to stem-like cells in normal samples in each tissue plotted against the malignancy continuum. Samples are colored based on if they are from different disease stage.
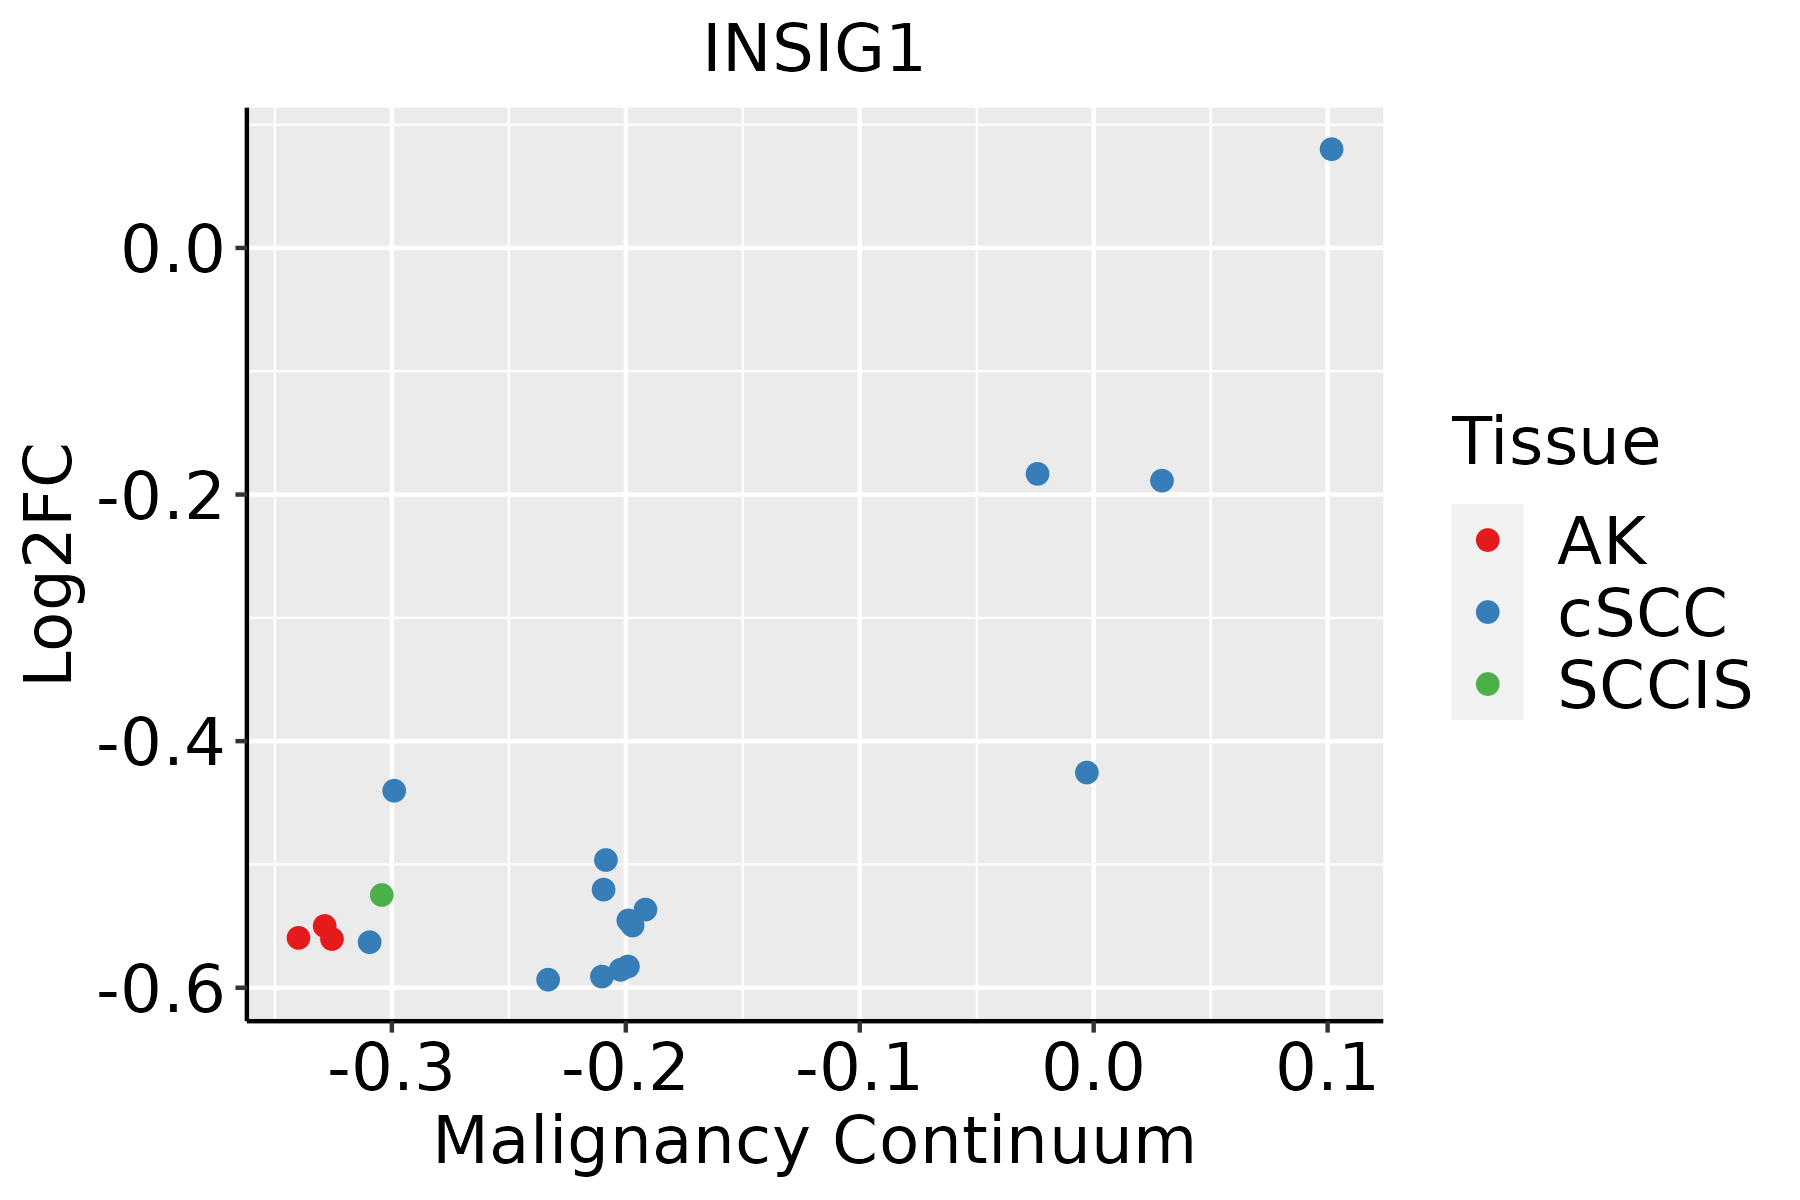
AK: Actinic keratosis
cSCC: Cutaneous squamous cell carcinoma
SCCIS:squamous cell carcinoma in situ
∗log2FC in expression of this searched gene in stem-like cells from each diseased tissue sample relative to stem-like cells in normal samples in each tissue plotted against the malignancy continuum. Samples are colored based on if they are from different disease stage.

Top

Malignant transformation related pathway analysis

check buttonFind out the enriched GO biological processes and KEGG pathways involved in transition from healthy to precancer to cancer
check button Figure of enriched GO biological processes.
TissueDisease StageEnriched GO biological Processes
ColorectumADGO analysis - Figure of enriched GO biological processes: Top 15 enriched GO BP terms are showed in the bar plot of each disease state in each tissue. Each row represents a significant GO biological process which is colored according to the -log10(p.adjust).
ColorectumSERGO analysis - Figure of enriched GO biological processes: Top 15 enriched GO BP terms are showed in the bar plot of each disease state in each tissue. Each row represents a significant GO biological process which is colored according to the -log10(p.adjust).
ColorectumMSSGO analysis - Figure of enriched GO biological processes: Top 15 enriched GO BP terms are showed in the bar plot of each disease state in each tissue. Each row represents a significant GO biological process which is colored according to the -log10(p.adjust).
ColorectumMSI-HGO analysis - Figure of enriched GO biological processes: Top 15 enriched GO BP terms are showed in the bar plot of each disease state in each tissue. Each row represents a significant GO biological process which is colored according to the -log10(p.adjust).
ColorectumFAPGO analysis - Figure of enriched GO biological processes: Top 15 enriched GO BP terms are showed in the bar plot of each disease state in each tissue. Each row represents a significant GO biological process which is colored according to the -log10(p.adjust).
∗Top 15 enriched GO BP terms are showed in the bar plot of each disease state in each tissue. Each row represents a significant GO biological process which is colored according to the -log10(p.adjust).
Page: 1 2 3 4 5 6 7 8 9 

check button Enriched GO biological processes.
GO IDTissueDisease StageDescriptionGene RatioBg Ratiopvaluep.adjustCount
GO:00512352StomachCSGmaintenance of location37/1034327/187232.84e-058.08e-0437
GO:005165121StomachCSGmaintenance of location in cell27/1034214/187235.28e-051.35e-0327
GO:00451852StomachCSGmaintenance of protein location14/103494/187236.28e-049.02e-0314
GO:00066332StomachCSGfatty acid biosynthetic process19/1034163/187231.68e-031.85e-0219
GO:00463942StomachCSGcarboxylic acid biosynthetic process30/1034314/187232.52e-032.46e-0230
GO:004343421StomachCSGresponse to peptide hormone37/1034414/187232.75e-032.62e-0237
GO:00160532StomachCSGorganic acid biosynthetic process30/1034316/187232.77e-032.63e-0230
GO:006201221StomachCSGregulation of small molecule metabolic process30/1034334/187236.13e-034.77e-0230
GO:005165131StomachCAGmaintenance of location in cell18/552214/187236.79e-051.89e-0318
GO:00512353StomachCAGmaintenance of location23/552327/187231.15e-042.85e-0323
GO:00451853StomachCAGmaintenance of protein location10/55294/187234.49e-047.68e-0310
GO:00325073StomachCAGmaintenance of protein location in cell8/55265/187236.25e-041.02e-028
GO:0072595StomachCAGmaintenance of protein localization in organelle6/55242/187231.36e-031.75e-026
GO:00709723StomachCAGprotein localization to endoplasmic reticulum8/55274/187231.48e-031.83e-028
GO:00069006StomachCAGvesicle budding from membrane7/55261/187232.05e-032.32e-027
GO:19038284StomachCAGnegative regulation of cellular protein localization10/552117/187232.43e-032.61e-0210
GO:1904950StomachCAGnegative regulation of establishment of protein localization10/552131/187235.46e-034.55e-0210
GO:00512354StomachWIMmaintenance of location20/426327/187236.52e-051.93e-0320
GO:00451854StomachWIMmaintenance of protein location9/42694/187232.90e-046.11e-039
GO:005165141StomachWIMmaintenance of location in cell14/426214/187234.08e-047.78e-0314
Page: 1 2 3 4 5 6 7 8 9 10 11 12 13 14 15 16 17 18 19 20 21 22 23 24 

check button Enriched KEGG pathways.
Pathway IDTissueDisease StageDescriptionGene RatioBg Ratiopvaluep.adjustqvalueCount
Page: 1 

Top

Cell-cell communication analysis

check buttonIdentification of potential cell-cell interactions between two cell types and their ligand-receptor pairs for different disease states
LigandReceptorLRpairPathwayTissueDisease Stage
Page: 1 

Top

Single-cell gene regulatory network inference analysis

check buttonFind out the significant the regulons (TFs) and the target genes of each regulon across cell types for different disease states
TFCell TypeTissueDisease StageTarget GeneRSSRegulon Activity
∗The dot plots of a searched regulon are shown for all cell subpopulations in each disease state of each tissue based on the regulon specific score inferred using pySCENIC and by calculating the average expression.
Page: 1 

Top

Somatic mutation of malignant transformation related genes

check buttonAnnotation of somatic variants for genes involved in malignant transformation
Hugo SymbolVariant ClassVariant ClassificationdbSNP RSHGVScHGVSpHGVSp ShortSWISSPROTBIOTYPESIFTPolyPhenTumor Sample BarcodeTissueHistologySexAgeStageTherapy TypesDrugsOutcome
INSIG1SNVMissense_Mutationnovelc.698N>Ap.Val233Aspp.V233DO15503protein_codingdeleterious(0)probably_damaging(0.969)TCGA-BH-A18G-01Breastbreast invasive carcinomaFemale>=65I/IIUnknownUnknownSD
INSIG1deletionIn_Frame_Delc.776_778delTGGp.Val259delp.V259delO15503protein_codingTCGA-A8-A07W-01Breastbreast invasive carcinomaFemale>=65III/IVHormone TherapyexemestaneSD
INSIG1SNVMissense_Mutationc.108G>Cp.Glu36Aspp.E36DO15503protein_codingtolerated_low_confidence(0.18)benign(0)TCGA-Q1-A73O-01Cervixcervical & endocervical cancerFemale<65I/IIChemotherapycisplatinCR
INSIG1SNVMissense_Mutationnovelc.349N>Ap.Glu117Lysp.E117KO15503protein_codingtolerated(0.1)probably_damaging(0.996)TCGA-VS-A9V0-01Cervixcervical & endocervical cancerFemale<65I/IIChemotherapycisplatinPD
INSIG1SNVMissense_Mutationrs780785188c.769N>Ap.Val257Ilep.V257IO15503protein_codingtolerated(0.38)probably_damaging(0.995)TCGA-AZ-4313-01Colorectumcolon adenocarcinomaFemale<65I/IIUnknownUnknownSD
INSIG1deletionIn_Frame_Delnovelc.276_278delNNNp.Phe92_Ser93delinsLeup.F92_S93delinsLO15503protein_codingTCGA-AA-3845-01Colorectumcolon adenocarcinomaFemale>=65I/IIUnknownUnknownPD
INSIG1SNVMissense_Mutationnovelc.737N>Ap.Ser246Tyrp.S246YO15503protein_codingdeleterious(0)probably_damaging(0.999)TCGA-AJ-A5DW-01Endometriumuterine corpus endometrioid carcinomaFemale<65I/IIUnknownUnknownSD
INSIG1SNVMissense_Mutationnovelc.757T>Gp.Phe253Valp.F253VO15503protein_codingdeleterious(0)probably_damaging(0.998)TCGA-AX-A2HC-01Endometriumuterine corpus endometrioid carcinomaFemale<65III/IVChemotherapypaclitaxelPD
INSIG1SNVMissense_Mutationnovelc.409N>Ap.Ala137Thrp.A137TO15503protein_codingdeleterious(0.01)probably_damaging(0.999)TCGA-EO-A22R-01Endometriumuterine corpus endometrioid carcinomaFemale<65I/IIUnknownUnknownSD
INSIG1SNVMissense_Mutationnovelc.293N>Gp.Leu98Argp.L98RO15503protein_codingdeleterious(0)probably_damaging(0.955)TCGA-EY-A1GI-01Endometriumuterine corpus endometrioid carcinomaFemale<65I/IIUnknownUnknownSD
Page: 1 2 3 

Top

Related drugs of malignant transformation related genes

check buttonIdentification of chemicals and drugs interact with genes involved in malignant transfromation
(DGIdb 4.0)
Entrez IDSymbolCategoryInteraction TypesDrug Claim NameDrug NamePMIDs
Page: 1