
|
|||||
|
 | |
| |
| |
| |
| |
| |
|
Gene: FOSB |
Gene summary for FOSB |
| Gene information | Species | Human | Gene symbol | FOSB | Gene ID | 2354 |
| Gene name | FosB proto-oncogene, AP-1 transcription factor subunit | |
| Gene Alias | AP-1 | |
| Cytomap | 19q13.32 | |
| Gene Type | protein-coding | GO ID | GO:0000003 | UniProtAcc | P53539 |
Top |
Malignant transformation analysis |
| Identification of the aberrant gene expression in precancerous and cancerous lesions by comparing the gene expression of stem-like cells in diseased tissues with normal stem cells |
| Entrez ID | Symbol | Replicates | Species | Organ | Tissue | Adj P-value | Log2FC | Malignancy |
| 2354 | FOSB | GSM4909281 | Human | Breast | IDC | 4.23e-12 | -5.71e-01 | 0.21 |
| 2354 | FOSB | GSM4909282 | Human | Breast | IDC | 3.81e-13 | -6.16e-01 | -0.0288 |
| 2354 | FOSB | GSM4909285 | Human | Breast | IDC | 3.07e-16 | -4.26e-01 | 0.21 |
| 2354 | FOSB | GSM4909286 | Human | Breast | IDC | 7.32e-13 | -3.97e-01 | 0.1081 |
| 2354 | FOSB | GSM4909290 | Human | Breast | IDC | 3.28e-25 | -9.11e-01 | 0.2096 |
| 2354 | FOSB | GSM4909291 | Human | Breast | IDC | 9.77e-03 | 3.41e-01 | 0.1753 |
| 2354 | FOSB | GSM4909293 | Human | Breast | IDC | 1.16e-02 | 1.25e-01 | 0.1581 |
| 2354 | FOSB | GSM4909294 | Human | Breast | IDC | 1.02e-14 | -6.78e-01 | 0.2022 |
| 2354 | FOSB | GSM4909298 | Human | Breast | IDC | 4.77e-03 | -8.48e-03 | 0.1551 |
| 2354 | FOSB | GSM4909299 | Human | Breast | IDC | 1.01e-19 | 5.55e-01 | 0.035 |
| 2354 | FOSB | GSM4909300 | Human | Breast | IDC | 1.10e-13 | 6.88e-01 | 0.0334 |
| 2354 | FOSB | GSM4909301 | Human | Breast | IDC | 3.70e-04 | 3.34e-01 | 0.1577 |
| 2354 | FOSB | GSM4909305 | Human | Breast | IDC | 2.39e-03 | 1.96e-01 | 0.0436 |
| 2354 | FOSB | GSM4909306 | Human | Breast | IDC | 2.07e-04 | -5.18e-02 | 0.1564 |
| 2354 | FOSB | GSM4909308 | Human | Breast | IDC | 2.59e-06 | 3.41e-01 | 0.158 |
| 2354 | FOSB | GSM4909311 | Human | Breast | IDC | 1.33e-11 | 3.01e-02 | 0.1534 |
| 2354 | FOSB | GSM4909313 | Human | Breast | IDC | 3.58e-20 | 6.23e-01 | 0.0391 |
| 2354 | FOSB | GSM4909315 | Human | Breast | IDC | 5.51e-05 | -5.24e-01 | 0.21 |
| 2354 | FOSB | GSM4909316 | Human | Breast | IDC | 1.42e-09 | -8.65e-01 | 0.21 |
| 2354 | FOSB | GSM4909317 | Human | Breast | IDC | 1.65e-19 | 6.16e-01 | 0.1355 |
| Page: 1 2 3 4 5 6 7 8 9 10 11 12 13 14 15 16 |
| Tissue | Expression Dynamics | Abbreviation |
| Breast | 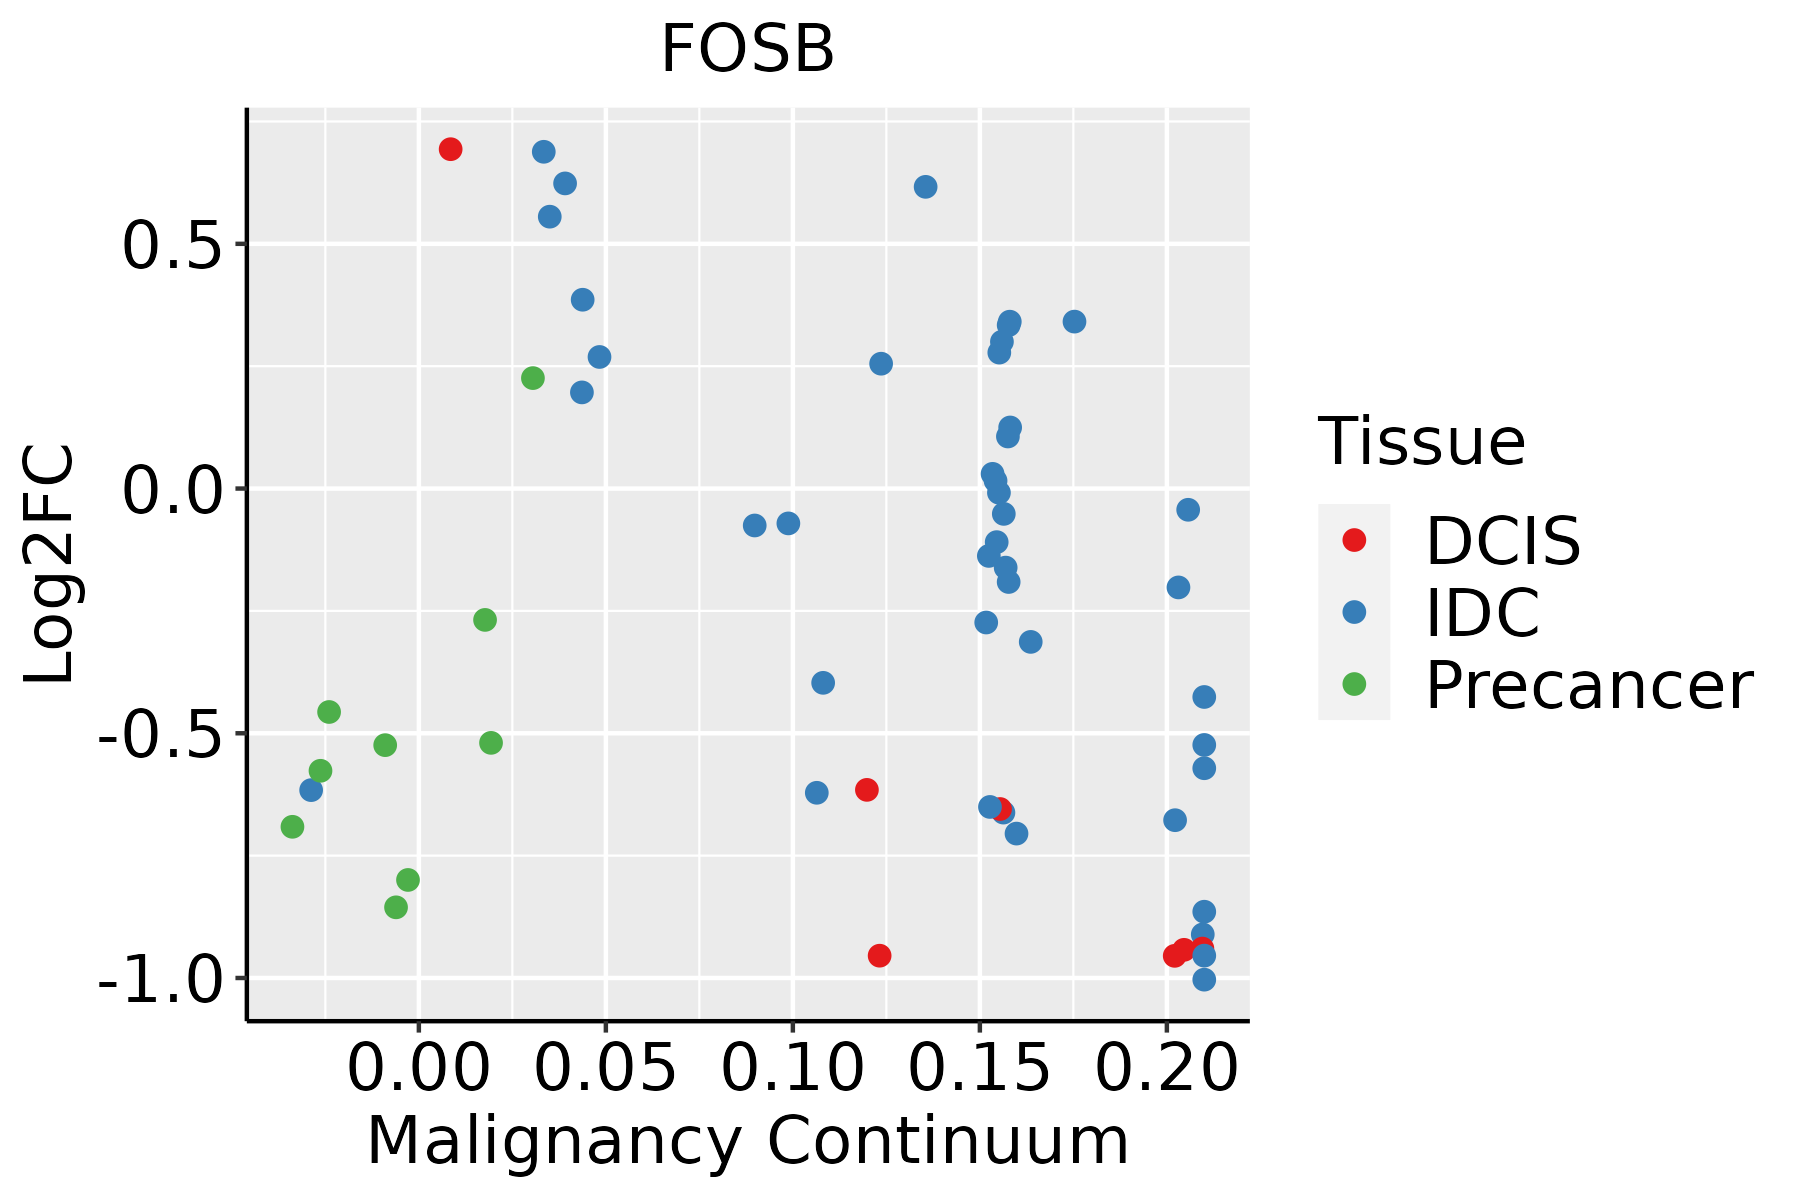 | IDC: Invasive ductal carcinoma |
| DCIS: Ductal carcinoma in situ | ||
| Precancer(BRCA1-mut): Precancerous lesion from BRCA1 mutation carriers | ||
| Cervix |  | CC: Cervix cancer |
| HSIL_HPV: HPV-infected high-grade squamous intraepithelial lesions | ||
| N_HPV: HPV-infected normal cervix | ||
| Endometrium |  | AEH: Atypical endometrial hyperplasia |
| EEC: Endometrioid Cancer | ||
| Esophagus | 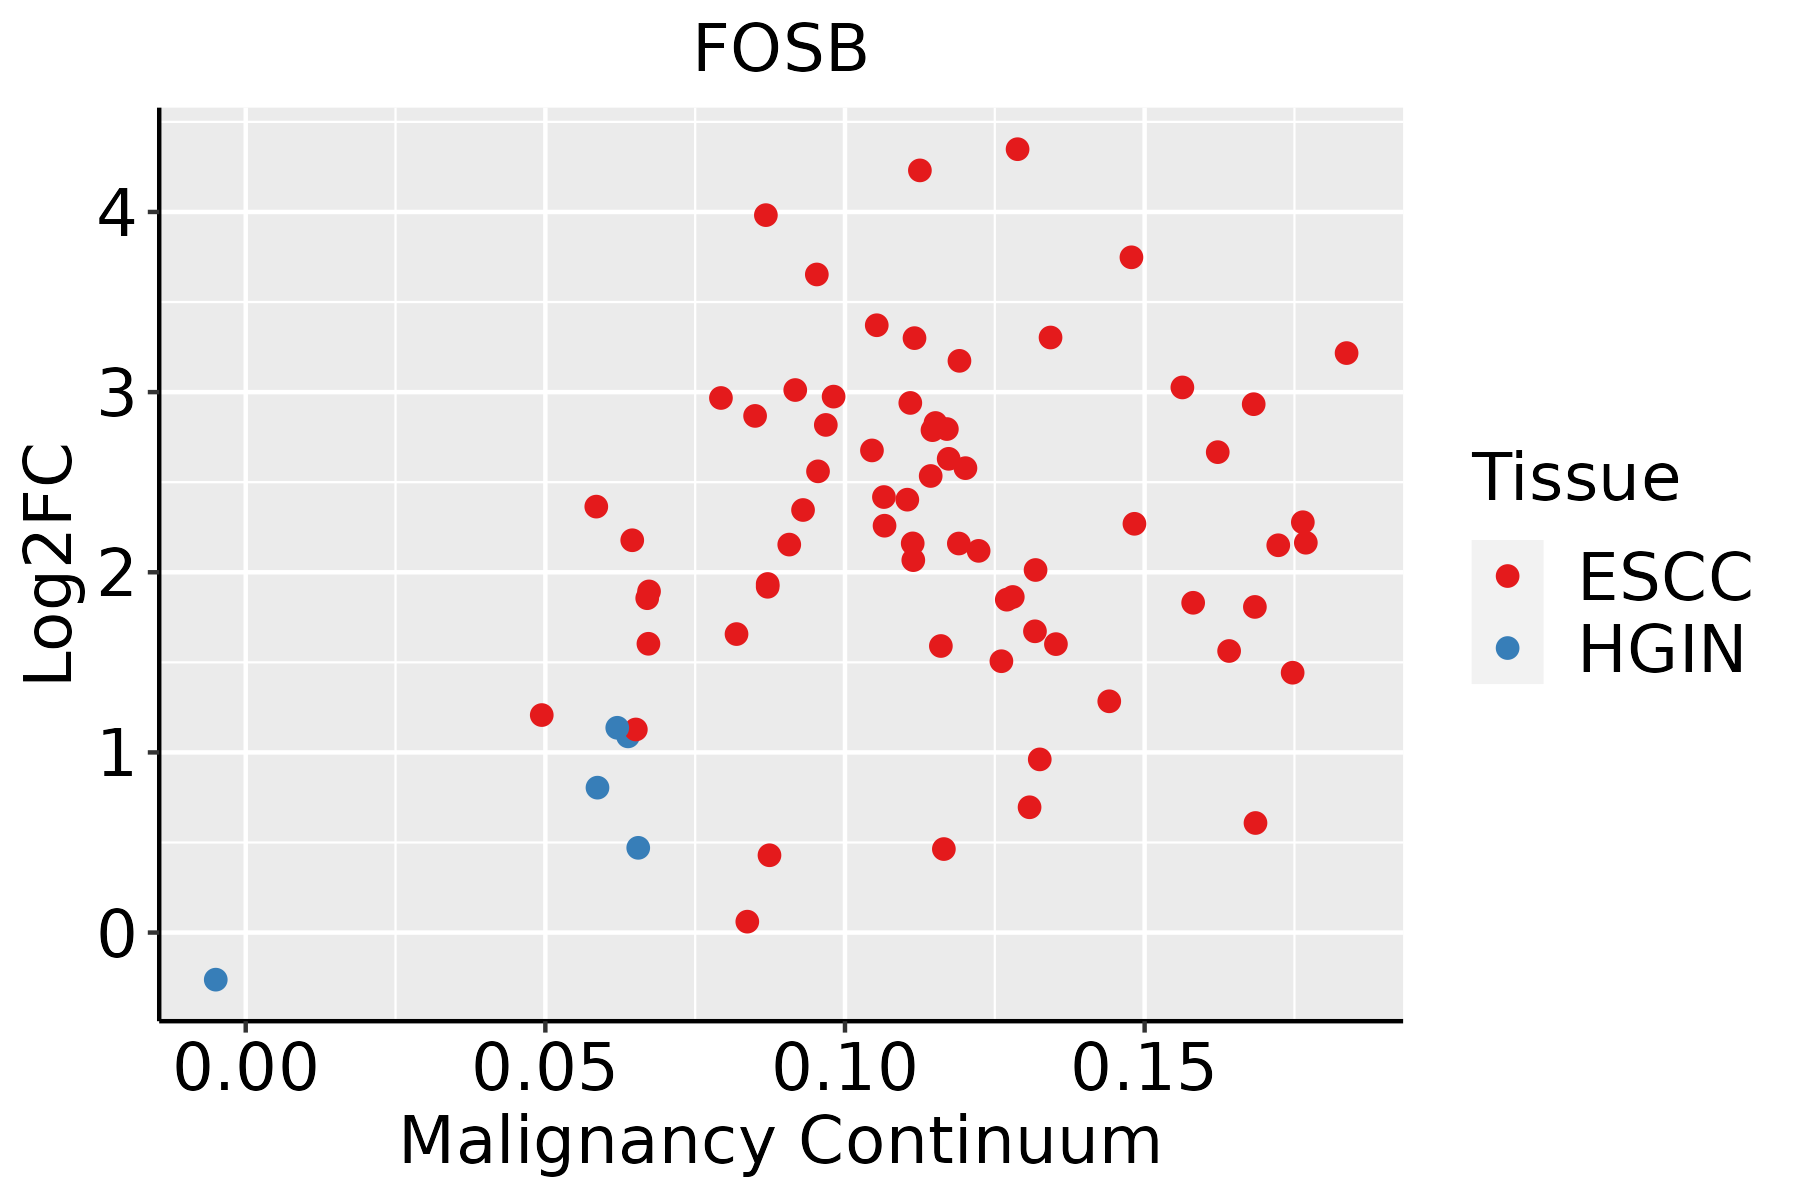 | ESCC: Esophageal squamous cell carcinoma |
| HGIN: High-grade intraepithelial neoplasias | ||
| LGIN: Low-grade intraepithelial neoplasias | ||
| GC |  | CAG: Chronic atrophic gastritis |
| CAG with IM: Chronic atrophic gastritis with intestinal metaplasia | ||
| CSG: Chronic superficial gastritis | ||
| GC: Gastric cancer | ||
| SIM: Severe intestinal metaplasia | ||
| WIM: Wild intestinal metaplasia | ||
| Liver | 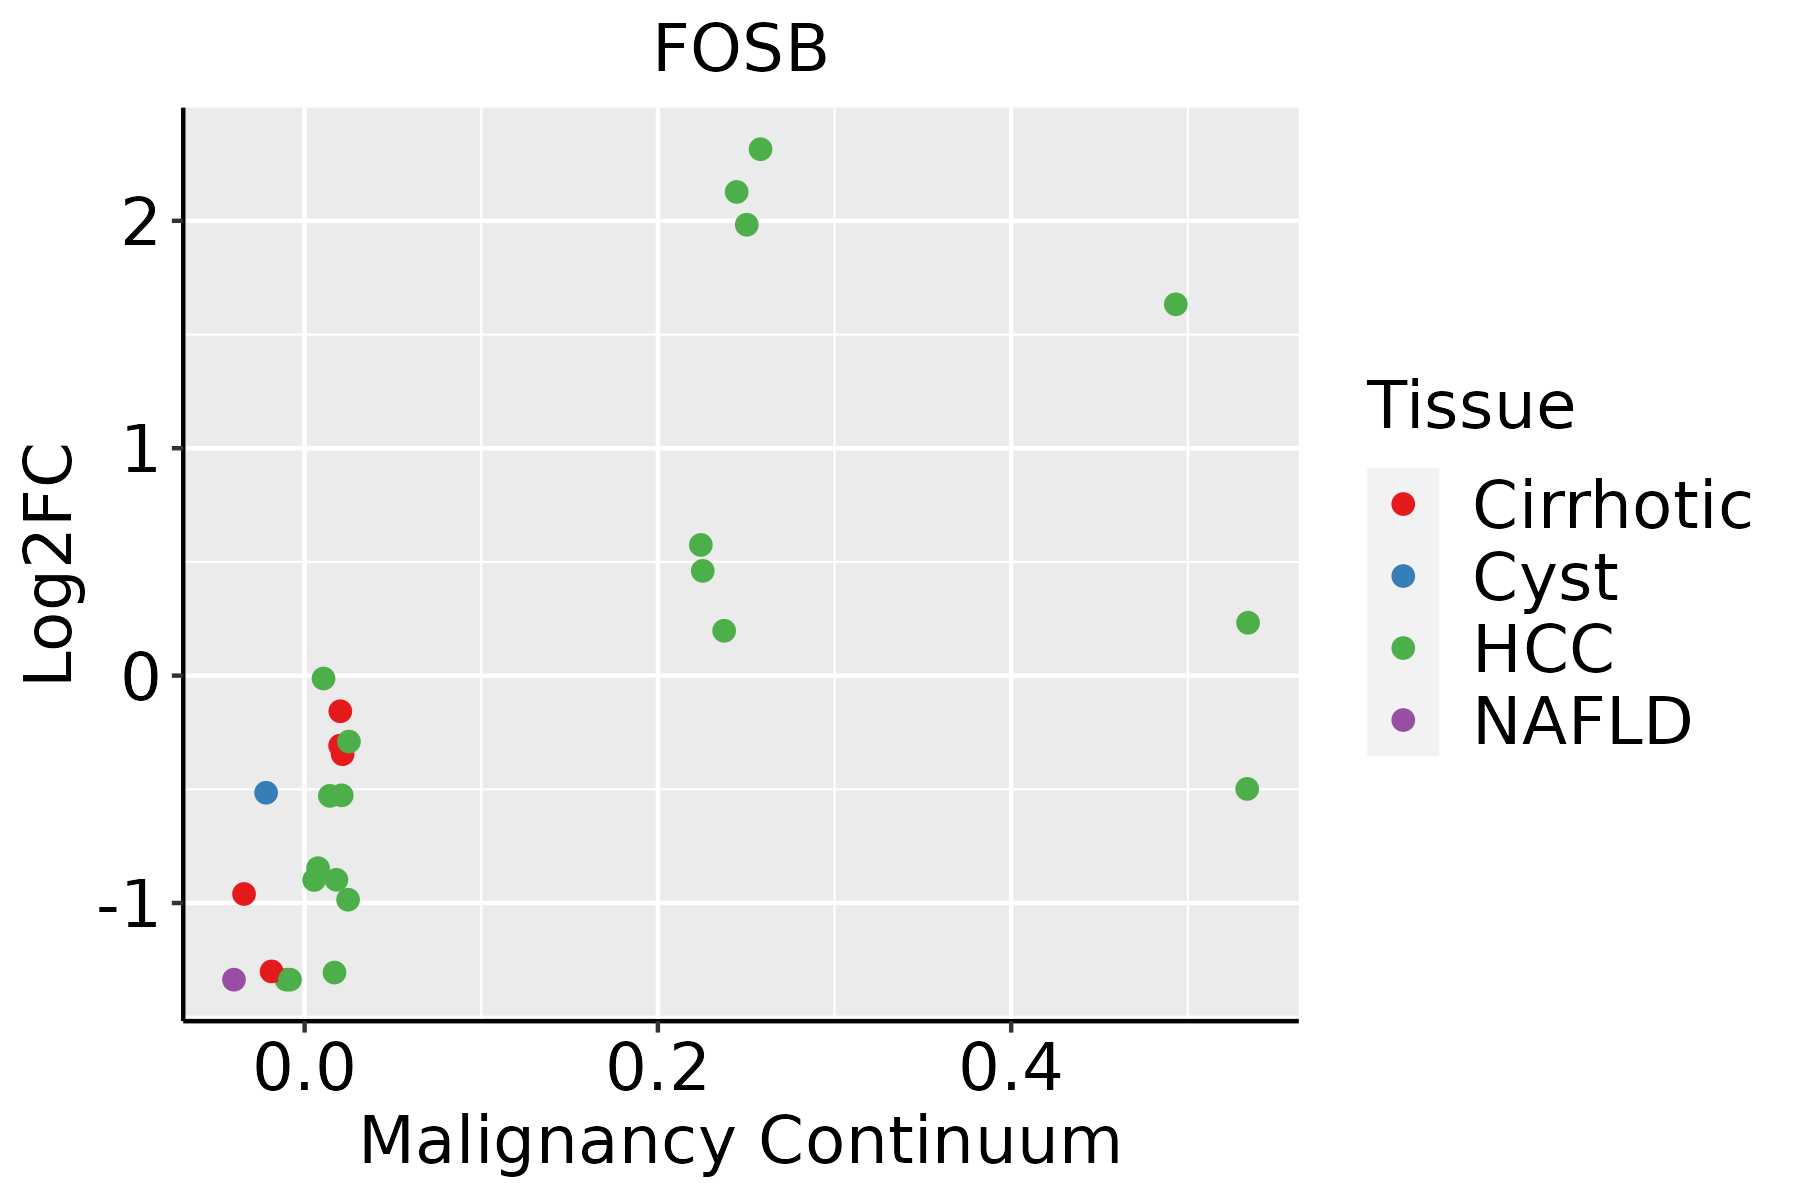 | HCC: Hepatocellular carcinoma |
| NAFLD: Non-alcoholic fatty liver disease | ||
| Lung | 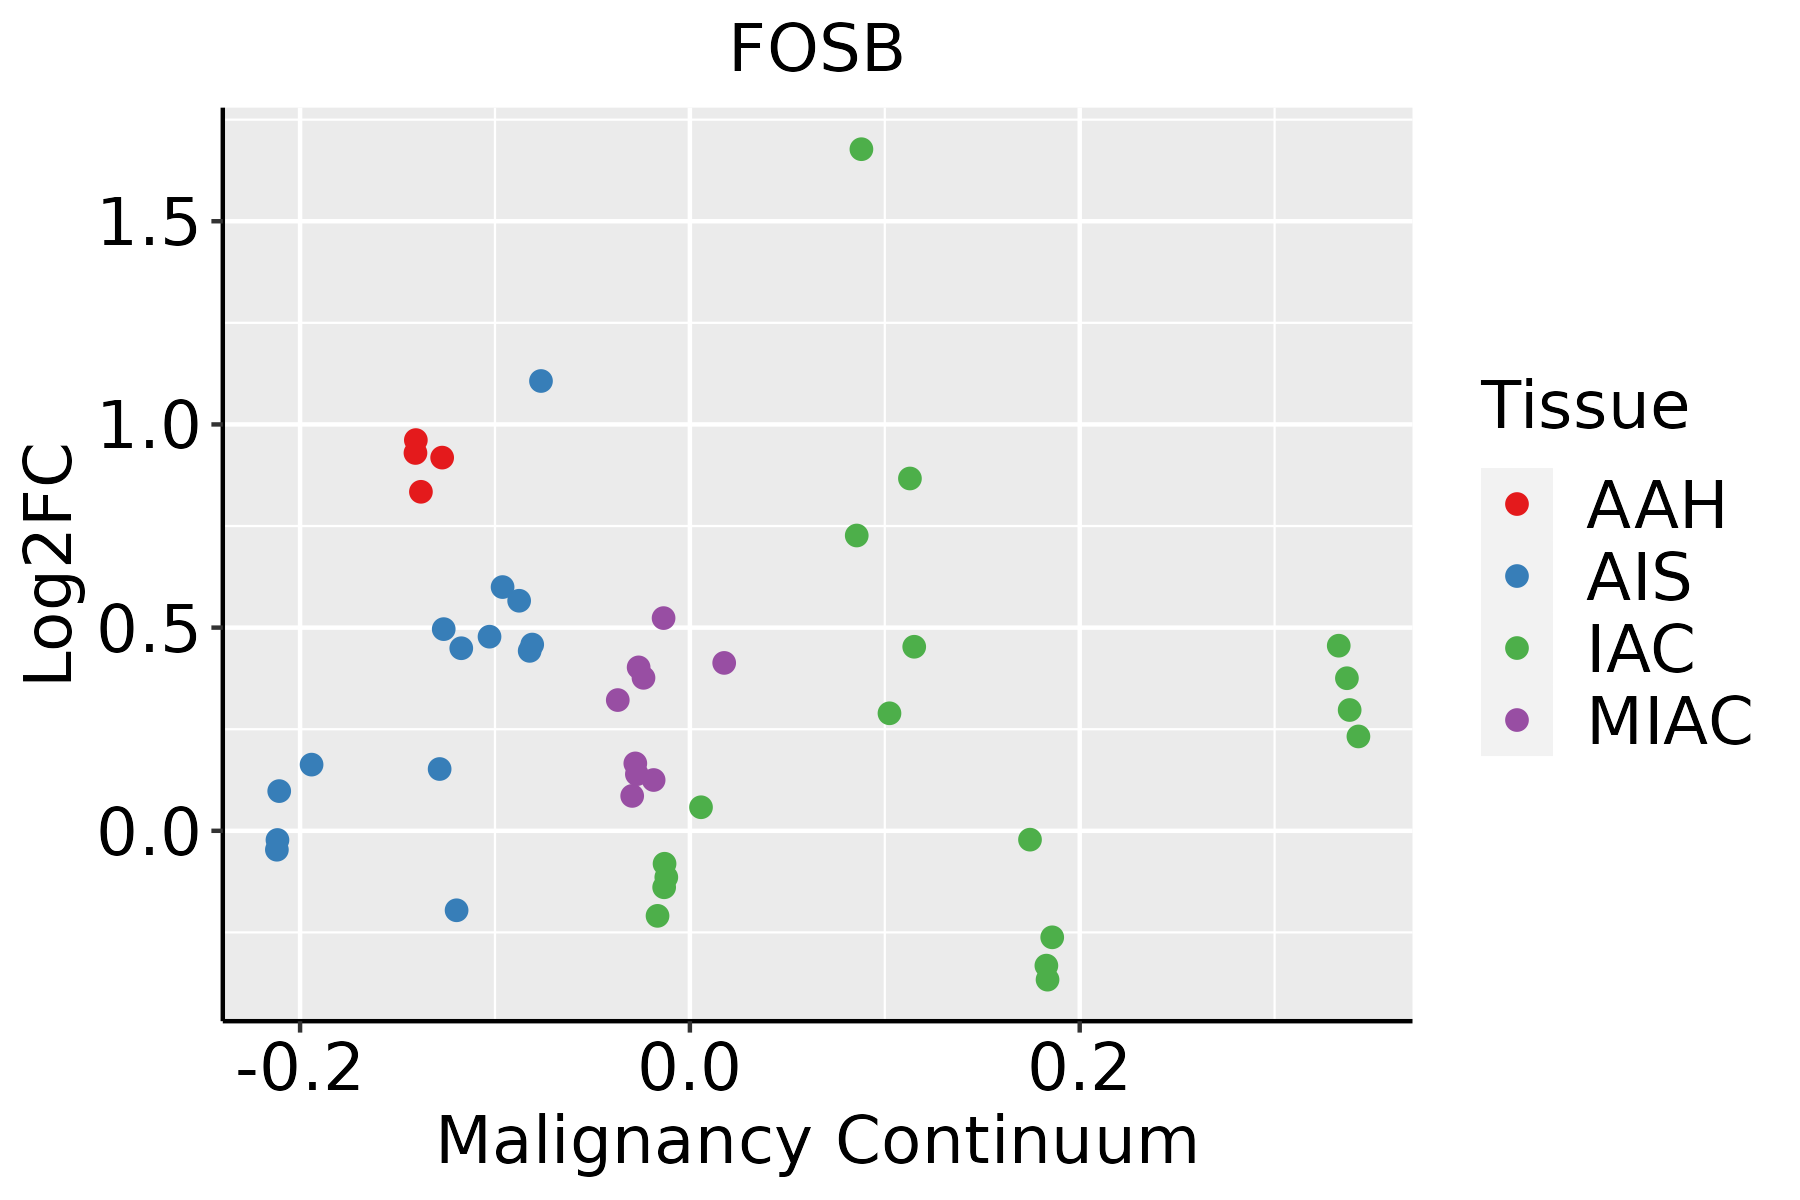 | AAH: Atypical adenomatous hyperplasia |
| AIS: Adenocarcinoma in situ | ||
| IAC: Invasive lung adenocarcinoma | ||
| MIA: Minimally invasive adenocarcinoma | ||
| Oral Cavity | 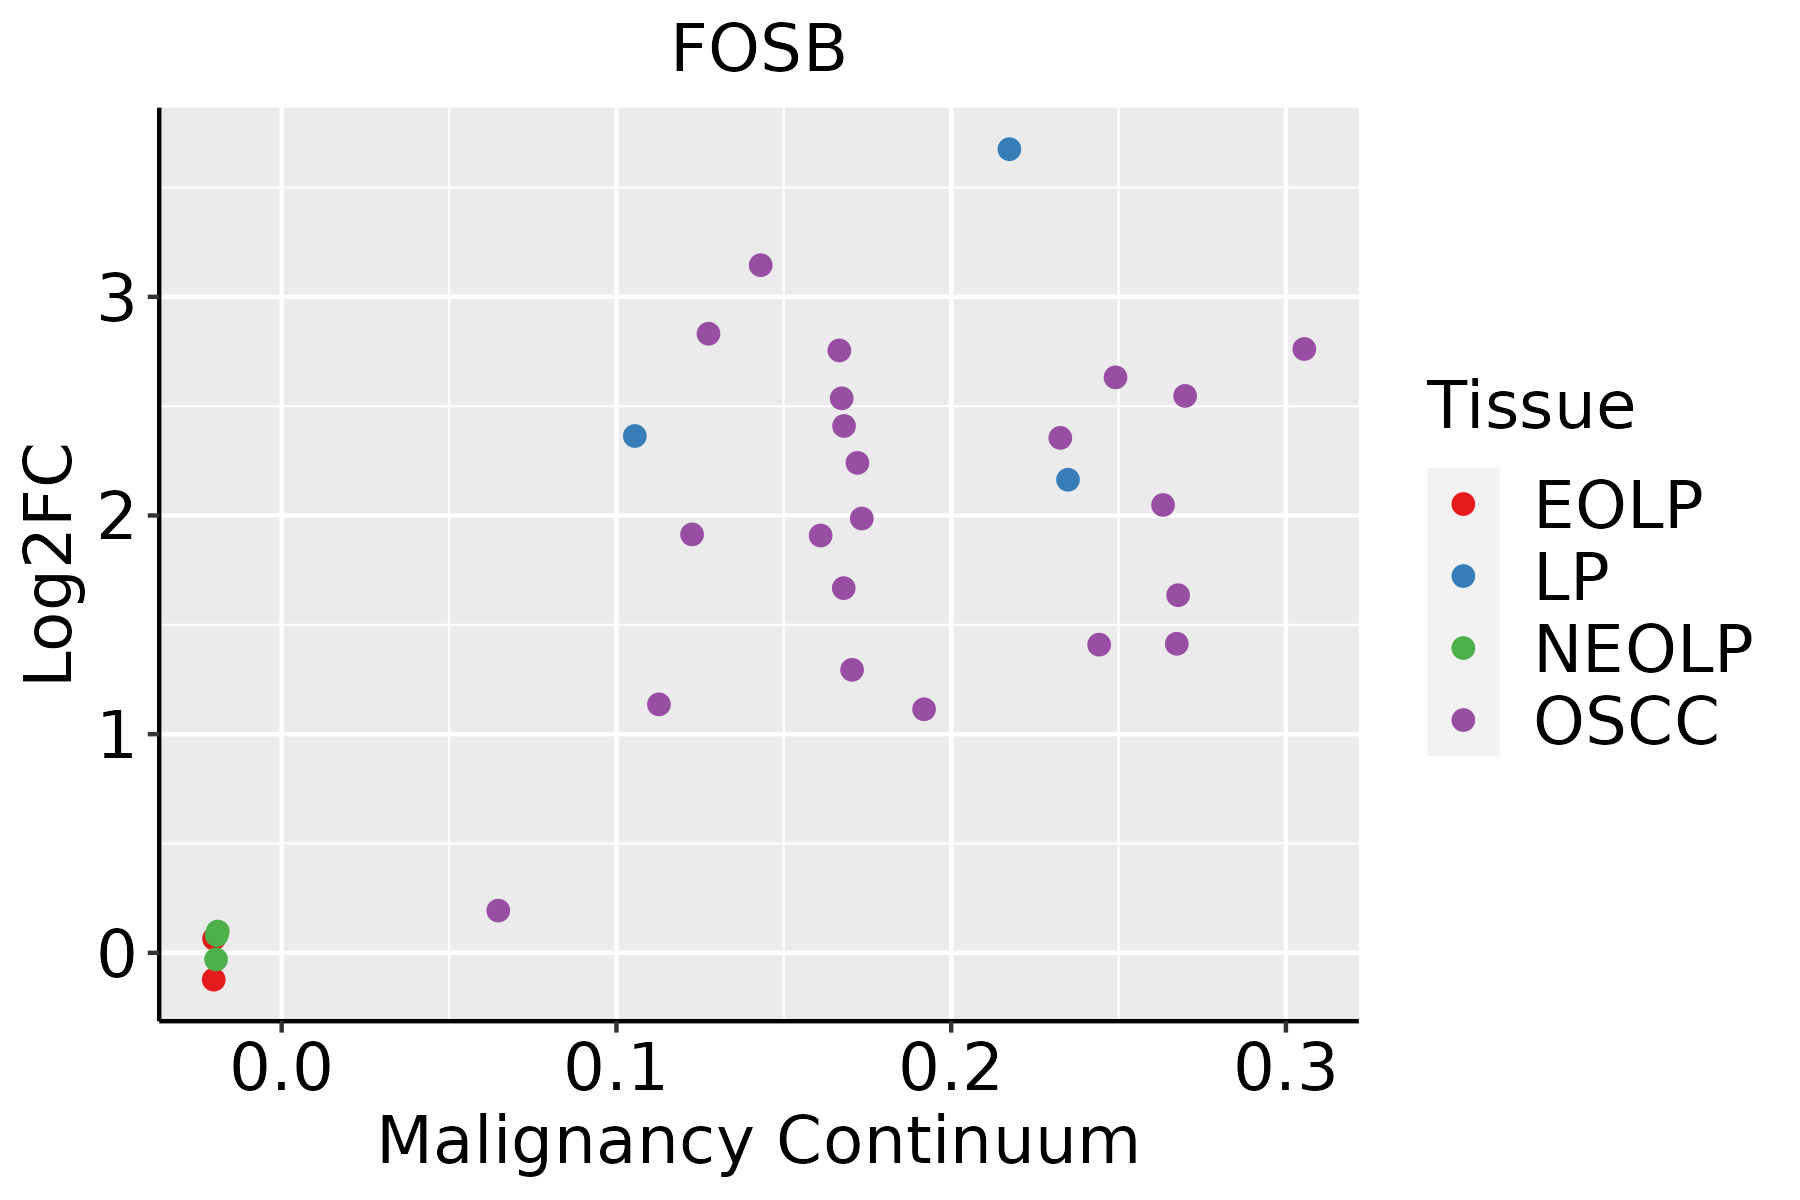 | EOLP: Erosive Oral lichen planus |
| LP: leukoplakia | ||
| NEOLP: Non-erosive oral lichen planus | ||
| OSCC: Oral squamous cell carcinoma | ||
| Prostate |  | BPH: Benign Prostatic Hyperplasia |
| Skin |  | AK: Actinic keratosis |
| cSCC: Cutaneous squamous cell carcinoma | ||
| SCCIS:squamous cell carcinoma in situ | ||
| Thyroid |  | ATC: Anaplastic thyroid cancer |
| HT: Hashimoto's thyroiditis | ||
| PTC: Papillary thyroid cancer |
| ∗log2FC in expression of this searched gene in stem-like cells from each diseased tissue sample relative to stem-like cells in normal samples in each tissue plotted against the malignancy continuum. Samples are colored based on if they are from different disease stage. |
Top |
Malignant transformation related pathway analysis |
| Find out the enriched GO biological processes and KEGG pathways involved in transition from healthy to precancer to cancer |
| Tissue | Disease Stage | Enriched GO biological Processes |
| Colorectum | AD |  |
| Colorectum | SER |  |
| Colorectum | MSS |  |
| Colorectum | MSI-H |  |
| Colorectum | FAP |  |
| ∗Top 15 enriched GO BP terms are showed in the bar plot of each disease state in each tissue. Each row represents a significant GO biological process which is colored according to the -log10(p.adjust). |
| Page: 1 2 3 4 5 6 7 8 9 |
| GO ID | Tissue | Disease Stage | Description | Gene Ratio | Bg Ratio | pvalue | p.adjust | Count |
| GO:0071241110 | Thyroid | PTC | cellular response to inorganic substance | 92/5968 | 226/18723 | 3.01e-03 | 1.49e-02 | 92 |
| GO:0031960111 | Thyroid | PTC | response to corticosteroid | 69/5968 | 167/18723 | 6.18e-03 | 2.74e-02 | 69 |
| GO:0051384111 | Thyroid | PTC | response to glucocorticoid | 62/5968 | 148/18723 | 6.39e-03 | 2.81e-02 | 62 |
| GO:0009410111 | Thyroid | PTC | response to xenobiotic stimulus | 171/5968 | 462/18723 | 1.00e-02 | 4.07e-02 | 171 |
| GO:003257010 | Thyroid | PTC | response to progesterone | 19/5968 | 37/18723 | 1.07e-02 | 4.29e-02 | 19 |
| GO:0071248110 | Thyroid | PTC | cellular response to metal ion | 78/5968 | 197/18723 | 1.29e-02 | 4.98e-02 | 78 |
| GO:0048545210 | Thyroid | ATC | response to steroid hormone | 168/6293 | 339/18723 | 7.21e-10 | 1.88e-08 | 168 |
| GO:190165427 | Thyroid | ATC | response to ketone | 105/6293 | 194/18723 | 2.96e-09 | 6.96e-08 | 105 |
| GO:000961225 | Thyroid | ATC | response to mechanical stimulus | 105/6293 | 216/18723 | 3.29e-06 | 3.70e-05 | 105 |
| GO:0010038210 | Thyroid | ATC | response to metal ion | 165/6293 | 373/18723 | 1.07e-05 | 1.05e-04 | 165 |
| GO:003257018 | Thyroid | ATC | response to progesterone | 25/6293 | 37/18723 | 2.50e-05 | 2.16e-04 | 25 |
| GO:009730528 | Thyroid | ATC | response to alcohol | 113/6293 | 253/18723 | 1.53e-04 | 1.06e-03 | 113 |
| GO:005159225 | Thyroid | ATC | response to calcium ion | 69/6293 | 149/18723 | 8.43e-04 | 4.62e-03 | 69 |
| GO:007124124 | Thyroid | ATC | cellular response to inorganic substance | 98/6293 | 226/18723 | 1.35e-03 | 7.02e-03 | 98 |
| GO:000941027 | Thyroid | ATC | response to xenobiotic stimulus | 184/6293 | 462/18723 | 2.70e-03 | 1.23e-02 | 184 |
| GO:005138427 | Thyroid | ATC | response to glucocorticoid | 65/6293 | 148/18723 | 5.62e-03 | 2.28e-02 | 65 |
| GO:000756517 | Thyroid | ATC | female pregnancy | 82/6293 | 193/18723 | 6.04e-03 | 2.42e-02 | 82 |
| GO:003196027 | Thyroid | ATC | response to corticosteroid | 72/6293 | 167/18723 | 6.39e-03 | 2.55e-02 | 72 |
| GO:007124823 | Thyroid | ATC | cellular response to metal ion | 82/6293 | 197/18723 | 1.11e-02 | 3.99e-02 | 82 |
| GO:005159127 | Thyroid | ATC | response to cAMP | 42/6293 | 93/18723 | 1.34e-02 | 4.67e-02 | 42 |
| Page: 1 2 3 4 5 6 7 8 9 10 11 12 13 14 15 16 17 18 19 20 21 22 |
| Pathway ID | Tissue | Disease Stage | Description | Gene Ratio | Bg Ratio | pvalue | p.adjust | qvalue | Count |
| hsa0465716 | Breast | Precancer | IL-17 signaling pathway | 20/684 | 94/8465 | 4.74e-05 | 4.54e-04 | 3.48e-04 | 20 |
| hsa05031 | Breast | Precancer | Amphetamine addiction | 14/684 | 69/8465 | 1.05e-03 | 7.35e-03 | 5.63e-03 | 14 |
| hsa0465717 | Breast | Precancer | IL-17 signaling pathway | 20/684 | 94/8465 | 4.74e-05 | 4.54e-04 | 3.48e-04 | 20 |
| hsa050311 | Breast | Precancer | Amphetamine addiction | 14/684 | 69/8465 | 1.05e-03 | 7.35e-03 | 5.63e-03 | 14 |
| hsa050312 | Breast | IDC | Amphetamine addiction | 18/867 | 69/8465 | 1.42e-04 | 1.36e-03 | 1.01e-03 | 18 |
| hsa0465721 | Breast | IDC | IL-17 signaling pathway | 18/867 | 94/8465 | 6.39e-03 | 3.30e-02 | 2.47e-02 | 18 |
| hsa050313 | Breast | IDC | Amphetamine addiction | 18/867 | 69/8465 | 1.42e-04 | 1.36e-03 | 1.01e-03 | 18 |
| hsa0465731 | Breast | IDC | IL-17 signaling pathway | 18/867 | 94/8465 | 6.39e-03 | 3.30e-02 | 2.47e-02 | 18 |
| hsa050314 | Breast | DCIS | Amphetamine addiction | 17/846 | 69/8465 | 3.37e-04 | 2.72e-03 | 2.00e-03 | 17 |
| hsa0465741 | Breast | DCIS | IL-17 signaling pathway | 18/846 | 94/8465 | 4.95e-03 | 2.67e-02 | 1.96e-02 | 18 |
| hsa050315 | Breast | DCIS | Amphetamine addiction | 17/846 | 69/8465 | 3.37e-04 | 2.72e-03 | 2.00e-03 | 17 |
| hsa0465751 | Breast | DCIS | IL-17 signaling pathway | 18/846 | 94/8465 | 4.95e-03 | 2.67e-02 | 1.96e-02 | 18 |
| hsa0465718 | Cervix | CC | IL-17 signaling pathway | 31/1267 | 94/8465 | 8.71e-06 | 7.43e-05 | 4.39e-05 | 31 |
| hsa0465719 | Cervix | CC | IL-17 signaling pathway | 31/1267 | 94/8465 | 8.71e-06 | 7.43e-05 | 4.39e-05 | 31 |
| hsa0465722 | Cervix | HSIL_HPV | IL-17 signaling pathway | 15/459 | 94/8465 | 1.45e-04 | 1.74e-03 | 1.40e-03 | 15 |
| hsa0465732 | Cervix | HSIL_HPV | IL-17 signaling pathway | 15/459 | 94/8465 | 1.45e-04 | 1.74e-03 | 1.40e-03 | 15 |
| hsa0465742 | Cervix | N_HPV | IL-17 signaling pathway | 16/349 | 94/8465 | 1.20e-06 | 1.64e-05 | 1.28e-05 | 16 |
| hsa0465752 | Cervix | N_HPV | IL-17 signaling pathway | 16/349 | 94/8465 | 1.20e-06 | 1.64e-05 | 1.28e-05 | 16 |
| hsa0465720 | Endometrium | EEC | IL-17 signaling pathway | 23/1237 | 94/8465 | 7.61e-03 | 3.63e-02 | 2.71e-02 | 23 |
| hsa04657110 | Endometrium | EEC | IL-17 signaling pathway | 23/1237 | 94/8465 | 7.61e-03 | 3.63e-02 | 2.71e-02 | 23 |
| Page: 1 2 3 |
Top |
Cell-cell communication analysis |
| Identification of potential cell-cell interactions between two cell types and their ligand-receptor pairs for different disease states |
| Ligand | Receptor | LRpair | Pathway | Tissue | Disease Stage |
| Page: 1 |
Top |
Single-cell gene regulatory network inference analysis |
| Find out the significant the regulons (TFs) and the target genes of each regulon across cell types for different disease states |
| TF | Cell Type | Tissue | Disease Stage | Target Gene | RSS | Regulon Activity |
| FOSB | STM | Liver | Cirrhotic | FOS,JUNB,FXYD5, etc. | 3.66e-01 |  |
| FOSB | STM | Oral cavity | ADJ | KLF4,FOS,ATF3, etc. | 7.25e-01 |  |
| FOSB | DUCT1 | Pancreas | Healthy | TC2N,MCL1,PGGHG, etc. | 4.23e-01 |  |
| FOSB | CD8TCM | Pancreas | PDAC | AC020916.1,NFE2L3,MYADM, etc. | 2.30e-01 |  |
| FOSB | CD4TN | Pancreas | PDAC | AC020916.1,NFE2L3,MYADM, etc. | 1.85e-01 | |
| ∗The dot plots of a searched regulon are shown for all cell subpopulations in each disease state of each tissue based on the regulon specific score inferred using pySCENIC and by calculating the average expression. |
| Page: 1 |
Top |
Somatic mutation of malignant transformation related genes |
| Annotation of somatic variants for genes involved in malignant transformation |
| Hugo Symbol | Variant Class | Variant Classification | dbSNP RS | HGVSc | HGVSp | HGVSp Short | SWISSPROT | BIOTYPE | SIFT | PolyPhen | Tumor Sample Barcode | Tissue | Histology | Sex | Age | Stage | Therapy Types | Drugs | Outcome |
| FOSB | SNV | Missense_Mutation | c.592N>C | p.Glu198Gln | p.E198Q | P53539 | protein_coding | tolerated(1) | possibly_damaging(0.887) | TCGA-AC-A23H-01 | Breast | breast invasive carcinoma | Female | >=65 | I/II | Unknown | Unknown | PD | |
| FOSB | SNV | Missense_Mutation | novel | c.982N>A | p.Asp328Asn | p.D328N | P53539 | protein_coding | deleterious(0.02) | probably_damaging(0.992) | TCGA-AC-A3W5-01 | Breast | breast invasive carcinoma | Female | >=65 | I/II | Chemotherapy | docetaxel | CR |
| FOSB | SNV | Missense_Mutation | novel | c.878N>G | p.Phe293Cys | p.F293C | P53539 | protein_coding | tolerated(0.21) | benign(0.201) | TCGA-LL-A8F5-01 | Breast | breast invasive carcinoma | Female | <65 | I/II | Chemotherapy | cyclophosphamide | SD |
| FOSB | insertion | Frame_Shift_Ins | novel | c.1005_1006insTCAACAAGAAGGAACTATAATTCTTCCCATCA | p.Leu336SerfsTer126 | p.L336Sfs*126 | P53539 | protein_coding | TCGA-AO-A03P-01 | Breast | breast invasive carcinoma | Female | <65 | I/II | Hormone Therapy | letrozole | PD | ||
| FOSB | insertion | In_Frame_Ins | novel | c.950_951insGACCAGCCTGGGAAACATAGGGAGGACTTGTCTCTA | p.Ala317_Gln318insThrSerLeuGlyAsnIleGlyArgThrCysLeuTyr | p.A317_Q318insTSLGNIGRTCLY | P53539 | protein_coding | TCGA-BH-A0B3-01 | Breast | breast invasive carcinoma | Female | <65 | I/II | Chemotherapy | cyclophosphamide | SD | ||
| FOSB | SNV | Missense_Mutation | novel | c.861N>C | p.Gln287His | p.Q287H | P53539 | protein_coding | tolerated(0.09) | benign(0) | TCGA-2W-A8YY-01 | Cervix | cervical & endocervical cancer | Female | <65 | I/II | Chemotherapy | cisplatin | CR |
| FOSB | SNV | Missense_Mutation | c.592G>C | p.Glu198Gln | p.E198Q | P53539 | protein_coding | tolerated(1) | possibly_damaging(0.887) | TCGA-C5-A3HE-01 | Cervix | cervical & endocervical cancer | Female | <65 | I/II | Unknown | Unknown | PD | |
| FOSB | SNV | Missense_Mutation | c.859N>G | p.Gln287Glu | p.Q287E | P53539 | protein_coding | tolerated(1) | benign(0.003) | TCGA-IR-A3LI-01 | Cervix | cervical & endocervical cancer | Female | <65 | I/II | Chemotherapy | cisplatin | CR | |
| FOSB | SNV | Missense_Mutation | c.498A>C | p.Lys166Asn | p.K166N | P53539 | protein_coding | deleterious(0) | probably_damaging(0.996) | TCGA-LP-A5U3-01 | Cervix | cervical & endocervical cancer | Female | <65 | I/II | Unknown | Unknown | SD | |
| FOSB | SNV | Missense_Mutation | novel | c.491G>A | p.Arg164Gln | p.R164Q | P53539 | protein_coding | deleterious(0) | probably_damaging(0.995) | TCGA-AA-3984-01 | Colorectum | colon adenocarcinoma | Female | <65 | I/II | Unknown | Unknown | SD |
| Page: 1 2 3 4 |
Top |
Related drugs of malignant transformation related genes |
| Identification of chemicals and drugs interact with genes involved in malignant transfromation |
| (DGIdb 4.0) |
| Entrez ID | Symbol | Category | Interaction Types | Drug Claim Name | Drug Name | PMIDs |
| Page: 1 |

Copyright 2023-Present -The University of Texas Health Science Center at Houston |