Schematic overview of the cellular and molecular mechanisms involved in the cancer progression, including the proposed cellular and molecular mechanisms in cancer cells trajectory. AT1: alveolar type 1 cells; AT2: alveolar type 2 cells; AAH: atypical adenomatous hyperplasia; AIS: adenocarcinoma in situ; MIA: minimally invasive adenocarcinoma; IA: invasive adenocarcinoma; EMT: epithelial-mesenchymal transition

Home

Download

Statistics

Help

Contact

Center for Computational Systems Medicine
leaf

Gene summary

leaf

Malignant transformation analysis

leaf

Malignant transformation related pathway analysis

leaf

Cell-cell communication analysis

leaf

Single-cell gene regulatory network inference analysis

leaf

Somatic mutation of malignant transformation related genes

leaf

Related drugs of malignant transformation related genes

Gene: FMR1

Gene summary for FMR1

check button Gene summary.

Gene informationSpeciesHuman
Gene symbol

FMR1

Gene ID

2332

Gene nameFMRP translational regulator 1
Gene AliasFMRP
CytomapXq27.3
Gene Typeprotein-coding
GO ID

GO:0000375

UniProtAcc

Q06787


Top

Malignant transformation analysis

check button Identification of the aberrant gene expression in precancerous and cancerous lesions by comparing the gene expression of stem-like cells in diseased tissues with normal stem cells
check button Malignant transformation involving gene list.
Entrez IDSymbolReplicatesSpeciesOrganTissueAdj P-valueLog2FCMalignancy
2332FMR1LZE4THumanEsophagusESCC8.09e-051.18e-010.0811
2332FMR1LZE7THumanEsophagusESCC5.27e-045.28e-010.0667
2332FMR1LZE20THumanEsophagusESCC1.82e-031.56e-010.0662
2332FMR1LZE24THumanEsophagusESCC3.58e-195.99e-010.0596
2332FMR1LZE21THumanEsophagusESCC1.96e-041.95e-010.0655
2332FMR1LZE6THumanEsophagusESCC1.36e-049.94e-020.0845
2332FMR1P1T-EHumanEsophagusESCC1.56e-054.66e-010.0875
2332FMR1P2T-EHumanEsophagusESCC9.72e-222.68e-010.1177
2332FMR1P4T-EHumanEsophagusESCC3.22e-101.87e-010.1323
2332FMR1P5T-EHumanEsophagusESCC1.14e-081.20e-010.1327
2332FMR1P8T-EHumanEsophagusESCC7.01e-193.15e-010.0889
2332FMR1P9T-EHumanEsophagusESCC1.05e-122.97e-010.1131
2332FMR1P10T-EHumanEsophagusESCC1.22e-264.39e-010.116
2332FMR1P11T-EHumanEsophagusESCC2.25e-051.61e-010.1426
2332FMR1P12T-EHumanEsophagusESCC5.34e-192.77e-010.1122
2332FMR1P15T-EHumanEsophagusESCC4.91e-192.11e-010.1149
2332FMR1P16T-EHumanEsophagusESCC2.42e-064.91e-020.1153
2332FMR1P19T-EHumanEsophagusESCC1.00e-053.58e-010.1662
2332FMR1P20T-EHumanEsophagusESCC7.18e-051.80e-010.1124
2332FMR1P21T-EHumanEsophagusESCC3.06e-092.06e-010.1617
Page: 1 2 3 4 5 

check button Transcriptomic changes along malignancy continuum.
TissueExpression DynamicsAbbreviation
EsophagusThe image shows the transcriptomic changes along malignancy continuum.log2FC in expression of this searched gene in stem-like cells from each diseased tissue sample relative to stem-like cells in normal samples in each tissue plotted against the malignancy continuum. Samples are colored based on if they are from different disease stage.ESCC: Esophageal squamous cell carcinoma
HGIN: High-grade intraepithelial neoplasias
LGIN: Low-grade intraepithelial neoplasias
LiverThe image shows the transcriptomic changes along malignancy continuum.log2FC in expression of this searched gene in stem-like cells from each diseased tissue sample relative to stem-like cells in normal samples in each tissue plotted against the malignancy continuum. Samples are colored based on if they are from different disease stage.
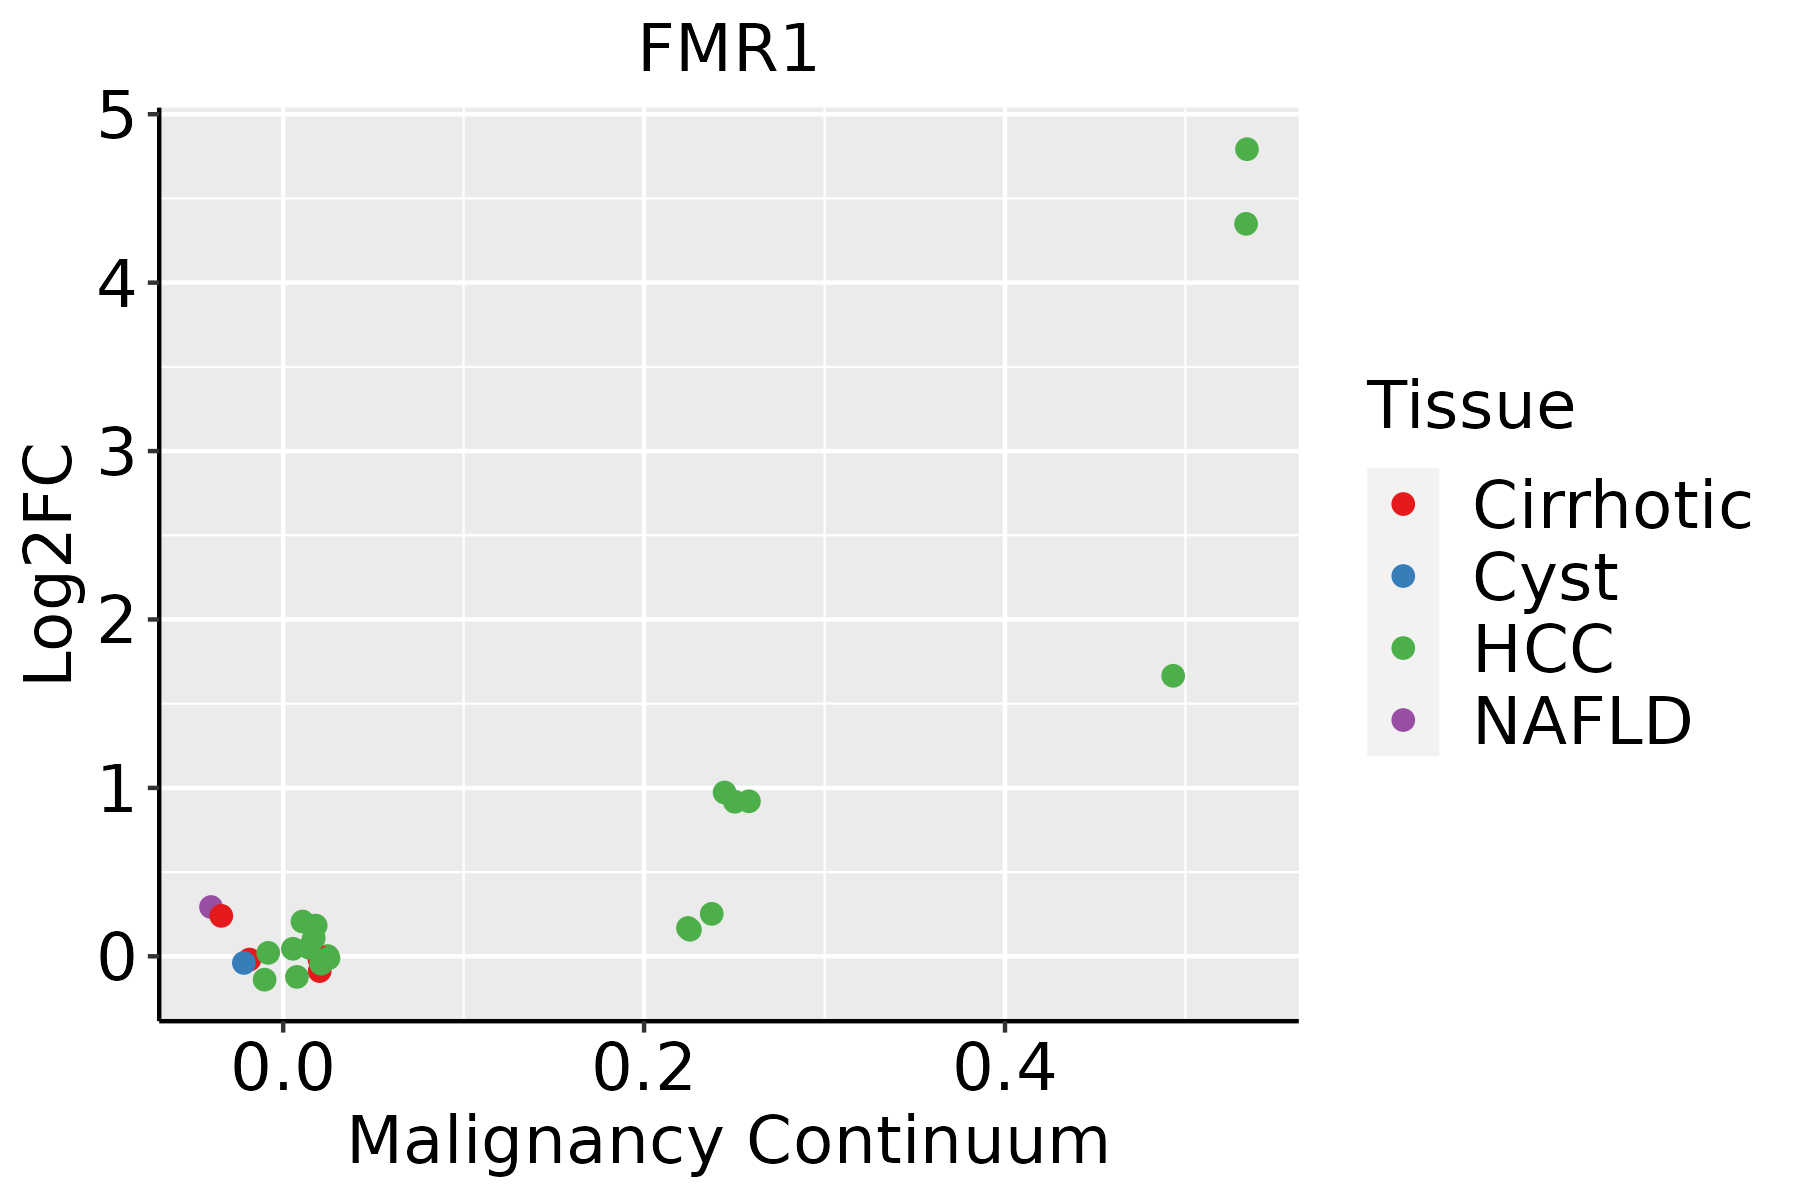
HCC: Hepatocellular carcinoma
NAFLD: Non-alcoholic fatty liver disease
Oral CavityThe image shows the transcriptomic changes along malignancy continuum.log2FC in expression of this searched gene in stem-like cells from each diseased tissue sample relative to stem-like cells in normal samples in each tissue plotted against the malignancy continuum. Samples are colored based on if they are from different disease stage.
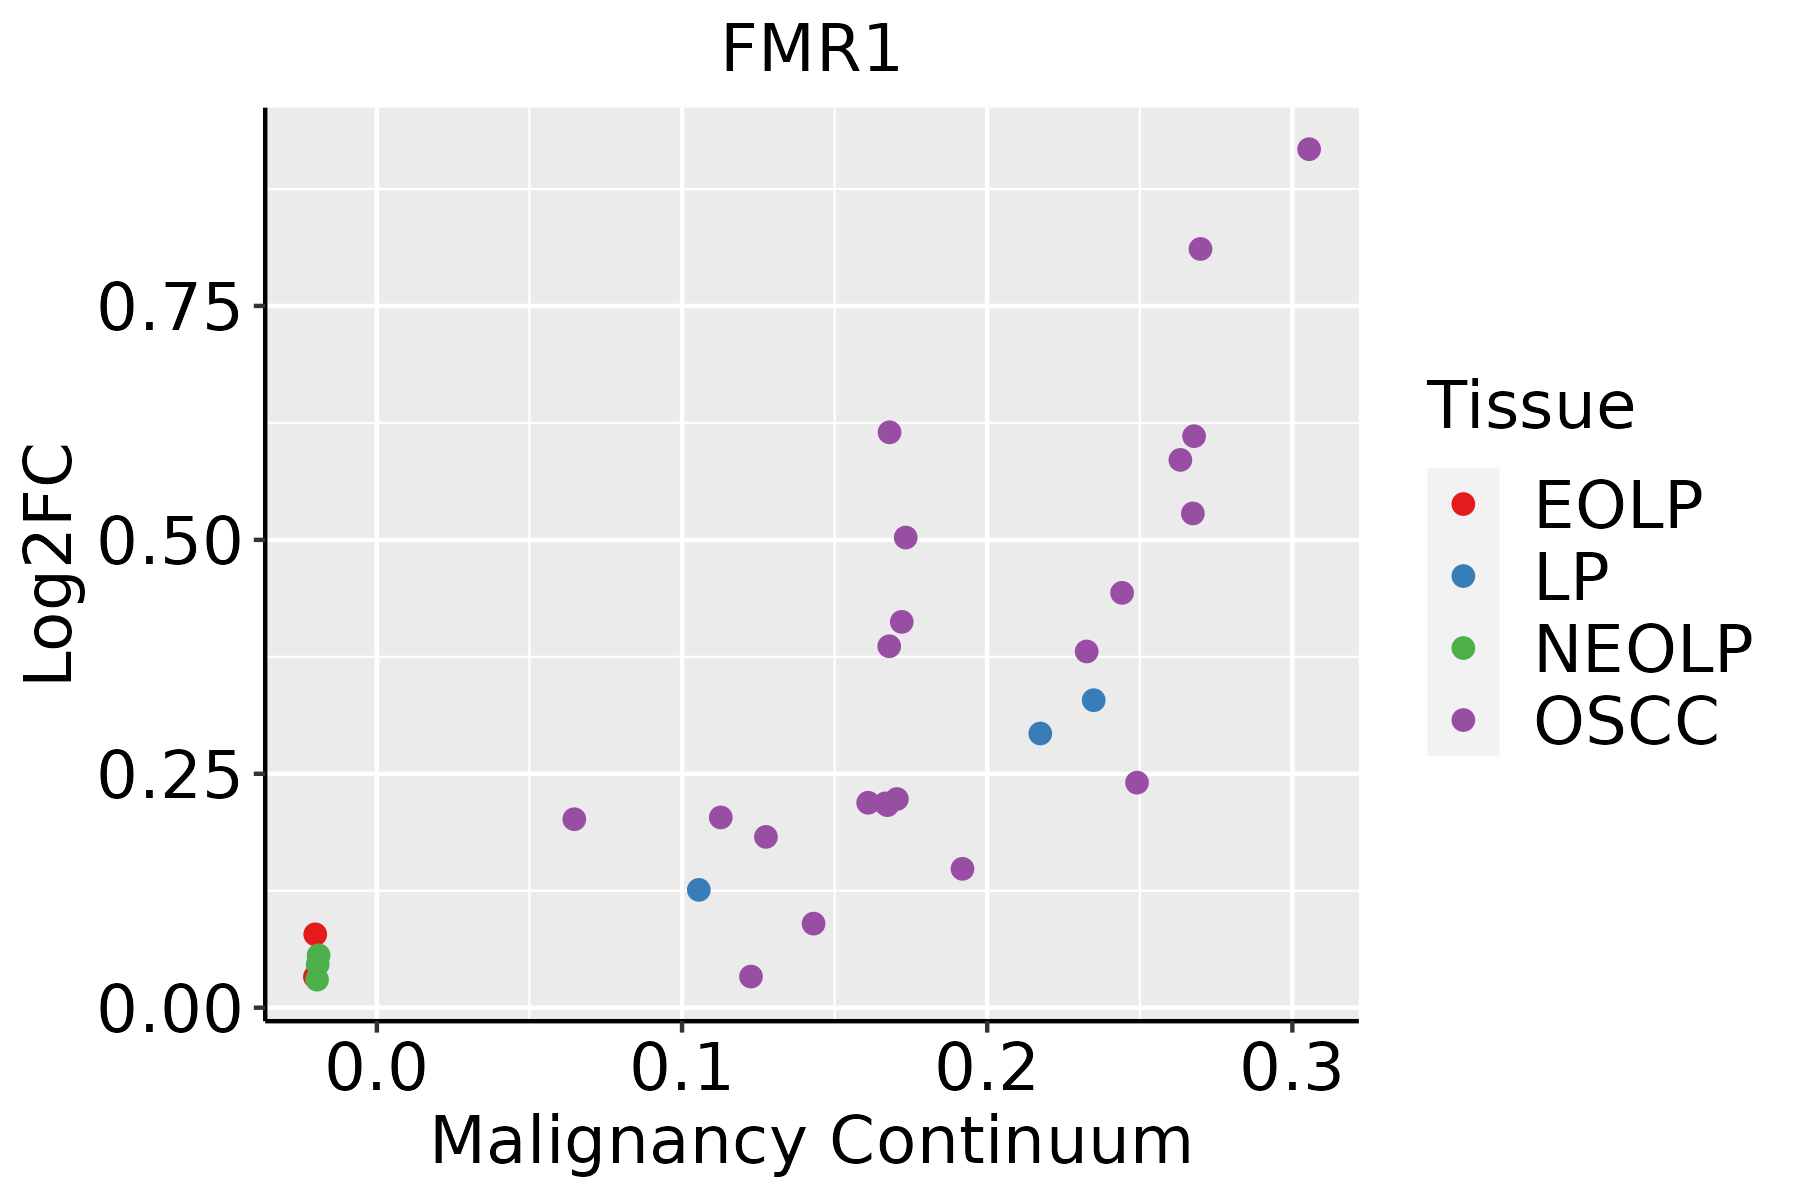
EOLP: Erosive Oral lichen planus
LP: leukoplakia
NEOLP: Non-erosive oral lichen planus
OSCC: Oral squamous cell carcinoma
ThyroidThe image shows the transcriptomic changes along malignancy continuum.log2FC in expression of this searched gene in stem-like cells from each diseased tissue sample relative to stem-like cells in normal samples in each tissue plotted against the malignancy continuum. Samples are colored based on if they are from different disease stage.
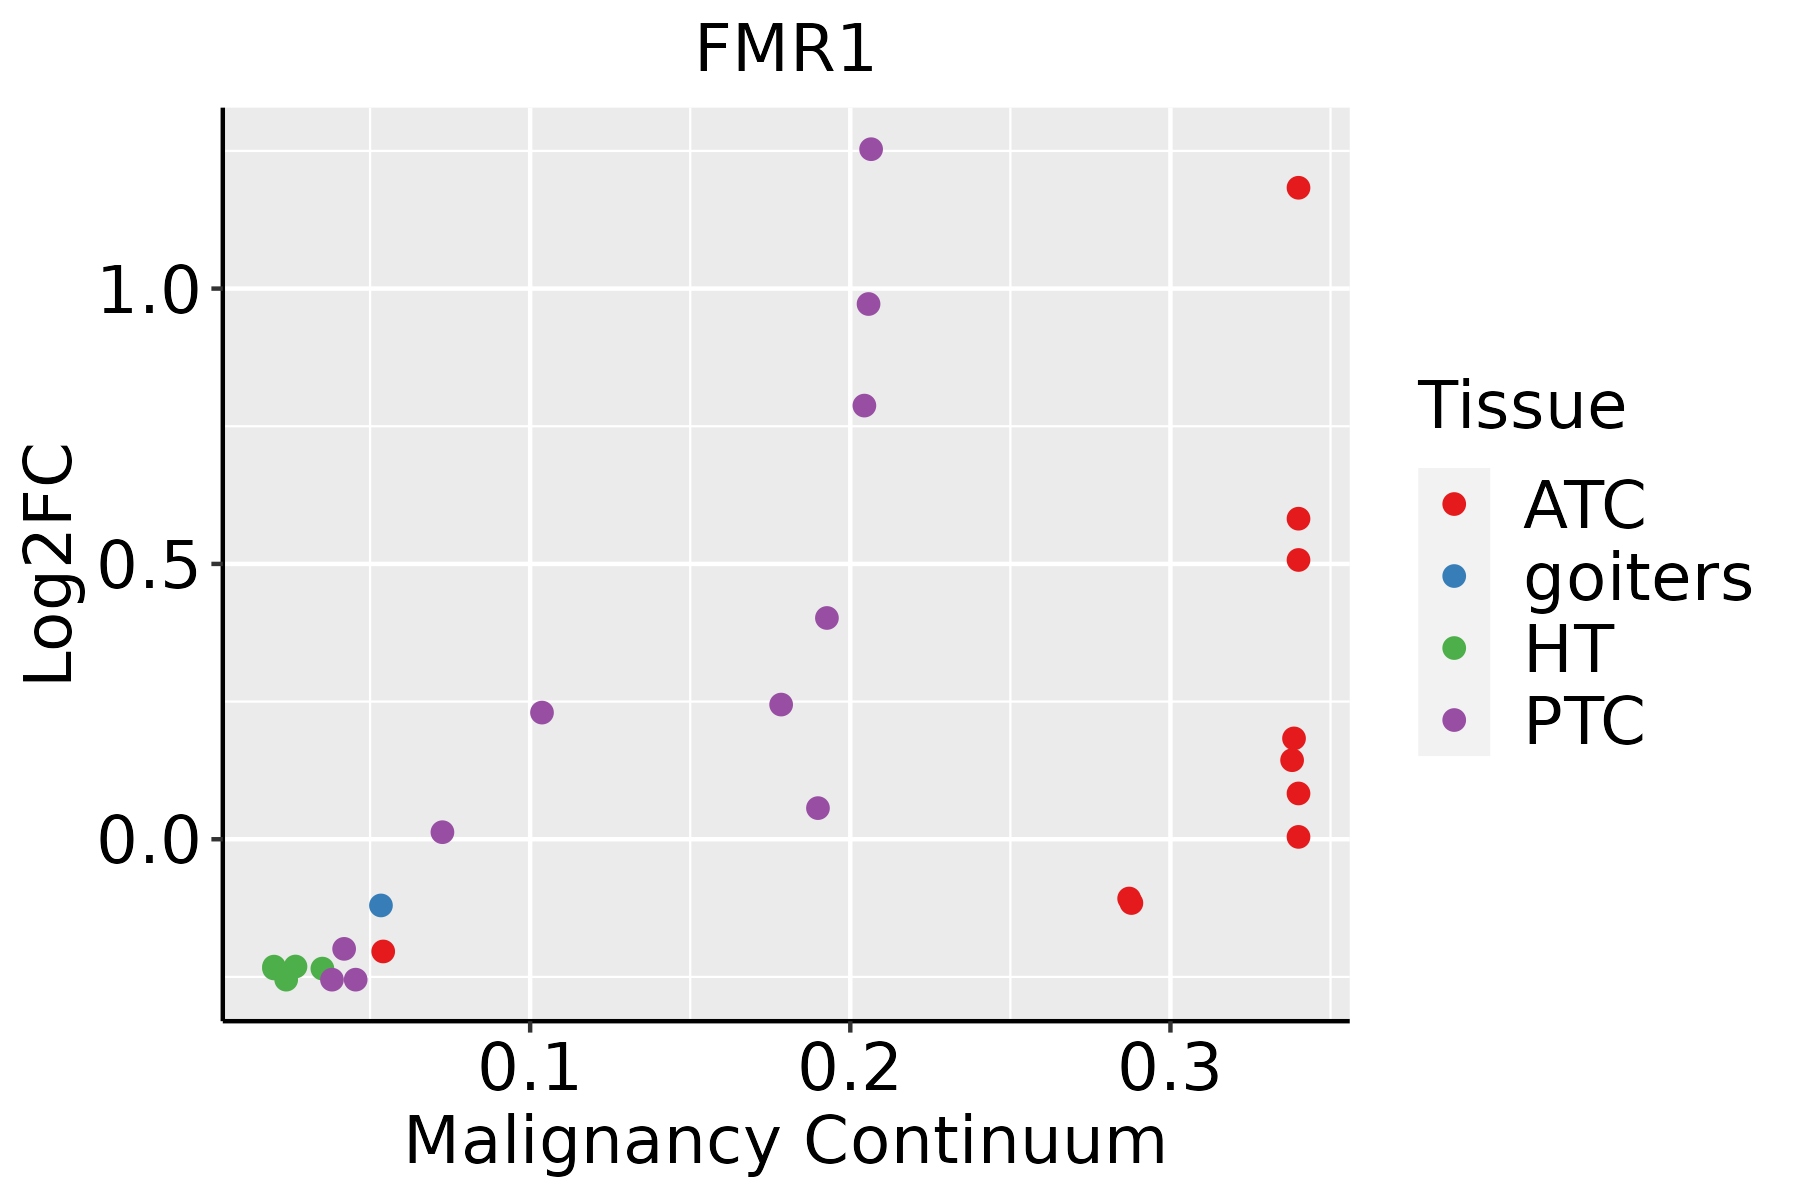
ATC: Anaplastic thyroid cancer
HT: Hashimoto's thyroiditis
PTC: Papillary thyroid cancer
∗log2FC in expression of this searched gene in stem-like cells from each diseased tissue sample relative to stem-like cells in normal samples in each tissue plotted against the malignancy continuum. Samples are colored based on if they are from different disease stage.

Top

Malignant transformation related pathway analysis

check buttonFind out the enriched GO biological processes and KEGG pathways involved in transition from healthy to precancer to cancer
check button Figure of enriched GO biological processes.
TissueDisease StageEnriched GO biological Processes
ColorectumADGO analysis - Figure of enriched GO biological processes: Top 15 enriched GO BP terms are showed in the bar plot of each disease state in each tissue. Each row represents a significant GO biological process which is colored according to the -log10(p.adjust).
ColorectumSERGO analysis - Figure of enriched GO biological processes: Top 15 enriched GO BP terms are showed in the bar plot of each disease state in each tissue. Each row represents a significant GO biological process which is colored according to the -log10(p.adjust).
ColorectumMSSGO analysis - Figure of enriched GO biological processes: Top 15 enriched GO BP terms are showed in the bar plot of each disease state in each tissue. Each row represents a significant GO biological process which is colored according to the -log10(p.adjust).
ColorectumMSI-HGO analysis - Figure of enriched GO biological processes: Top 15 enriched GO BP terms are showed in the bar plot of each disease state in each tissue. Each row represents a significant GO biological process which is colored according to the -log10(p.adjust).
ColorectumFAPGO analysis - Figure of enriched GO biological processes: Top 15 enriched GO BP terms are showed in the bar plot of each disease state in each tissue. Each row represents a significant GO biological process which is colored according to the -log10(p.adjust).
∗Top 15 enriched GO BP terms are showed in the bar plot of each disease state in each tissue. Each row represents a significant GO biological process which is colored according to the -log10(p.adjust).
Page: 1 2 3 4 5 6 7 8 9 

check button Enriched GO biological processes.
GO IDTissueDisease StageDescriptionGene RatioBg Ratiopvaluep.adjustCount
GO:1903050113ThyroidPTCregulation of proteolysis involved in cellular protein catabolic process140/5968221/187234.63e-221.01e-19140
GO:0006403112ThyroidPTCRNA localization130/5968201/187239.23e-221.94e-19130
GO:0050684112ThyroidPTCregulation of mRNA processing98/5968137/187231.53e-213.10e-1998
GO:0045732113ThyroidPTCpositive regulation of protein catabolic process142/5968231/187231.43e-202.38e-18142
GO:0043484113ThyroidPTCregulation of RNA splicing102/5968148/187232.03e-203.21e-18102
GO:0006401112ThyroidPTCRNA catabolic process163/5968278/187232.13e-203.27e-18163
GO:0061136113ThyroidPTCregulation of proteasomal protein catabolic process121/5968187/187232.25e-203.37e-18121
GO:1903364113ThyroidPTCpositive regulation of cellular protein catabolic process104/5968155/187231.93e-192.39e-17104
GO:0006402112ThyroidPTCmRNA catabolic process139/5968232/187239.59e-191.12e-16139
GO:0006413112ThyroidPTCtranslational initiation84/5968118/187231.89e-182.09e-1684
GO:0051098113ThyroidPTCregulation of binding195/5968363/187233.21e-183.37e-16195
GO:0045862113ThyroidPTCpositive regulation of proteolysis198/5968372/187236.68e-186.91e-16198
GO:001657010ThyroidPTChistone modification235/5968463/187231.17e-171.15e-15235
GO:0006417113ThyroidPTCregulation of translation236/5968468/187232.70e-172.52e-15236
GO:0034655112ThyroidPTCnucleobase-containing compound catabolic process211/5968407/187232.72e-172.52e-15211
GO:1901800112ThyroidPTCpositive regulation of proteasomal protein catabolic process80/5968114/187234.80e-174.27e-1580
GO:1903052112ThyroidPTCpositive regulation of proteolysis involved in cellular protein catabolic process88/5968133/187234.30e-163.39e-1488
GO:0048024113ThyroidPTCregulation of mRNA splicing, via spliceosome71/5968101/187232.39e-151.71e-1371
GO:0046700111ThyroidPTCheterocycle catabolic process221/5968445/187232.43e-151.72e-13221
GO:0044270111ThyroidPTCcellular nitrogen compound catabolic process223/5968451/187233.34e-152.31e-13223
Page: 1 2 3 4 5 6 7 8 9 10 11 12 13 14 15 16 17 18 19 20 21 22 23 24 25 26 27 28 29 30 31 32 

check button Enriched KEGG pathways.
Pathway IDTissueDisease StageDescriptionGene RatioBg Ratiopvaluep.adjustqvalueCount
Page: 1 

Top

Cell-cell communication analysis

check buttonIdentification of potential cell-cell interactions between two cell types and their ligand-receptor pairs for different disease states
LigandReceptorLRpairPathwayTissueDisease Stage
Page: 1 

Top

Single-cell gene regulatory network inference analysis

check buttonFind out the significant the regulons (TFs) and the target genes of each regulon across cell types for different disease states
TFCell TypeTissueDisease StageTarget GeneRSSRegulon Activity
∗The dot plots of a searched regulon are shown for all cell subpopulations in each disease state of each tissue based on the regulon specific score inferred using pySCENIC and by calculating the average expression.
Page: 1 

Top

Somatic mutation of malignant transformation related genes

check buttonAnnotation of somatic variants for genes involved in malignant transformation
Hugo SymbolVariant ClassVariant ClassificationdbSNP RSHGVScHGVSpHGVSp ShortSWISSPROTBIOTYPESIFTPolyPhenTumor Sample BarcodeTissueHistologySexAgeStageTherapy TypesDrugsOutcome
FMR1SNVMissense_Mutationc.763N>Gp.Leu255Valp.L255VQ06787protein_codingtolerated(0.08)possibly_damaging(0.856)TCGA-5L-AAT1-01Breastbreast invasive carcinomaFemale<65III/IVHormone TherapyletrozolSD
FMR1SNVMissense_Mutationnovelc.215N>Cp.Asn72Thrp.N72TQ06787protein_codingtolerated(0.05)probably_damaging(0.994)TCGA-A1-A0SH-01Breastbreast invasive carcinomaFemale<65I/IIChemotherapytcSD
FMR1SNVMissense_Mutationc.1822N>Tp.Gly608Cysp.G608CQ06787protein_codingdeleterious_low_confidence(0.02)probably_damaging(0.935)TCGA-A7-A56D-01Breastbreast invasive carcinomaFemale>=65I/IIHormone TherapyarimidexSD
FMR1SNVMissense_Mutationrs782738200c.1580G>Ap.Arg527Hisp.R527HQ06787protein_codingdeleterious(0.01)probably_damaging(0.999)TCGA-B6-A401-01Breastbreast invasive carcinomaFemale<65I/IIChemotherapycyclophosphamideSD
FMR1SNVMissense_Mutationc.1525N>Ap.Glu509Lysp.E509KQ06787protein_codingtolerated(0.11)probably_damaging(0.998)TCGA-BH-A0HA-01Breastbreast invasive carcinomaFemale<65I/IIUnknownUnknownSD
FMR1SNVMissense_Mutationc.859N>Gp.Gln287Glup.Q287EQ06787protein_codingdeleterious(0.03)benign(0.214)TCGA-C8-A12K-01Breastbreast invasive carcinomaFemale>=65I/IIUnknownUnknownSD
FMR1SNVMissense_Mutationnovelc.283N>Ap.Glu95Lysp.E95KQ06787protein_codingtolerated(0.09)benign(0.03)TCGA-D8-A1JA-01Breastbreast invasive carcinomaFemale<65III/IVChemotherapyadriamycinPD
FMR1SNVMissense_Mutationc.690G>Tp.Met230Ilep.M230IQ06787protein_codingtolerated(0.05)possibly_damaging(0.519)TCGA-D8-A1JD-01Breastbreast invasive carcinomaFemale<65I/IIChemotherapyadriamycinSD
FMR1SNVMissense_Mutationc.691G>Ap.Gly231Serp.G231SQ06787protein_codingdeleterious(0)probably_damaging(1)TCGA-D8-A1JD-01Breastbreast invasive carcinomaFemale<65I/IIChemotherapyadriamycinSD
FMR1SNVMissense_Mutationc.1525N>Ap.Glu509Lysp.E509KQ06787protein_codingtolerated(0.11)probably_damaging(0.998)TCGA-EK-A2RJ-01Cervixcervical & endocervical cancerFemale<65I/IIUnknownUnknownSD
Page: 1 2 3 4 5 6 7 8 9 10 11 12 13 

Top

Related drugs of malignant transformation related genes

check buttonIdentification of chemicals and drugs interact with genes involved in malignant transfromation
(DGIdb 4.0)
Entrez IDSymbolCategoryInteraction TypesDrug Claim NameDrug NamePMIDs
Page: 1