
|
|||||
|
 | |
| |
| |
| |
| |
| |
|
Gene: DTX3 |
Gene summary for DTX3 |
| Gene information | Species | Human | Gene symbol | DTX3 | Gene ID | 196403 |
| Gene name | deltex E3 ubiquitin ligase 3 | |
| Gene Alias | RNF154 | |
| Cytomap | 12q13.3 | |
| Gene Type | protein-coding | GO ID | GO:0006464 | UniProtAcc | Q8N9I9 |
Top |
Malignant transformation analysis |
| Identification of the aberrant gene expression in precancerous and cancerous lesions by comparing the gene expression of stem-like cells in diseased tissues with normal stem cells |
| Entrez ID | Symbol | Replicates | Species | Organ | Tissue | Adj P-value | Log2FC | Malignancy |
| 196403 | DTX3 | LZE2T | Human | Esophagus | ESCC | 7.46e-03 | 2.68e-01 | 0.082 |
| 196403 | DTX3 | LZE4T | Human | Esophagus | ESCC | 7.84e-03 | 6.74e-02 | 0.0811 |
| 196403 | DTX3 | LZE7T | Human | Esophagus | ESCC | 1.16e-09 | 4.55e-01 | 0.0667 |
| 196403 | DTX3 | LZE8T | Human | Esophagus | ESCC | 4.34e-02 | 8.34e-02 | 0.067 |
| 196403 | DTX3 | LZE24T | Human | Esophagus | ESCC | 1.20e-07 | 2.90e-01 | 0.0596 |
| 196403 | DTX3 | P1T-E | Human | Esophagus | ESCC | 3.52e-05 | 2.36e-01 | 0.0875 |
| 196403 | DTX3 | P2T-E | Human | Esophagus | ESCC | 3.73e-35 | 7.55e-01 | 0.1177 |
| 196403 | DTX3 | P4T-E | Human | Esophagus | ESCC | 3.02e-18 | 2.74e-01 | 0.1323 |
| 196403 | DTX3 | P5T-E | Human | Esophagus | ESCC | 2.53e-14 | 1.15e-01 | 0.1327 |
| 196403 | DTX3 | P8T-E | Human | Esophagus | ESCC | 3.28e-31 | 5.75e-01 | 0.0889 |
| 196403 | DTX3 | P9T-E | Human | Esophagus | ESCC | 1.27e-06 | 1.14e-01 | 0.1131 |
| 196403 | DTX3 | P10T-E | Human | Esophagus | ESCC | 1.60e-20 | 4.88e-01 | 0.116 |
| 196403 | DTX3 | P11T-E | Human | Esophagus | ESCC | 7.66e-11 | 4.32e-01 | 0.1426 |
| 196403 | DTX3 | P12T-E | Human | Esophagus | ESCC | 4.19e-32 | 6.05e-01 | 0.1122 |
| 196403 | DTX3 | P15T-E | Human | Esophagus | ESCC | 5.24e-20 | 4.66e-01 | 0.1149 |
| 196403 | DTX3 | P16T-E | Human | Esophagus | ESCC | 8.32e-27 | 5.47e-01 | 0.1153 |
| 196403 | DTX3 | P17T-E | Human | Esophagus | ESCC | 4.88e-03 | 2.49e-01 | 0.1278 |
| 196403 | DTX3 | P19T-E | Human | Esophagus | ESCC | 2.15e-06 | 3.10e-01 | 0.1662 |
| 196403 | DTX3 | P20T-E | Human | Esophagus | ESCC | 1.12e-07 | 1.01e-01 | 0.1124 |
| 196403 | DTX3 | P21T-E | Human | Esophagus | ESCC | 9.28e-06 | 1.61e-02 | 0.1617 |
| Page: 1 2 3 4 5 |
| Tissue | Expression Dynamics | Abbreviation |
| Esophagus | 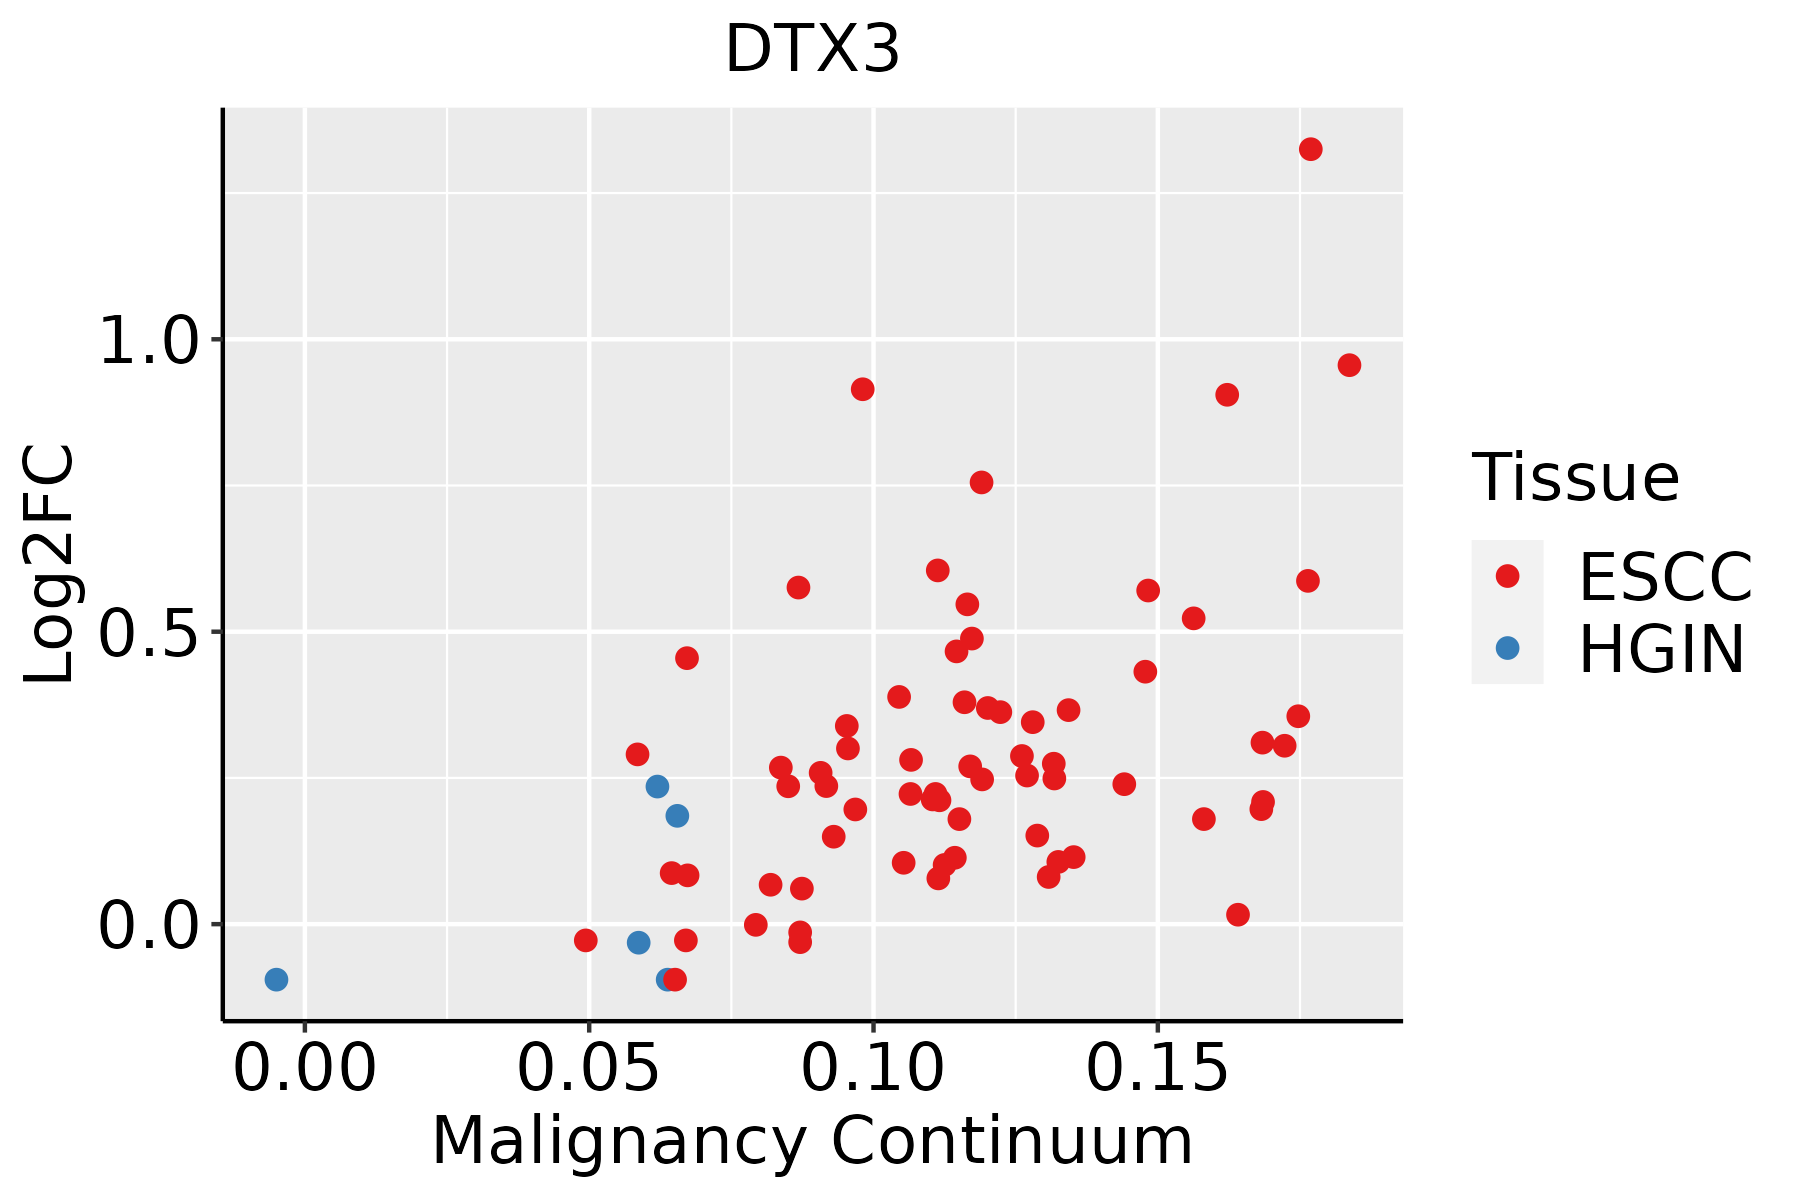 | ESCC: Esophageal squamous cell carcinoma |
| HGIN: High-grade intraepithelial neoplasias | ||
| LGIN: Low-grade intraepithelial neoplasias | ||
| Oral Cavity |  | EOLP: Erosive Oral lichen planus |
| LP: leukoplakia | ||
| NEOLP: Non-erosive oral lichen planus | ||
| OSCC: Oral squamous cell carcinoma | ||
| Thyroid |  | ATC: Anaplastic thyroid cancer |
| HT: Hashimoto's thyroiditis | ||
| PTC: Papillary thyroid cancer |
| ∗log2FC in expression of this searched gene in stem-like cells from each diseased tissue sample relative to stem-like cells in normal samples in each tissue plotted against the malignancy continuum. Samples are colored based on if they are from different disease stage. |
Top |
Malignant transformation related pathway analysis |
| Find out the enriched GO biological processes and KEGG pathways involved in transition from healthy to precancer to cancer |
| Tissue | Disease Stage | Enriched GO biological Processes |
| Colorectum | AD |  |
| Colorectum | SER |  |
| Colorectum | MSS |  |
| Colorectum | MSI-H |  |
| Colorectum | FAP |  |
| ∗Top 15 enriched GO BP terms are showed in the bar plot of each disease state in each tissue. Each row represents a significant GO biological process which is colored according to the -log10(p.adjust). |
| Page: 1 2 3 4 5 6 7 8 9 |
| GO ID | Tissue | Disease Stage | Description | Gene Ratio | Bg Ratio | pvalue | p.adjust | Count |
| GO:005143834 | Thyroid | ATC | regulation of ubiquitin-protein transferase activity | 38/6293 | 53/18723 | 1.60e-08 | 3.23e-07 | 38 |
| GO:0009615111 | Thyroid | ATC | response to virus | 173/6293 | 367/18723 | 4.23e-08 | 7.71e-07 | 173 |
| GO:003209224 | Thyroid | ATC | positive regulation of protein binding | 53/6293 | 85/18723 | 5.37e-08 | 9.67e-07 | 53 |
| GO:005144434 | Thyroid | ATC | negative regulation of ubiquitin-protein transferase activity | 17/6293 | 19/18723 | 7.02e-07 | 9.42e-06 | 17 |
| GO:000704116 | Thyroid | ATC | lysosomal transport | 63/6293 | 114/18723 | 1.58e-06 | 1.93e-05 | 63 |
| GO:200102214 | Thyroid | ATC | positive regulation of response to DNA damage stimulus | 59/6293 | 105/18723 | 1.62e-06 | 1.97e-05 | 59 |
| GO:000628211 | Thyroid | ATC | regulation of DNA repair | 68/6293 | 130/18723 | 8.19e-06 | 8.27e-05 | 68 |
| GO:004311224 | Thyroid | ATC | receptor metabolic process | 82/6293 | 166/18723 | 1.78e-05 | 1.63e-04 | 82 |
| GO:001657416 | Thyroid | ATC | histone ubiquitination | 30/6293 | 47/18723 | 2.16e-05 | 1.92e-04 | 30 |
| GO:000283123 | Thyroid | ATC | regulation of response to biotic stimulus | 144/6293 | 327/18723 | 4.94e-05 | 3.91e-04 | 144 |
| GO:005186513 | Thyroid | ATC | protein autoubiquitination | 41/6293 | 73/18723 | 6.14e-05 | 4.69e-04 | 41 |
| GO:200077911 | Thyroid | ATC | regulation of double-strand break repair | 45/6293 | 85/18723 | 1.83e-04 | 1.24e-03 | 45 |
| GO:003352214 | Thyroid | ATC | histone H2A ubiquitination | 18/6293 | 26/18723 | 2.20e-04 | 1.44e-03 | 18 |
| GO:000630212 | Thyroid | ATC | double-strand break repair | 110/6293 | 251/18723 | 4.48e-04 | 2.65e-03 | 110 |
| GO:000721915 | Thyroid | ATC | Notch signaling pathway | 79/6293 | 172/18723 | 5.08e-04 | 2.96e-03 | 79 |
| GO:005160712 | Thyroid | ATC | defense response to virus | 115/6293 | 265/18723 | 5.31e-04 | 3.09e-03 | 115 |
| GO:014054612 | Thyroid | ATC | defense response to symbiont | 115/6293 | 265/18723 | 5.31e-04 | 3.09e-03 | 115 |
| GO:000651314 | Thyroid | ATC | protein monoubiquitination | 35/6293 | 67/18723 | 1.26e-03 | 6.58e-03 | 35 |
| GO:200064422 | Thyroid | ATC | regulation of receptor catabolic process | 9/6293 | 11/18723 | 1.46e-03 | 7.47e-03 | 9 |
| GO:004573911 | Thyroid | ATC | positive regulation of DNA repair | 37/6293 | 73/18723 | 1.89e-03 | 9.24e-03 | 37 |
| Page: 1 2 3 4 5 6 7 8 9 10 11 12 13 14 15 16 17 18 19 20 21 22 23 |
| Pathway ID | Tissue | Disease Stage | Description | Gene Ratio | Bg Ratio | pvalue | p.adjust | qvalue | Count |
| hsa043306 | Esophagus | ESCC | Notch signaling pathway | 42/4205 | 62/8465 | 2.97e-03 | 7.97e-03 | 4.08e-03 | 42 |
| hsa0433013 | Esophagus | ESCC | Notch signaling pathway | 42/4205 | 62/8465 | 2.97e-03 | 7.97e-03 | 4.08e-03 | 42 |
| hsa043305 | Oral cavity | OSCC | Notch signaling pathway | 44/3704 | 62/8465 | 1.26e-05 | 5.55e-05 | 2.83e-05 | 44 |
| hsa0433012 | Oral cavity | OSCC | Notch signaling pathway | 44/3704 | 62/8465 | 1.26e-05 | 5.55e-05 | 2.83e-05 | 44 |
| Page: 1 |
Top |
Cell-cell communication analysis |
| Identification of potential cell-cell interactions between two cell types and their ligand-receptor pairs for different disease states |
| Ligand | Receptor | LRpair | Pathway | Tissue | Disease Stage |
| Page: 1 |
Top |
Single-cell gene regulatory network inference analysis |
| Find out the significant the regulons (TFs) and the target genes of each regulon across cell types for different disease states |
| TF | Cell Type | Tissue | Disease Stage | Target Gene | RSS | Regulon Activity |
| ∗The dot plots of a searched regulon are shown for all cell subpopulations in each disease state of each tissue based on the regulon specific score inferred using pySCENIC and by calculating the average expression. |
| Page: 1 |
Top |
Somatic mutation of malignant transformation related genes |
| Annotation of somatic variants for genes involved in malignant transformation |
| Hugo Symbol | Variant Class | Variant Classification | dbSNP RS | HGVSc | HGVSp | HGVSp Short | SWISSPROT | BIOTYPE | SIFT | PolyPhen | Tumor Sample Barcode | Tissue | Histology | Sex | Age | Stage | Therapy Types | Drugs | Outcome |
| DTX3 | SNV | Missense_Mutation | rs542699703 | c.130N>T | p.Arg44Trp | p.R44W | Q8N9I9 | protein_coding | tolerated(0.13) | benign(0.003) | TCGA-AN-A046-01 | Breast | breast invasive carcinoma | Female | >=65 | I/II | Unknown | Unknown | SD |
| DTX3 | SNV | Missense_Mutation | c.217N>A | p.Ala73Thr | p.A73T | Q8N9I9 | protein_coding | tolerated(0.34) | benign(0.034) | TCGA-BH-A18G-01 | Breast | breast invasive carcinoma | Female | >=65 | I/II | Unknown | Unknown | SD | |
| DTX3 | SNV | Missense_Mutation | c.829N>A | p.Glu277Lys | p.E277K | Q8N9I9 | protein_coding | deleterious(0.02) | benign(0.149) | TCGA-E2-A1IN-01 | Breast | breast invasive carcinoma | Female | <65 | I/II | Hormone Therapy | arimidex | SD | |
| DTX3 | SNV | Missense_Mutation | c.620N>A | p.Arg207His | p.R207H | Q8N9I9 | protein_coding | deleterious(0.03) | benign(0.013) | TCGA-2W-A8YY-01 | Cervix | cervical & endocervical cancer | Female | <65 | I/II | Chemotherapy | cisplatin | CR | |
| DTX3 | SNV | Missense_Mutation | novel | c.869N>G | p.Asp290Gly | p.D290G | Q8N9I9 | protein_coding | deleterious(0.01) | possibly_damaging(0.692) | TCGA-2W-A8YY-01 | Cervix | cervical & endocervical cancer | Female | <65 | I/II | Chemotherapy | cisplatin | CR |
| DTX3 | SNV | Missense_Mutation | rs746868676 | c.682G>A | p.Ala228Thr | p.A228T | Q8N9I9 | protein_coding | tolerated(0.42) | benign(0.04) | TCGA-EA-A3HU-01 | Cervix | cervical & endocervical cancer | Female | <65 | I/II | Unknown | Unknown | SD |
| DTX3 | SNV | Missense_Mutation | rs752141567 | c.460N>T | p.Pro154Ser | p.P154S | Q8N9I9 | protein_coding | tolerated(1) | possibly_damaging(0.448) | TCGA-AY-6196-01 | Colorectum | colon adenocarcinoma | Male | <65 | III/IV | Unknown | Unknown | SD |
| DTX3 | SNV | Missense_Mutation | rs201091006 | c.736G>A | p.Val246Ile | p.V246I | Q8N9I9 | protein_coding | tolerated(0.4) | benign(0.021) | TCGA-CK-4951-01 | Colorectum | colon adenocarcinoma | Female | >=65 | I/II | Unknown | Unknown | PD |
| DTX3 | SNV | Missense_Mutation | rs201091006 | c.736N>A | p.Val246Ile | p.V246I | Q8N9I9 | protein_coding | tolerated(0.4) | benign(0.021) | TCGA-DM-A1HB-01 | Colorectum | colon adenocarcinoma | Male | >=65 | III/IV | Unknown | Unknown | SD |
| DTX3 | SNV | Missense_Mutation | c.166N>A | p.Glu56Lys | p.E56K | Q8N9I9 | protein_coding | tolerated(0.13) | probably_damaging(0.982) | TCGA-AG-A002-01 | Colorectum | rectum adenocarcinoma | Male | <65 | I/II | Unknown | Unknown | SD |
| Page: 1 2 3 4 5 6 |
Top |
Related drugs of malignant transformation related genes |
| Identification of chemicals and drugs interact with genes involved in malignant transfromation |
| (DGIdb 4.0) |
| Entrez ID | Symbol | Category | Interaction Types | Drug Claim Name | Drug Name | PMIDs |
| Page: 1 |

Copyright 2023-Present -The University of Texas Health Science Center at Houston |