
|
|||||
|
 | |
| |
| |
| |
| |
| |
|
Gene: DSP |
Gene summary for DSP |
| Gene information | Species | Human | Gene symbol | DSP | Gene ID | 1832 |
| Gene name | desmoplakin | |
| Gene Alias | DCWHKTA | |
| Cytomap | 6p24.3 | |
| Gene Type | protein-coding | GO ID | GO:0001508 | UniProtAcc | B4DKX6 |
Top |
Malignant transformation analysis |
| Identification of the aberrant gene expression in precancerous and cancerous lesions by comparing the gene expression of stem-like cells in diseased tissues with normal stem cells |
| Entrez ID | Symbol | Replicates | Species | Organ | Tissue | Adj P-value | Log2FC | Malignancy |
| 1832 | DSP | GSM4909282 | Human | Breast | IDC | 8.91e-04 | 3.32e-01 | -0.0288 |
| 1832 | DSP | GSM4909285 | Human | Breast | IDC | 4.85e-23 | 6.21e-01 | 0.21 |
| 1832 | DSP | GSM4909286 | Human | Breast | IDC | 1.56e-11 | 4.37e-01 | 0.1081 |
| 1832 | DSP | GSM4909293 | Human | Breast | IDC | 3.85e-47 | 8.59e-01 | 0.1581 |
| 1832 | DSP | GSM4909296 | Human | Breast | IDC | 2.09e-10 | -5.99e-02 | 0.1524 |
| 1832 | DSP | GSM4909297 | Human | Breast | IDC | 4.09e-14 | 5.84e-02 | 0.1517 |
| 1832 | DSP | GSM4909298 | Human | Breast | IDC | 2.03e-28 | 7.22e-01 | 0.1551 |
| 1832 | DSP | GSM4909303 | Human | Breast | IDC | 4.14e-02 | 3.78e-01 | 0.0438 |
| 1832 | DSP | GSM4909304 | Human | Breast | IDC | 5.66e-06 | 3.83e-01 | 0.1636 |
| 1832 | DSP | GSM4909306 | Human | Breast | IDC | 2.62e-05 | 4.26e-01 | 0.1564 |
| 1832 | DSP | GSM4909307 | Human | Breast | IDC | 1.00e-11 | 5.19e-01 | 0.1569 |
| 1832 | DSP | GSM4909308 | Human | Breast | IDC | 1.03e-41 | 7.82e-01 | 0.158 |
| 1832 | DSP | GSM4909309 | Human | Breast | IDC | 2.35e-02 | 1.91e-01 | 0.0483 |
| 1832 | DSP | GSM4909311 | Human | Breast | IDC | 7.71e-30 | -6.88e-02 | 0.1534 |
| 1832 | DSP | GSM4909312 | Human | Breast | IDC | 1.71e-04 | -5.47e-02 | 0.1552 |
| 1832 | DSP | GSM4909313 | Human | Breast | IDC | 4.61e-04 | 1.27e-01 | 0.0391 |
| 1832 | DSP | GSM4909315 | Human | Breast | IDC | 5.37e-10 | 3.70e-01 | 0.21 |
| 1832 | DSP | GSM4909317 | Human | Breast | IDC | 9.31e-09 | 4.40e-01 | 0.1355 |
| 1832 | DSP | GSM4909319 | Human | Breast | IDC | 1.84e-33 | -5.20e-01 | 0.1563 |
| 1832 | DSP | GSM4909320 | Human | Breast | IDC | 1.75e-04 | -3.53e-01 | 0.1575 |
| Page: 1 2 3 4 5 6 7 8 9 10 11 12 13 14 15 |
| Tissue | Expression Dynamics | Abbreviation |
| Breast | 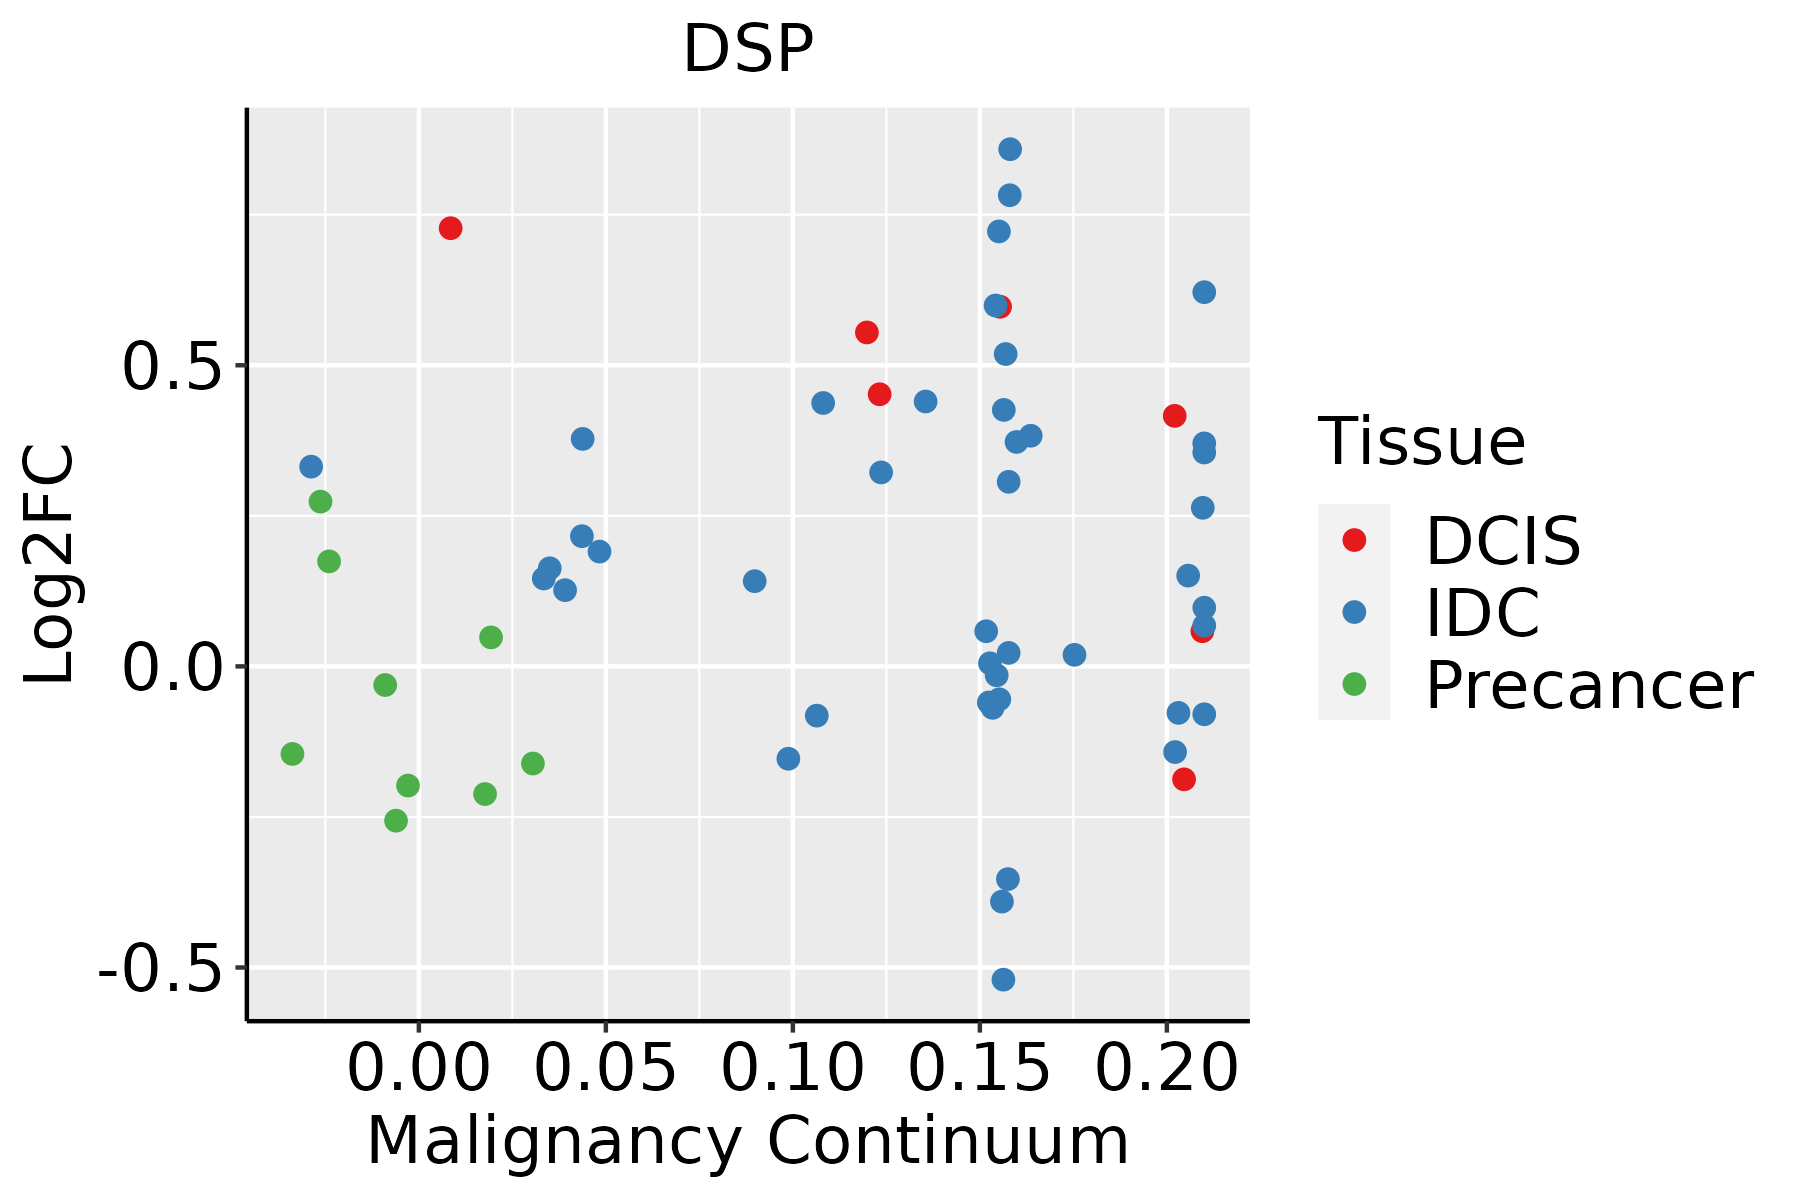 | IDC: Invasive ductal carcinoma |
| DCIS: Ductal carcinoma in situ | ||
| Precancer(BRCA1-mut): Precancerous lesion from BRCA1 mutation carriers | ||
| Cervix | 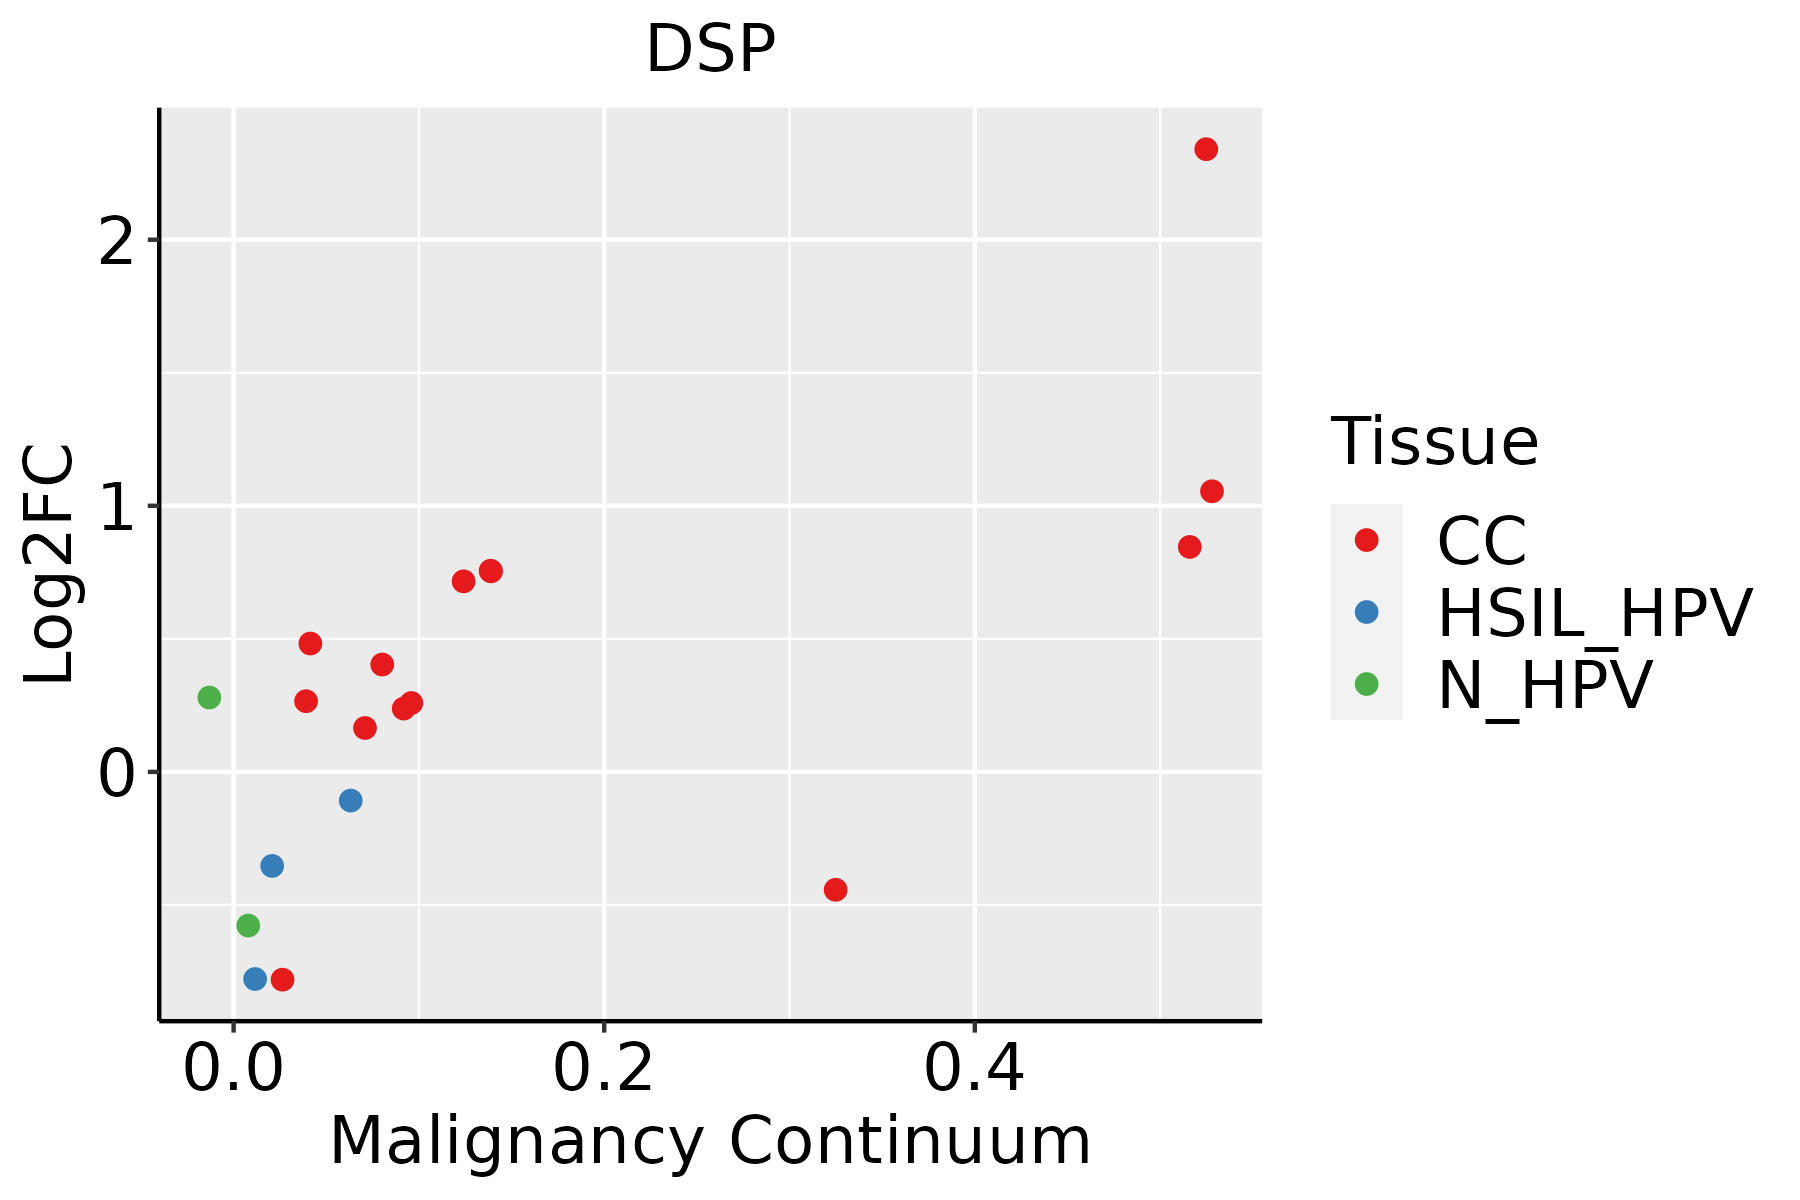 | CC: Cervix cancer |
| HSIL_HPV: HPV-infected high-grade squamous intraepithelial lesions | ||
| N_HPV: HPV-infected normal cervix | ||
| Colorectum (GSE201348) |  | FAP: Familial adenomatous polyposis |
| CRC: Colorectal cancer | ||
| Colorectum (HTA11) |  | AD: Adenomas |
| SER: Sessile serrated lesions | ||
| MSI-H: Microsatellite-high colorectal cancer | ||
| MSS: Microsatellite stable colorectal cancer | ||
| Endometrium | 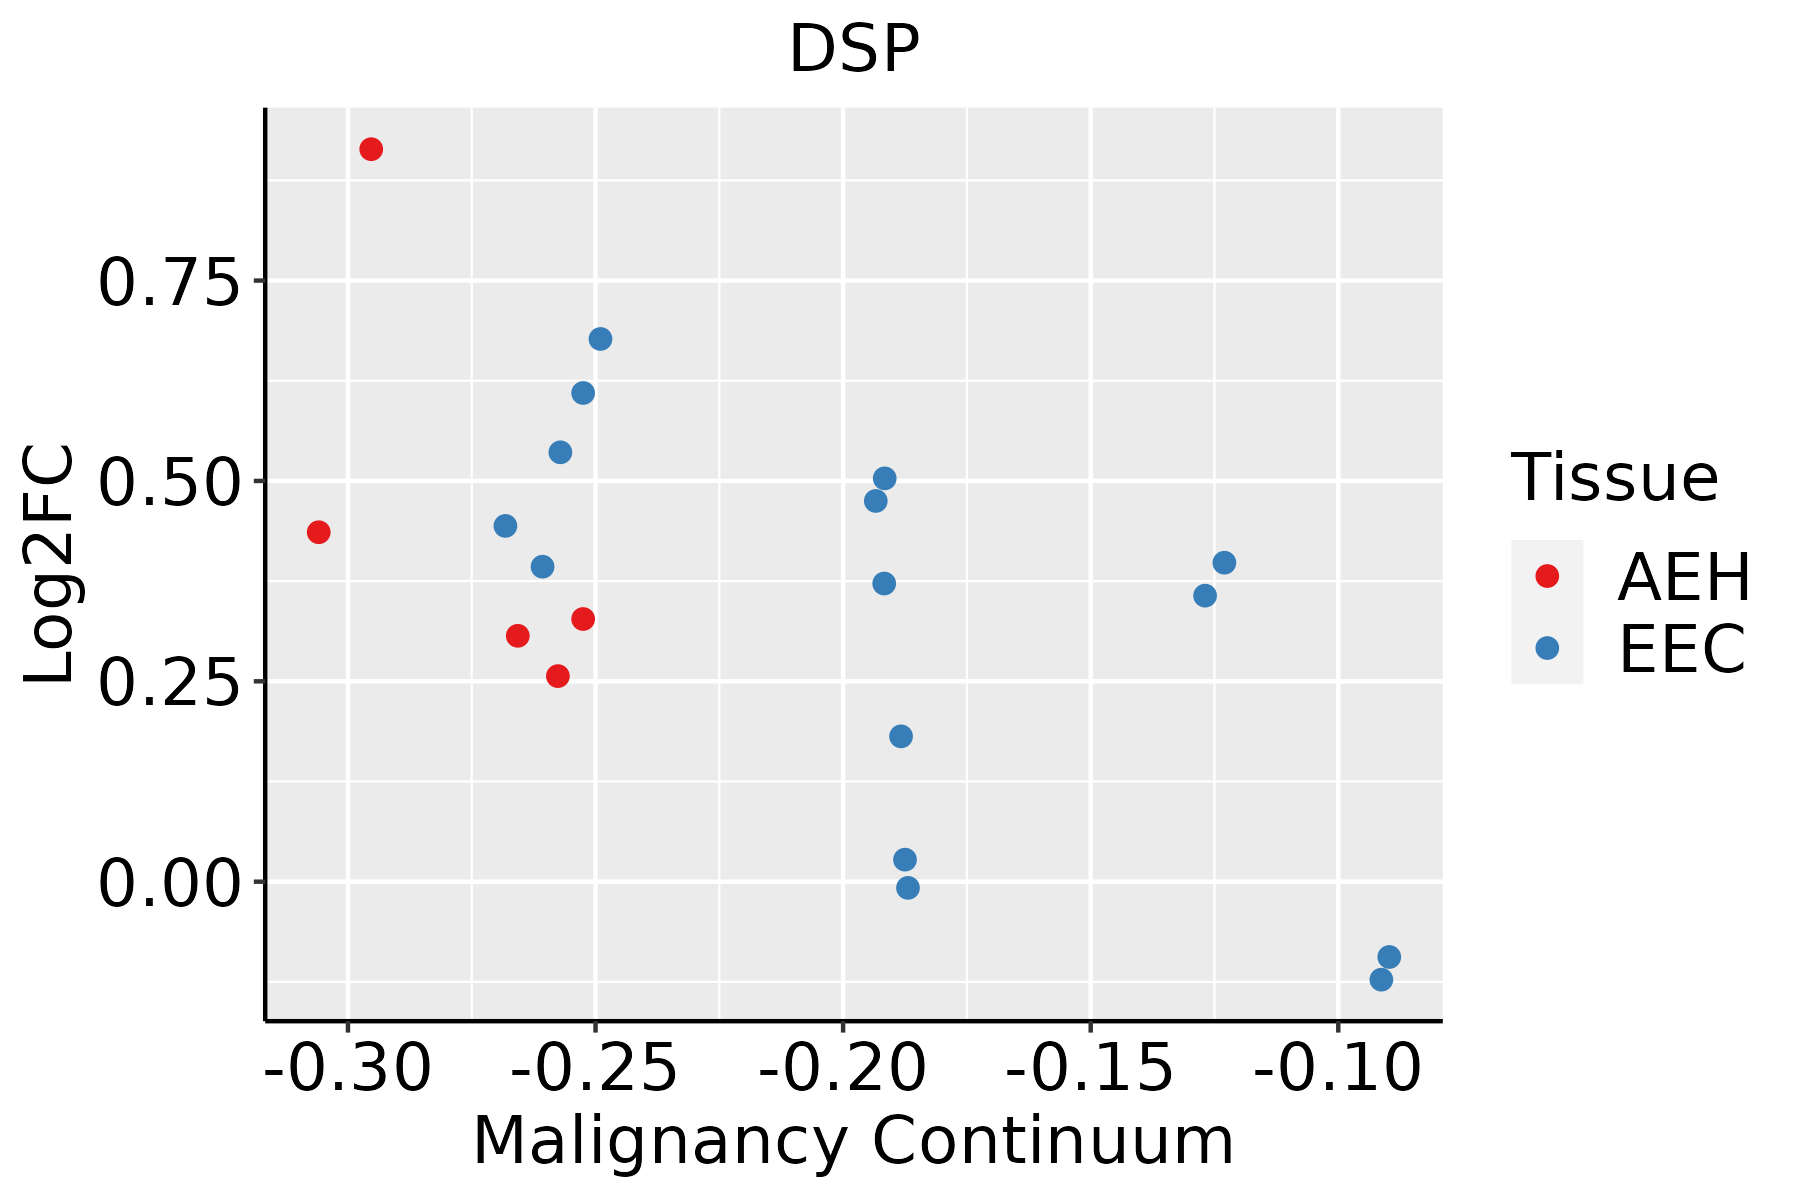 | AEH: Atypical endometrial hyperplasia |
| EEC: Endometrioid Cancer | ||
| Esophagus | 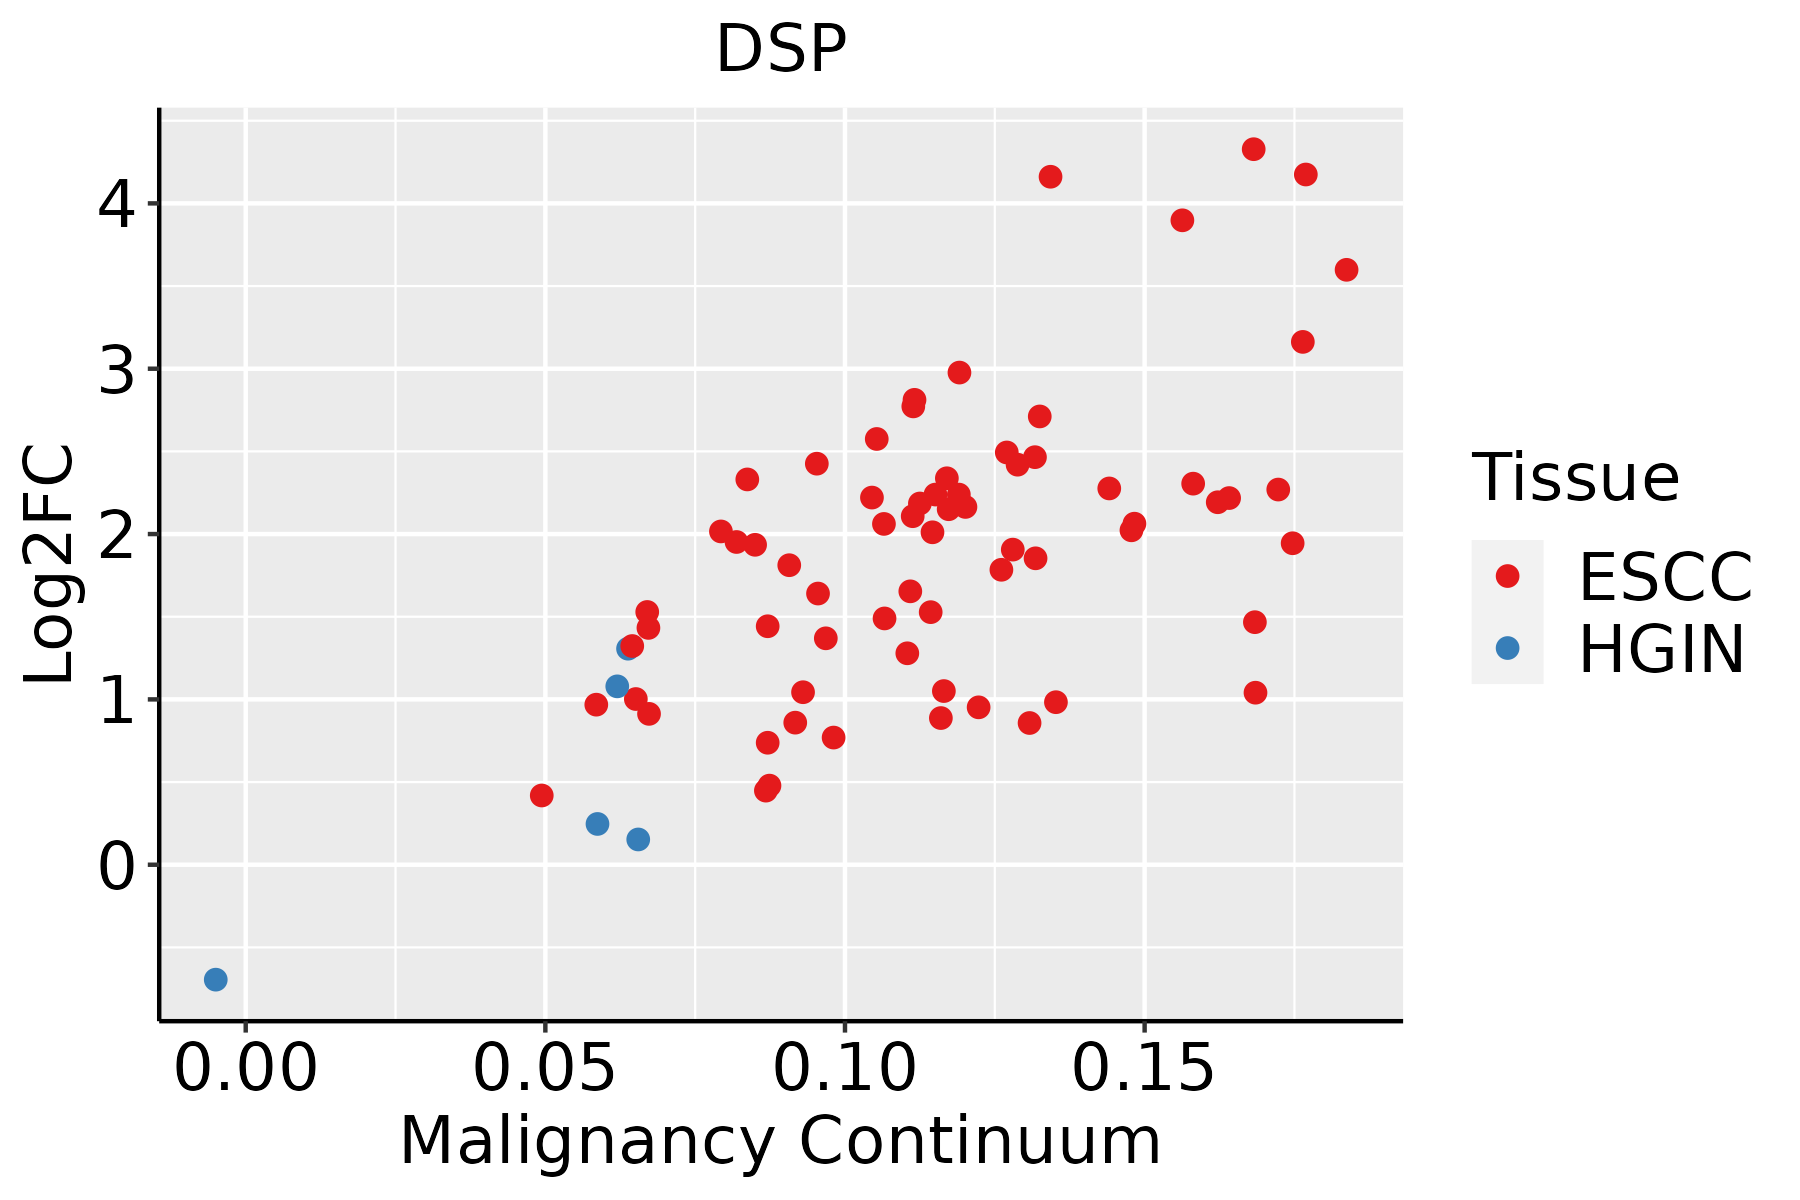 | ESCC: Esophageal squamous cell carcinoma |
| HGIN: High-grade intraepithelial neoplasias | ||
| LGIN: Low-grade intraepithelial neoplasias | ||
| Liver | 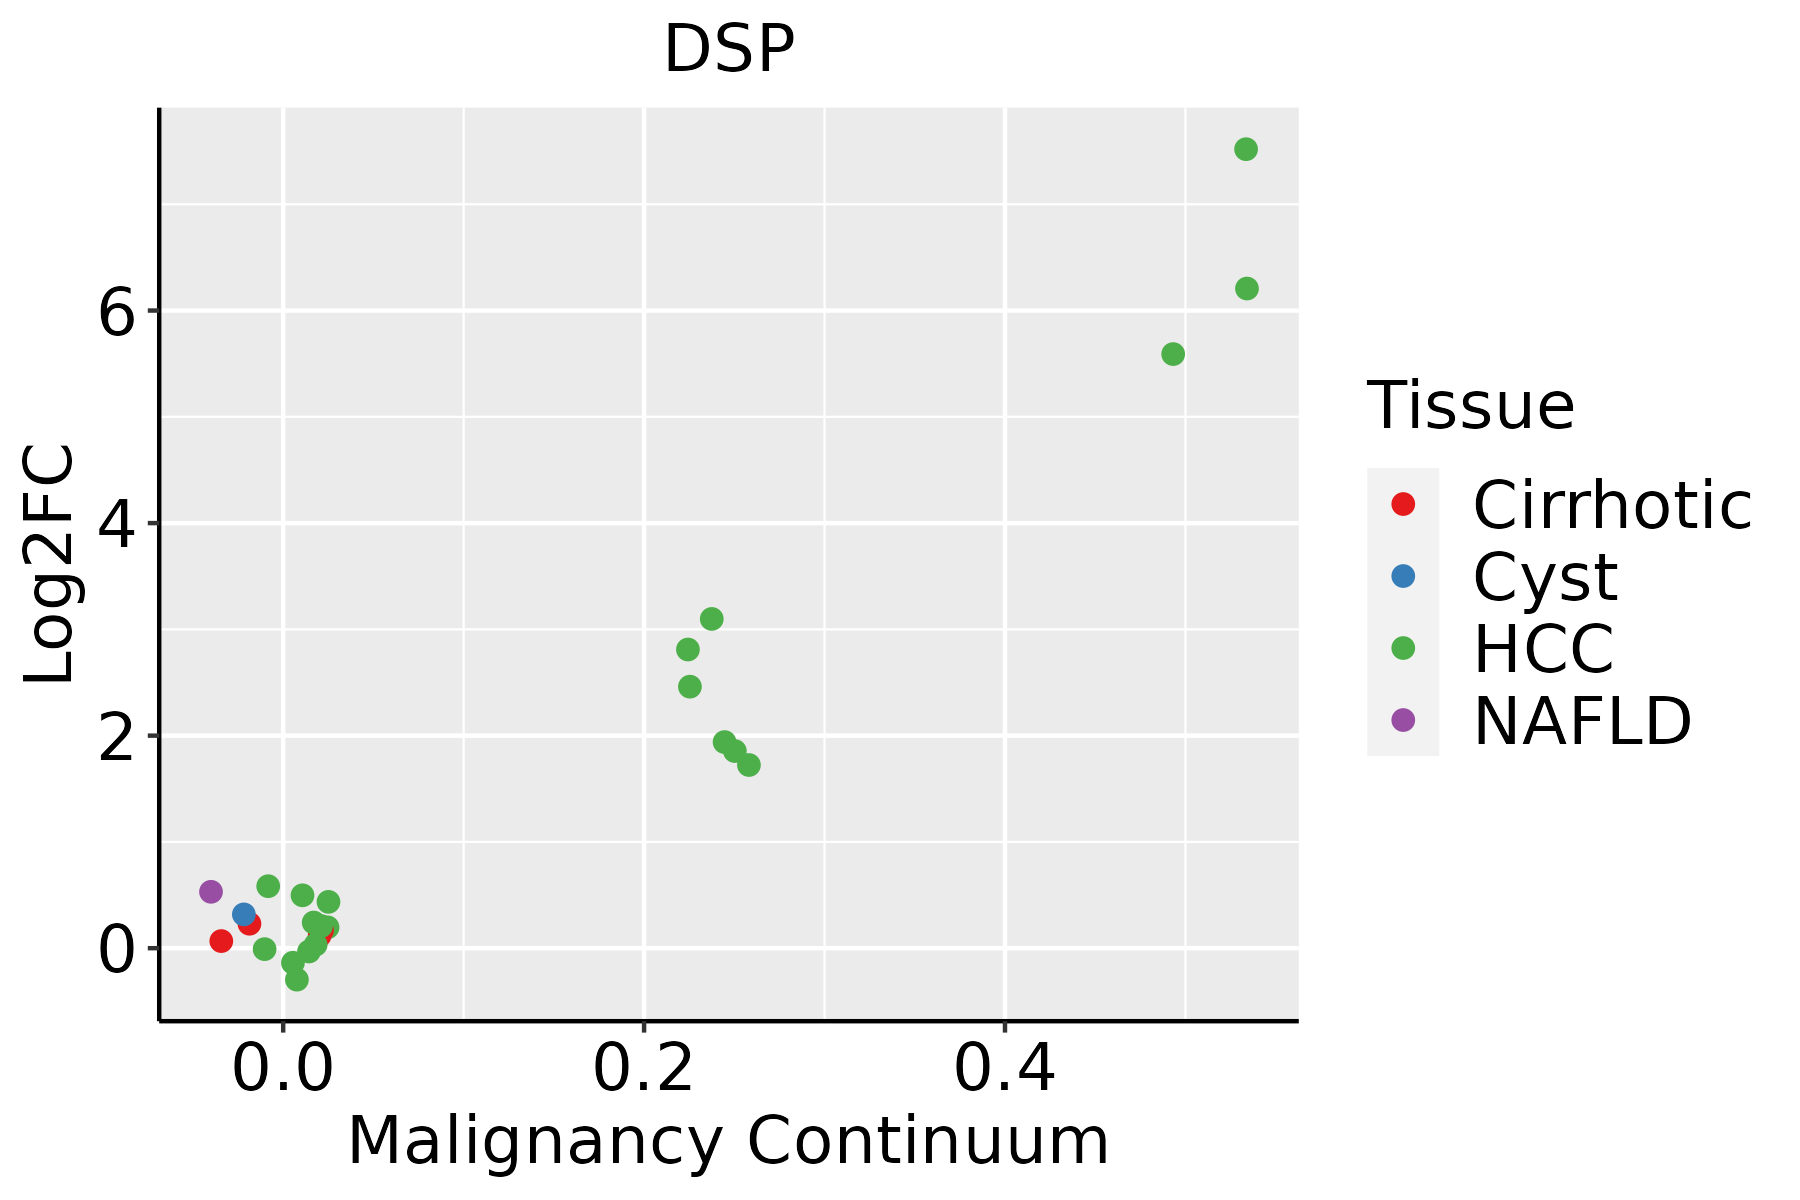 | HCC: Hepatocellular carcinoma |
| NAFLD: Non-alcoholic fatty liver disease | ||
| Lung | 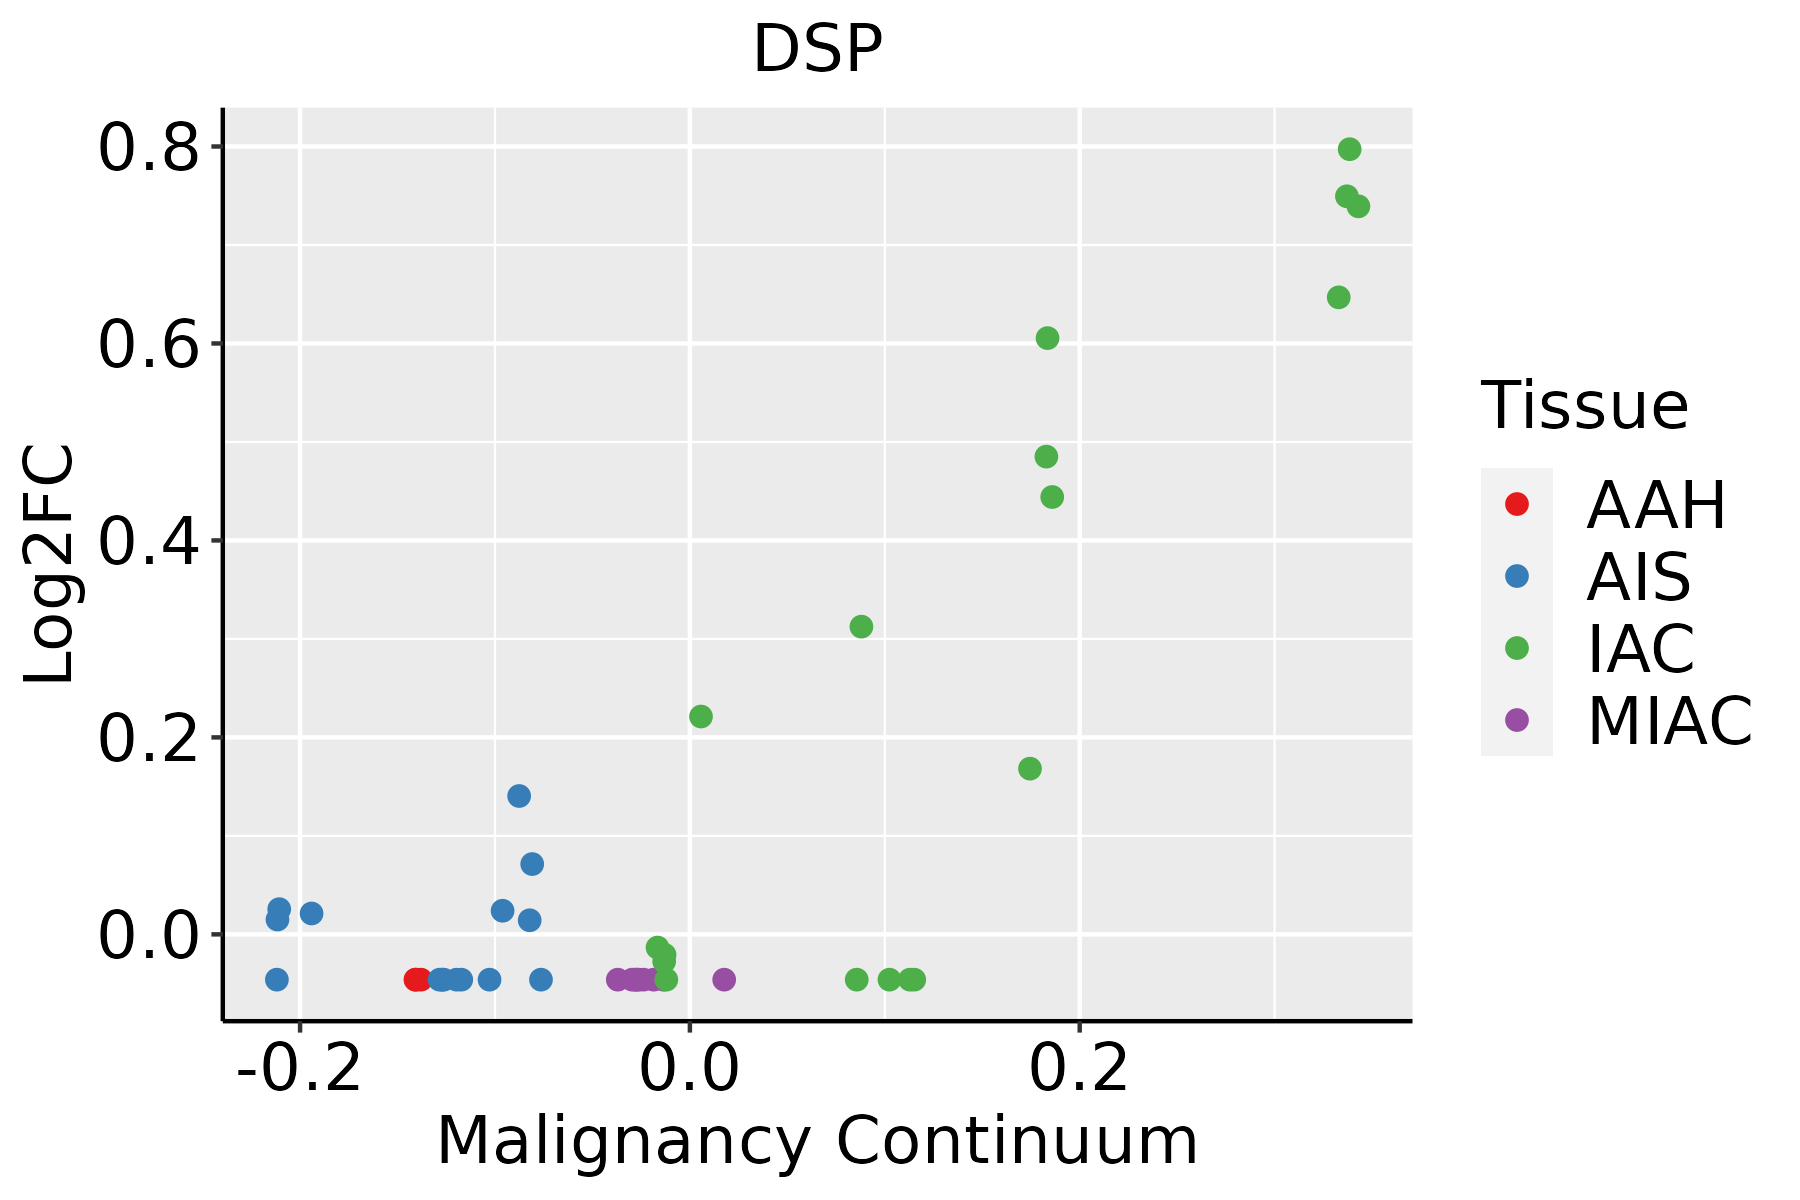 | AAH: Atypical adenomatous hyperplasia |
| AIS: Adenocarcinoma in situ | ||
| IAC: Invasive lung adenocarcinoma | ||
| MIA: Minimally invasive adenocarcinoma | ||
| Oral Cavity | 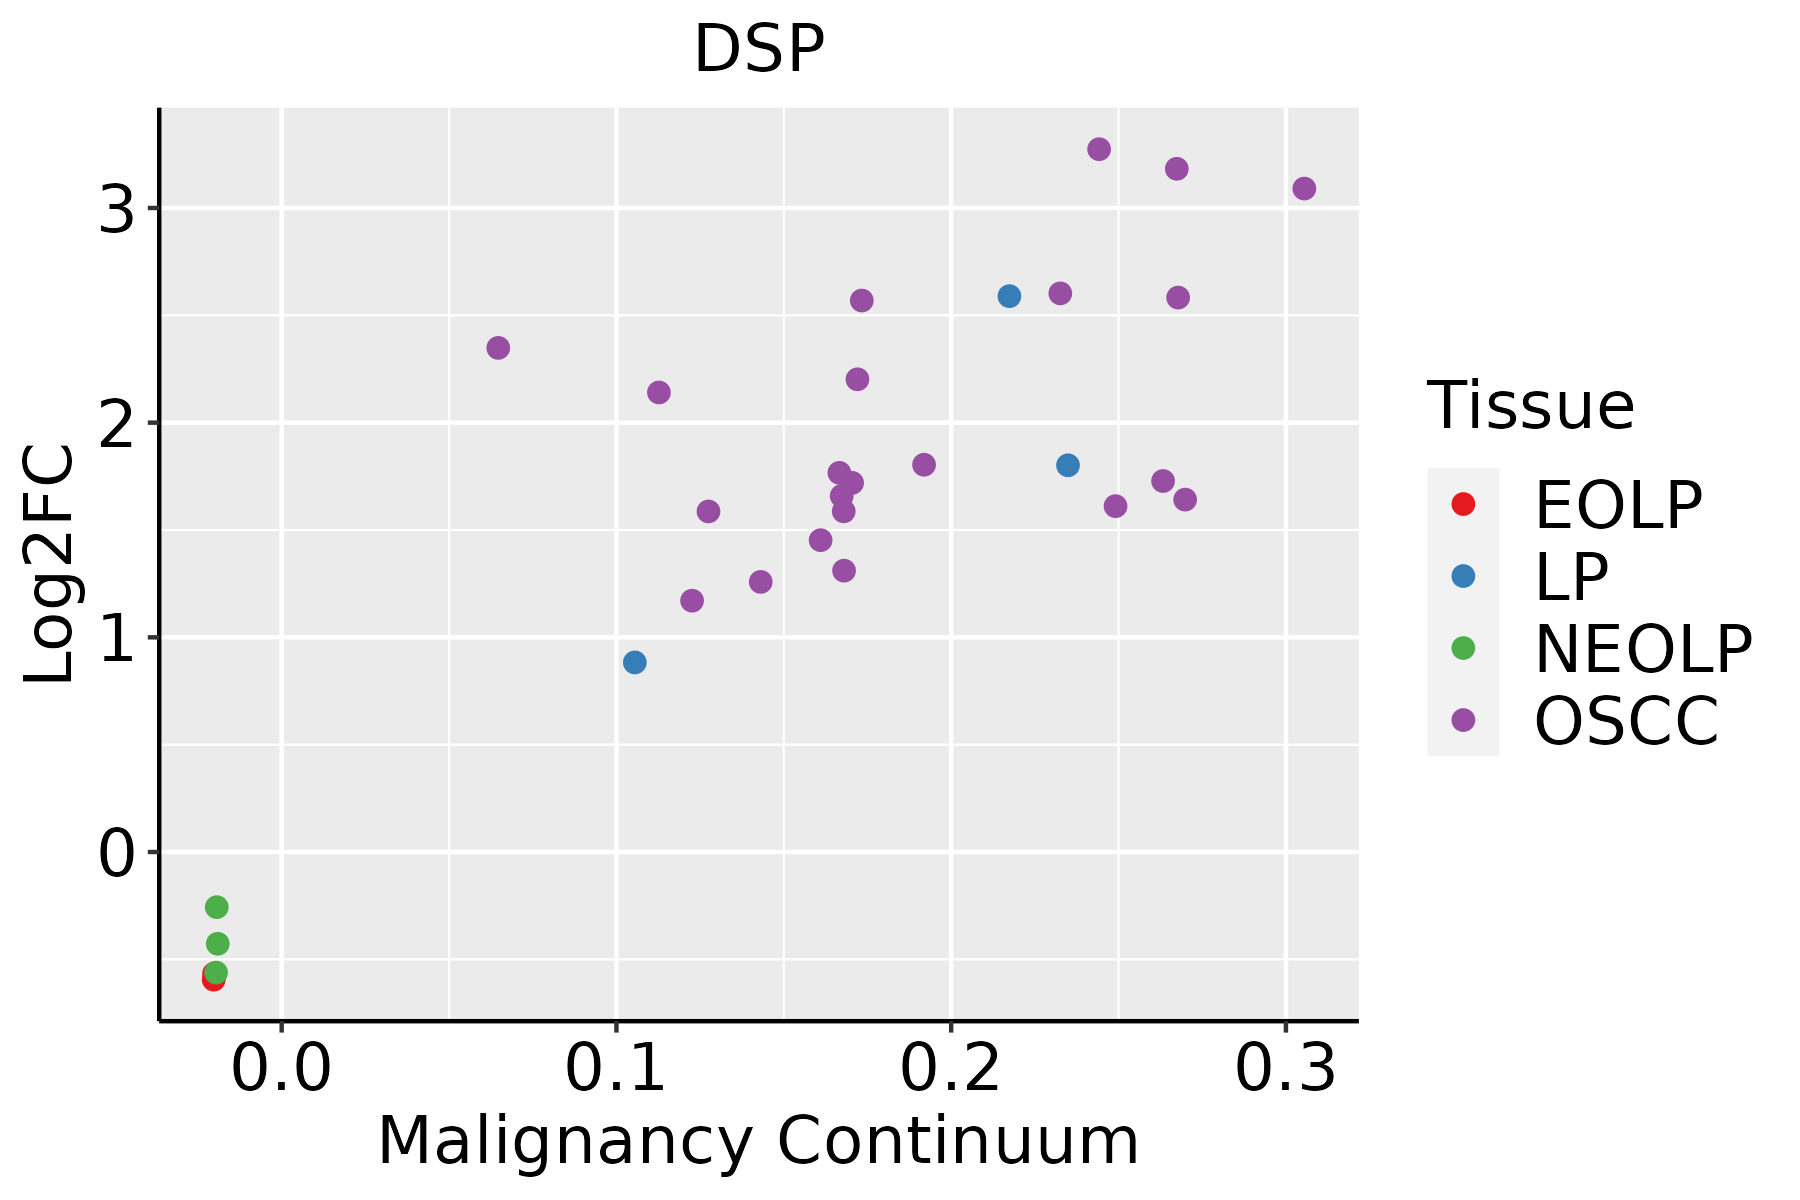 | EOLP: Erosive Oral lichen planus |
| LP: leukoplakia | ||
| NEOLP: Non-erosive oral lichen planus | ||
| OSCC: Oral squamous cell carcinoma | ||
| Prostate | 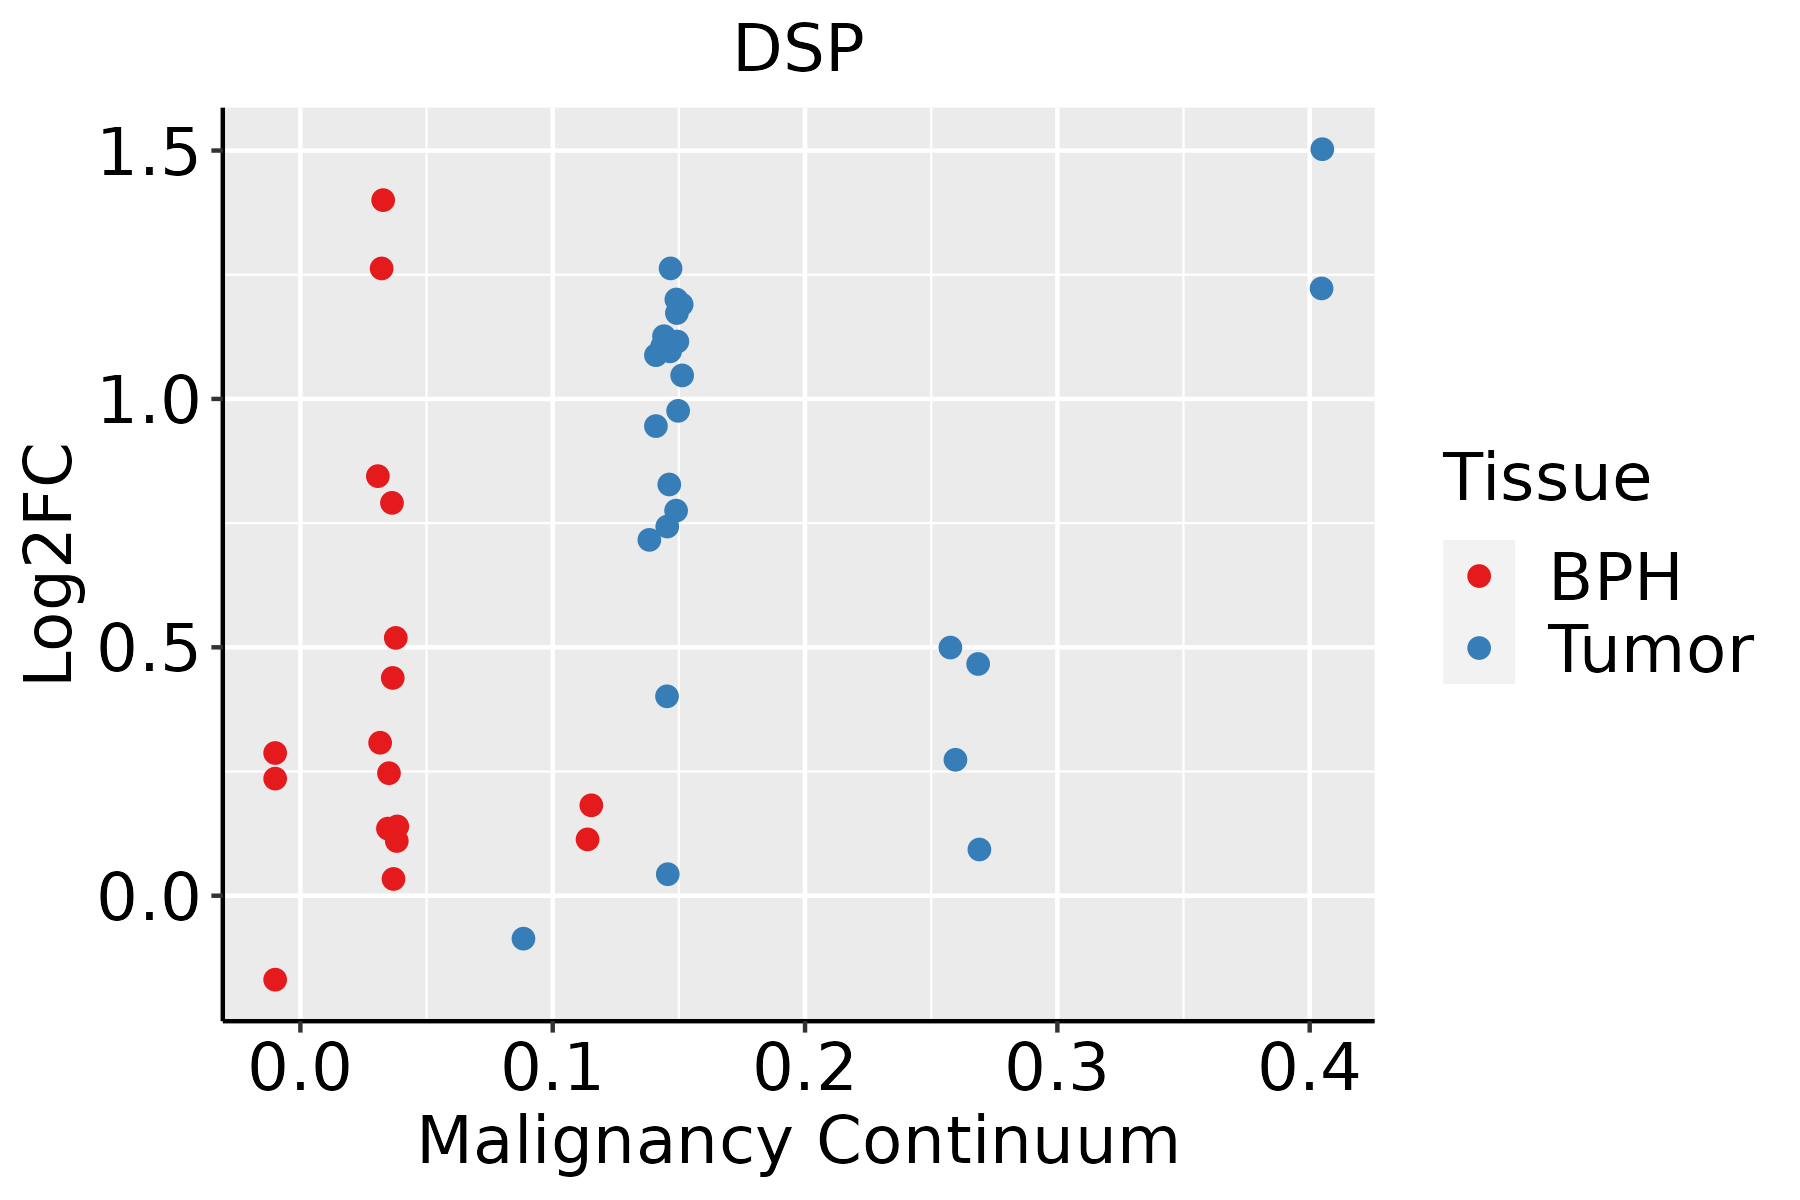 | BPH: Benign Prostatic Hyperplasia |
| Skin |  | AK: Actinic keratosis |
| cSCC: Cutaneous squamous cell carcinoma | ||
| SCCIS:squamous cell carcinoma in situ | ||
| Thyroid | 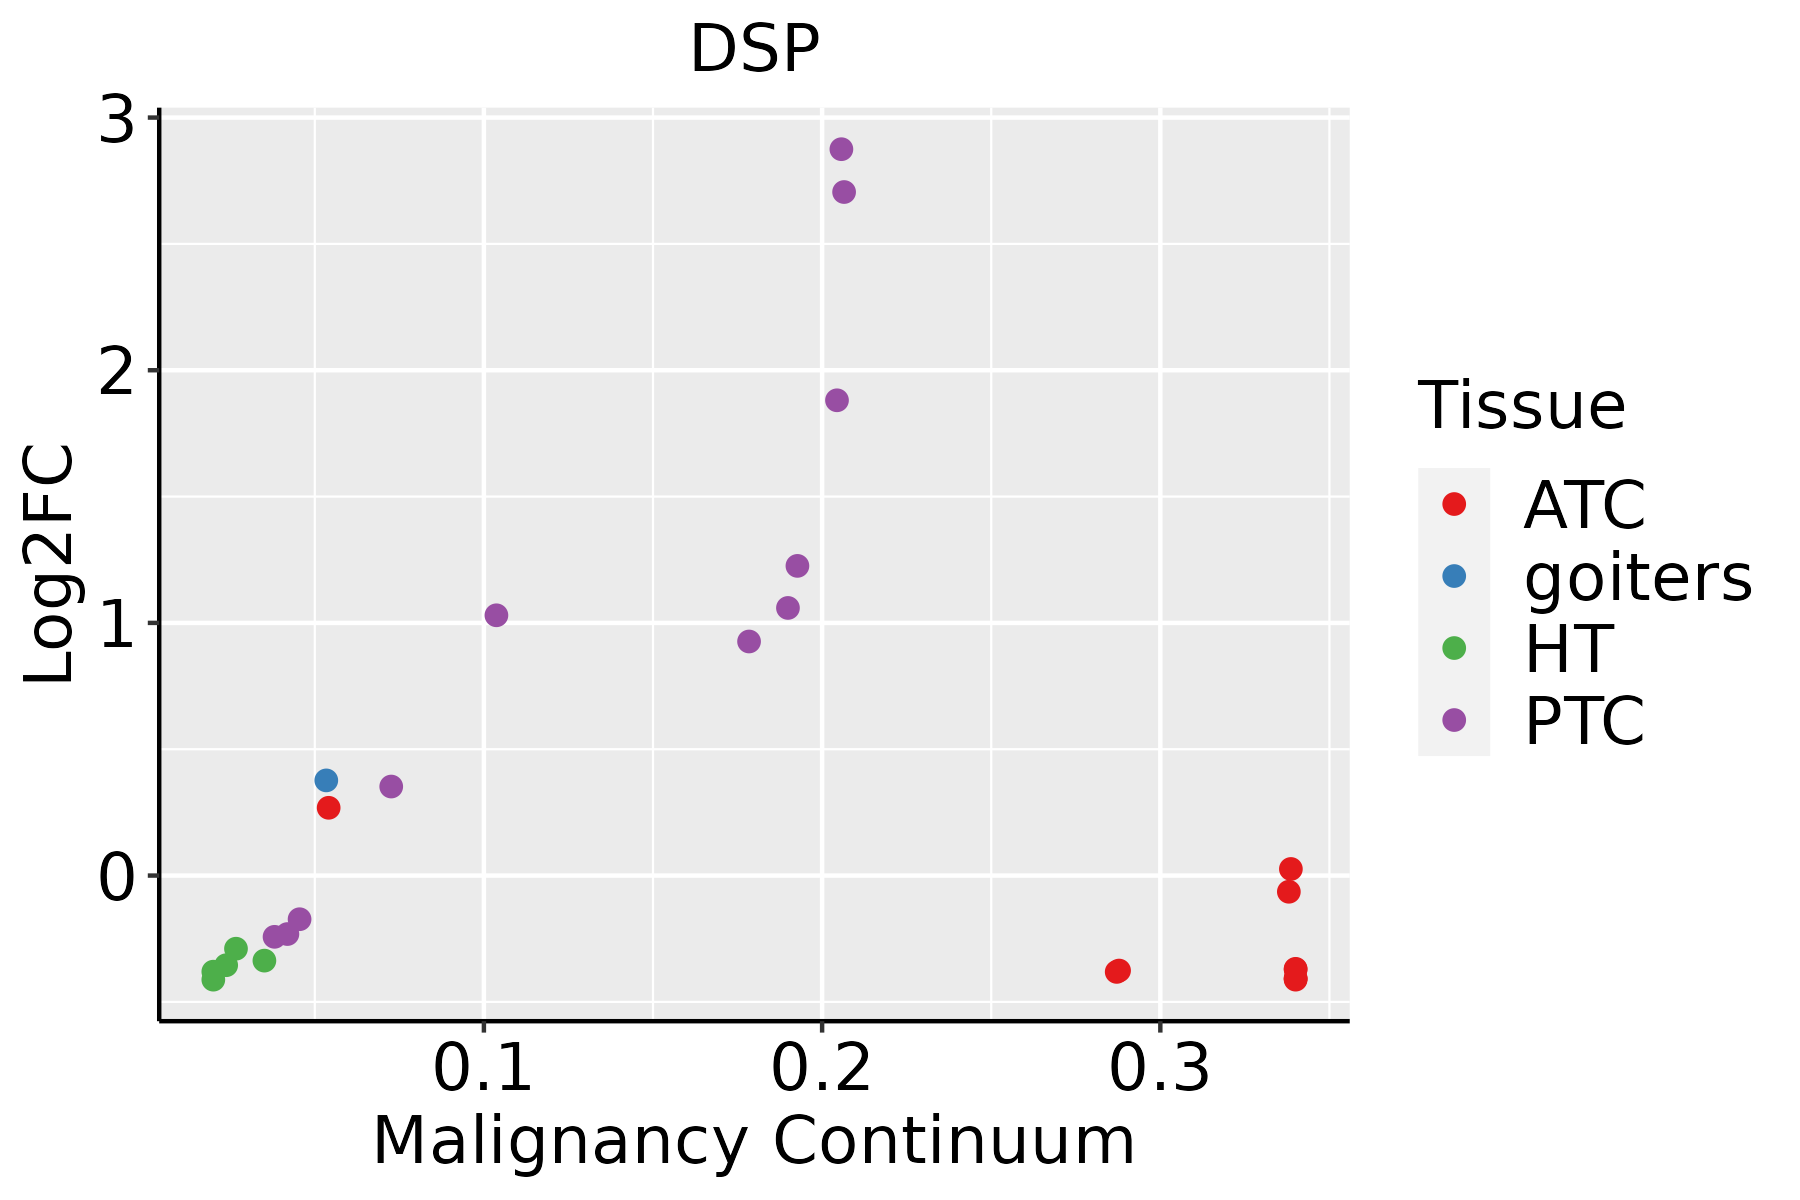 | ATC: Anaplastic thyroid cancer |
| HT: Hashimoto's thyroiditis | ||
| PTC: Papillary thyroid cancer |
| ∗log2FC in expression of this searched gene in stem-like cells from each diseased tissue sample relative to stem-like cells in normal samples in each tissue plotted against the malignancy continuum. Samples are colored based on if they are from different disease stage. |
Top |
Malignant transformation related pathway analysis |
| Find out the enriched GO biological processes and KEGG pathways involved in transition from healthy to precancer to cancer |
| Tissue | Disease Stage | Enriched GO biological Processes |
| Colorectum | AD |  |
| Colorectum | SER |  |
| Colorectum | MSS |  |
| Colorectum | MSI-H |  |
| Colorectum | FAP |  |
| ∗Top 15 enriched GO BP terms are showed in the bar plot of each disease state in each tissue. Each row represents a significant GO biological process which is colored according to the -log10(p.adjust). |
| Page: 1 2 3 4 5 6 7 8 9 |
| GO ID | Tissue | Disease Stage | Description | Gene Ratio | Bg Ratio | pvalue | p.adjust | Count |
| GO:190199013 | Esophagus | ESCC | regulation of mitotic cell cycle phase transition | 191/8552 | 299/18723 | 1.35e-10 | 3.94e-09 | 191 |
| GO:0042326111 | Esophagus | ESCC | negative regulation of phosphorylation | 237/8552 | 385/18723 | 1.86e-10 | 5.33e-09 | 237 |
| GO:0001933111 | Esophagus | ESCC | negative regulation of protein phosphorylation | 213/8552 | 342/18723 | 3.54e-10 | 9.76e-09 | 213 |
| GO:00457865 | Esophagus | ESCC | negative regulation of cell cycle | 236/8552 | 385/18723 | 3.62e-10 | 9.93e-09 | 236 |
| GO:004682417 | Esophagus | ESCC | positive regulation of nucleocytoplasmic transport | 52/8552 | 62/18723 | 5.40e-10 | 1.38e-08 | 52 |
| GO:001631110 | Esophagus | ESCC | dephosphorylation | 251/8552 | 417/18723 | 1.26e-09 | 2.99e-08 | 251 |
| GO:000661117 | Esophagus | ESCC | protein export from nucleus | 48/8552 | 57/18723 | 1.92e-09 | 4.39e-08 | 48 |
| GO:000647018 | Esophagus | ESCC | protein dephosphorylation | 177/8552 | 281/18723 | 3.13e-09 | 6.72e-08 | 177 |
| GO:00435888 | Esophagus | ESCC | skin development | 163/8552 | 263/18723 | 6.48e-08 | 1.14e-06 | 163 |
| GO:000854410 | Esophagus | ESCC | epidermis development | 193/8552 | 324/18723 | 2.87e-07 | 4.19e-06 | 193 |
| GO:0032970111 | Esophagus | ESCC | regulation of actin filament-based process | 231/8552 | 397/18723 | 2.91e-07 | 4.20e-06 | 231 |
| GO:00109484 | Esophagus | ESCC | negative regulation of cell cycle process | 177/8552 | 294/18723 | 3.26e-07 | 4.59e-06 | 177 |
| GO:000008214 | Esophagus | ESCC | G1/S transition of mitotic cell cycle | 134/8552 | 214/18723 | 4.04e-07 | 5.55e-06 | 134 |
| GO:004206027 | Esophagus | ESCC | wound healing | 243/8552 | 422/18723 | 4.62e-07 | 6.25e-06 | 243 |
| GO:004484314 | Esophagus | ESCC | cell cycle G1/S phase transition | 148/8552 | 241/18723 | 5.68e-07 | 7.48e-06 | 148 |
| GO:19019883 | Esophagus | ESCC | negative regulation of cell cycle phase transition | 151/8552 | 249/18723 | 1.28e-06 | 1.57e-05 | 151 |
| GO:004593013 | Esophagus | ESCC | negative regulation of mitotic cell cycle | 143/8552 | 235/18723 | 1.84e-06 | 2.15e-05 | 143 |
| GO:190199113 | Esophagus | ESCC | negative regulation of mitotic cell cycle phase transition | 112/8552 | 179/18723 | 3.69e-06 | 4.03e-05 | 112 |
| GO:0046825110 | Esophagus | ESCC | regulation of protein export from nucleus | 26/8552 | 30/18723 | 3.79e-06 | 4.12e-05 | 26 |
| GO:000991310 | Esophagus | ESCC | epidermal cell differentiation | 122/8552 | 202/18723 | 1.69e-05 | 1.51e-04 | 122 |
| Page: 1 2 3 4 5 6 7 8 9 10 11 12 13 14 15 16 17 18 19 20 21 22 23 24 25 26 27 28 29 30 31 32 33 34 35 36 37 38 39 40 41 42 43 44 45 46 47 48 49 50 51 52 53 54 |
| Pathway ID | Tissue | Disease Stage | Description | Gene Ratio | Bg Ratio | pvalue | p.adjust | qvalue | Count |
| hsa054127 | Cervix | HSIL_HPV | Arrhythmogenic right ventricular cardiomyopathy | 10/459 | 77/8465 | 8.34e-03 | 4.70e-02 | 3.80e-02 | 10 |
| hsa0541212 | Cervix | HSIL_HPV | Arrhythmogenic right ventricular cardiomyopathy | 10/459 | 77/8465 | 8.34e-03 | 4.70e-02 | 3.80e-02 | 10 |
| hsa05412 | Colorectum | FAP | Arrhythmogenic right ventricular cardiomyopathy | 23/1404 | 77/8465 | 2.58e-03 | 1.19e-02 | 7.23e-03 | 23 |
| hsa054121 | Colorectum | FAP | Arrhythmogenic right ventricular cardiomyopathy | 23/1404 | 77/8465 | 2.58e-03 | 1.19e-02 | 7.23e-03 | 23 |
| hsa054122 | Colorectum | CRC | Arrhythmogenic right ventricular cardiomyopathy | 18/1091 | 77/8465 | 7.90e-03 | 3.77e-02 | 2.55e-02 | 18 |
| hsa054123 | Colorectum | CRC | Arrhythmogenic right ventricular cardiomyopathy | 18/1091 | 77/8465 | 7.90e-03 | 3.77e-02 | 2.55e-02 | 18 |
| hsa054126 | Lung | IAC | Arrhythmogenic right ventricular cardiomyopathy | 22/1053 | 77/8465 | 1.15e-04 | 1.49e-03 | 9.88e-04 | 22 |
| hsa0541211 | Lung | IAC | Arrhythmogenic right ventricular cardiomyopathy | 22/1053 | 77/8465 | 1.15e-04 | 1.49e-03 | 9.88e-04 | 22 |
| Page: 1 |
Top |
Cell-cell communication analysis |
| Identification of potential cell-cell interactions between two cell types and their ligand-receptor pairs for different disease states |
| Ligand | Receptor | LRpair | Pathway | Tissue | Disease Stage |
| Page: 1 |
Top |
Single-cell gene regulatory network inference analysis |
| Find out the significant the regulons (TFs) and the target genes of each regulon across cell types for different disease states |
| TF | Cell Type | Tissue | Disease Stage | Target Gene | RSS | Regulon Activity |
| ∗The dot plots of a searched regulon are shown for all cell subpopulations in each disease state of each tissue based on the regulon specific score inferred using pySCENIC and by calculating the average expression. |
| Page: 1 |
Top |
Somatic mutation of malignant transformation related genes |
| Annotation of somatic variants for genes involved in malignant transformation |
| Hugo Symbol | Variant Class | Variant Classification | dbSNP RS | HGVSc | HGVSp | HGVSp Short | SWISSPROT | BIOTYPE | SIFT | PolyPhen | Tumor Sample Barcode | Tissue | Histology | Sex | Age | Stage | Therapy Types | Drugs | Outcome |
| DSP | SNV | Missense_Mutation | rs778068911 | c.7374G>T | p.Lys2458Asn | p.K2458N | P15924 | protein_coding | deleterious(0.01) | possibly_damaging(0.903) | TCGA-AN-A046-01 | Breast | breast invasive carcinoma | Female | >=65 | I/II | Unknown | Unknown | SD |
| DSP | SNV | Missense_Mutation | novel | c.7565G>A | p.Arg2522Lys | p.R2522K | P15924 | protein_coding | tolerated(0.08) | probably_damaging(0.978) | TCGA-AN-A046-01 | Breast | breast invasive carcinoma | Female | >=65 | I/II | Unknown | Unknown | SD |
| DSP | SNV | Missense_Mutation | c.8242G>A | p.Glu2748Lys | p.E2748K | P15924 | protein_coding | deleterious(0.01) | probably_damaging(0.992) | TCGA-AN-A046-01 | Breast | breast invasive carcinoma | Female | >=65 | I/II | Unknown | Unknown | SD | |
| DSP | SNV | Missense_Mutation | c.2756A>T | p.Asp919Val | p.D919V | P15924 | protein_coding | deleterious(0) | possibly_damaging(0.541) | TCGA-AO-A0JD-01 | Breast | breast invasive carcinoma | Female | <65 | III/IV | Chemotherapy | cyclophosphamide | SD | |
| DSP | SNV | Missense_Mutation | c.8198C>A | p.Thr2733Lys | p.T2733K | P15924 | protein_coding | deleterious(0) | probably_damaging(1) | TCGA-B6-A0RS-01 | Breast | breast invasive carcinoma | Female | <65 | I/II | Unknown | Unknown | PD | |
| DSP | SNV | Missense_Mutation | c.4924N>A | p.Gly1642Ser | p.G1642S | P15924 | protein_coding | tolerated(0.53) | benign(0.006) | TCGA-BH-A0HF-01 | Breast | breast invasive carcinoma | Female | >=65 | I/II | Hormone Therapy | arimidex | SD | |
| DSP | SNV | Missense_Mutation | novel | c.5191N>C | p.Tyr1731His | p.Y1731H | P15924 | protein_coding | tolerated(0.49) | benign(0.007) | TCGA-BH-A18T-01 | Breast | breast invasive carcinoma | Female | >=65 | I/II | Unknown | Unknown | PD |
| DSP | SNV | Missense_Mutation | novel | c.3289N>G | p.Leu1097Val | p.L1097V | P15924 | protein_coding | tolerated(0.17) | probably_damaging(0.978) | TCGA-BH-A2L8-01 | Breast | breast invasive carcinoma | Female | <65 | I/II | Chemotherapy | cytoxan | CR |
| DSP | SNV | Missense_Mutation | novel | c.2423N>T | p.Arg808Leu | p.R808L | P15924 | protein_coding | deleterious(0.03) | possibly_damaging(0.694) | TCGA-C8-A134-01 | Breast | breast invasive carcinoma | Female | <65 | I/II | Chemotherapy | 5-fluorouracil | CR |
| DSP | SNV | Missense_Mutation | c.3863N>C | p.Lys1288Thr | p.K1288T | P15924 | protein_coding | tolerated(0.1) | probably_damaging(0.987) | TCGA-C8-A26Y-01 | Breast | breast invasive carcinoma | Female | >=65 | I/II | Unknown | Unknown | SD |
| Page: 1 2 3 4 5 6 7 8 9 10 11 12 13 14 15 16 17 18 19 20 21 22 23 24 25 26 27 28 29 30 31 32 33 |
Top |
Related drugs of malignant transformation related genes |
| Identification of chemicals and drugs interact with genes involved in malignant transfromation |
| (DGIdb 4.0) |
| Entrez ID | Symbol | Category | Interaction Types | Drug Claim Name | Drug Name | PMIDs |
| 1832 | DSP | NA | ENALAPRIL | ENALAPRIL | 10839195 |
| Page: 1 |

Copyright 2023-Present -The University of Texas Health Science Center at Houston |