
|
|||||
|
 | |
| |
| |
| |
| |
| |
|
Gene: BCL2L1 |
Gene summary for BCL2L1 |
| Gene information | Species | Human | Gene symbol | BCL2L1 | Gene ID | 598 |
| Gene name | BCL2 like 1 | |
| Gene Alias | BCL-XL/S | |
| Cytomap | 20q11.21 | |
| Gene Type | protein-coding | GO ID | GO:0000003 | UniProtAcc | Q07817 |
Top |
Malignant transformation analysis |
| Identification of the aberrant gene expression in precancerous and cancerous lesions by comparing the gene expression of stem-like cells in diseased tissues with normal stem cells |
| Entrez ID | Symbol | Replicates | Species | Organ | Tissue | Adj P-value | Log2FC | Malignancy |
| 598 | BCL2L1 | HTA11_866_3004761011 | Human | Colorectum | AD | 1.14e-02 | 3.13e-01 | 0.096 |
| 598 | BCL2L1 | HTA11_99999971662_82457 | Human | Colorectum | MSS | 3.51e-11 | 7.07e-01 | 0.3859 |
| 598 | BCL2L1 | HTA11_99999974143_84620 | Human | Colorectum | MSS | 4.13e-09 | 5.86e-01 | 0.3005 |
| 598 | BCL2L1 | A015-C-203 | Human | Colorectum | FAP | 2.91e-09 | -1.27e-01 | -0.1294 |
| 598 | BCL2L1 | A001-C-108 | Human | Colorectum | FAP | 4.14e-03 | -3.21e-02 | -0.0272 |
| 598 | BCL2L1 | A002-C-205 | Human | Colorectum | FAP | 3.02e-04 | -4.65e-02 | -0.1236 |
| 598 | BCL2L1 | A015-C-006 | Human | Colorectum | FAP | 3.38e-02 | -1.21e-01 | -0.0994 |
| 598 | BCL2L1 | A015-C-106 | Human | Colorectum | FAP | 1.75e-03 | -4.90e-02 | -0.0511 |
| 598 | BCL2L1 | A002-C-114 | Human | Colorectum | FAP | 3.42e-02 | -1.21e-01 | -0.1561 |
| 598 | BCL2L1 | A015-C-104 | Human | Colorectum | FAP | 1.14e-08 | -1.21e-01 | -0.1899 |
| 598 | BCL2L1 | A001-C-014 | Human | Colorectum | FAP | 1.29e-02 | -5.96e-03 | 0.0135 |
| 598 | BCL2L1 | A002-C-016 | Human | Colorectum | FAP | 2.01e-05 | -6.27e-02 | 0.0521 |
| 598 | BCL2L1 | A001-C-007 | Human | Colorectum | CRC | 2.97e-08 | 6.90e-01 | 0.1899 |
| 598 | BCL2L1 | A001-C-203 | Human | Colorectum | FAP | 6.58e-03 | 5.11e-02 | -0.0481 |
| 598 | BCL2L1 | A002-C-116 | Human | Colorectum | FAP | 7.36e-12 | -1.16e-01 | -0.0452 |
| 598 | BCL2L1 | A018-E-020 | Human | Colorectum | FAP | 5.22e-04 | -2.21e-01 | -0.2034 |
| 598 | BCL2L1 | F034 | Human | Colorectum | FAP | 1.55e-06 | -1.08e-01 | -0.0665 |
| 598 | BCL2L1 | CRC-1-8810 | Human | Colorectum | CRC | 2.20e-05 | 2.75e-01 | 0.6257 |
| 598 | BCL2L1 | CRC-3-11773 | Human | Colorectum | CRC | 1.12e-05 | 2.81e-01 | 0.2564 |
| 598 | BCL2L1 | LZE4T | Human | Esophagus | ESCC | 4.12e-07 | 3.14e-01 | 0.0811 |
| Page: 1 2 3 4 5 6 7 8 9 |
| Tissue | Expression Dynamics | Abbreviation |
| Colorectum (GSE201348) |  | FAP: Familial adenomatous polyposis |
| CRC: Colorectal cancer | ||
| Colorectum (HTA11) |  | AD: Adenomas |
| SER: Sessile serrated lesions | ||
| MSI-H: Microsatellite-high colorectal cancer | ||
| MSS: Microsatellite stable colorectal cancer | ||
| Esophagus |  | ESCC: Esophageal squamous cell carcinoma |
| HGIN: High-grade intraepithelial neoplasias | ||
| LGIN: Low-grade intraepithelial neoplasias | ||
| GC |  | CAG: Chronic atrophic gastritis |
| CAG with IM: Chronic atrophic gastritis with intestinal metaplasia | ||
| CSG: Chronic superficial gastritis | ||
| GC: Gastric cancer | ||
| SIM: Severe intestinal metaplasia | ||
| WIM: Wild intestinal metaplasia | ||
| Liver | 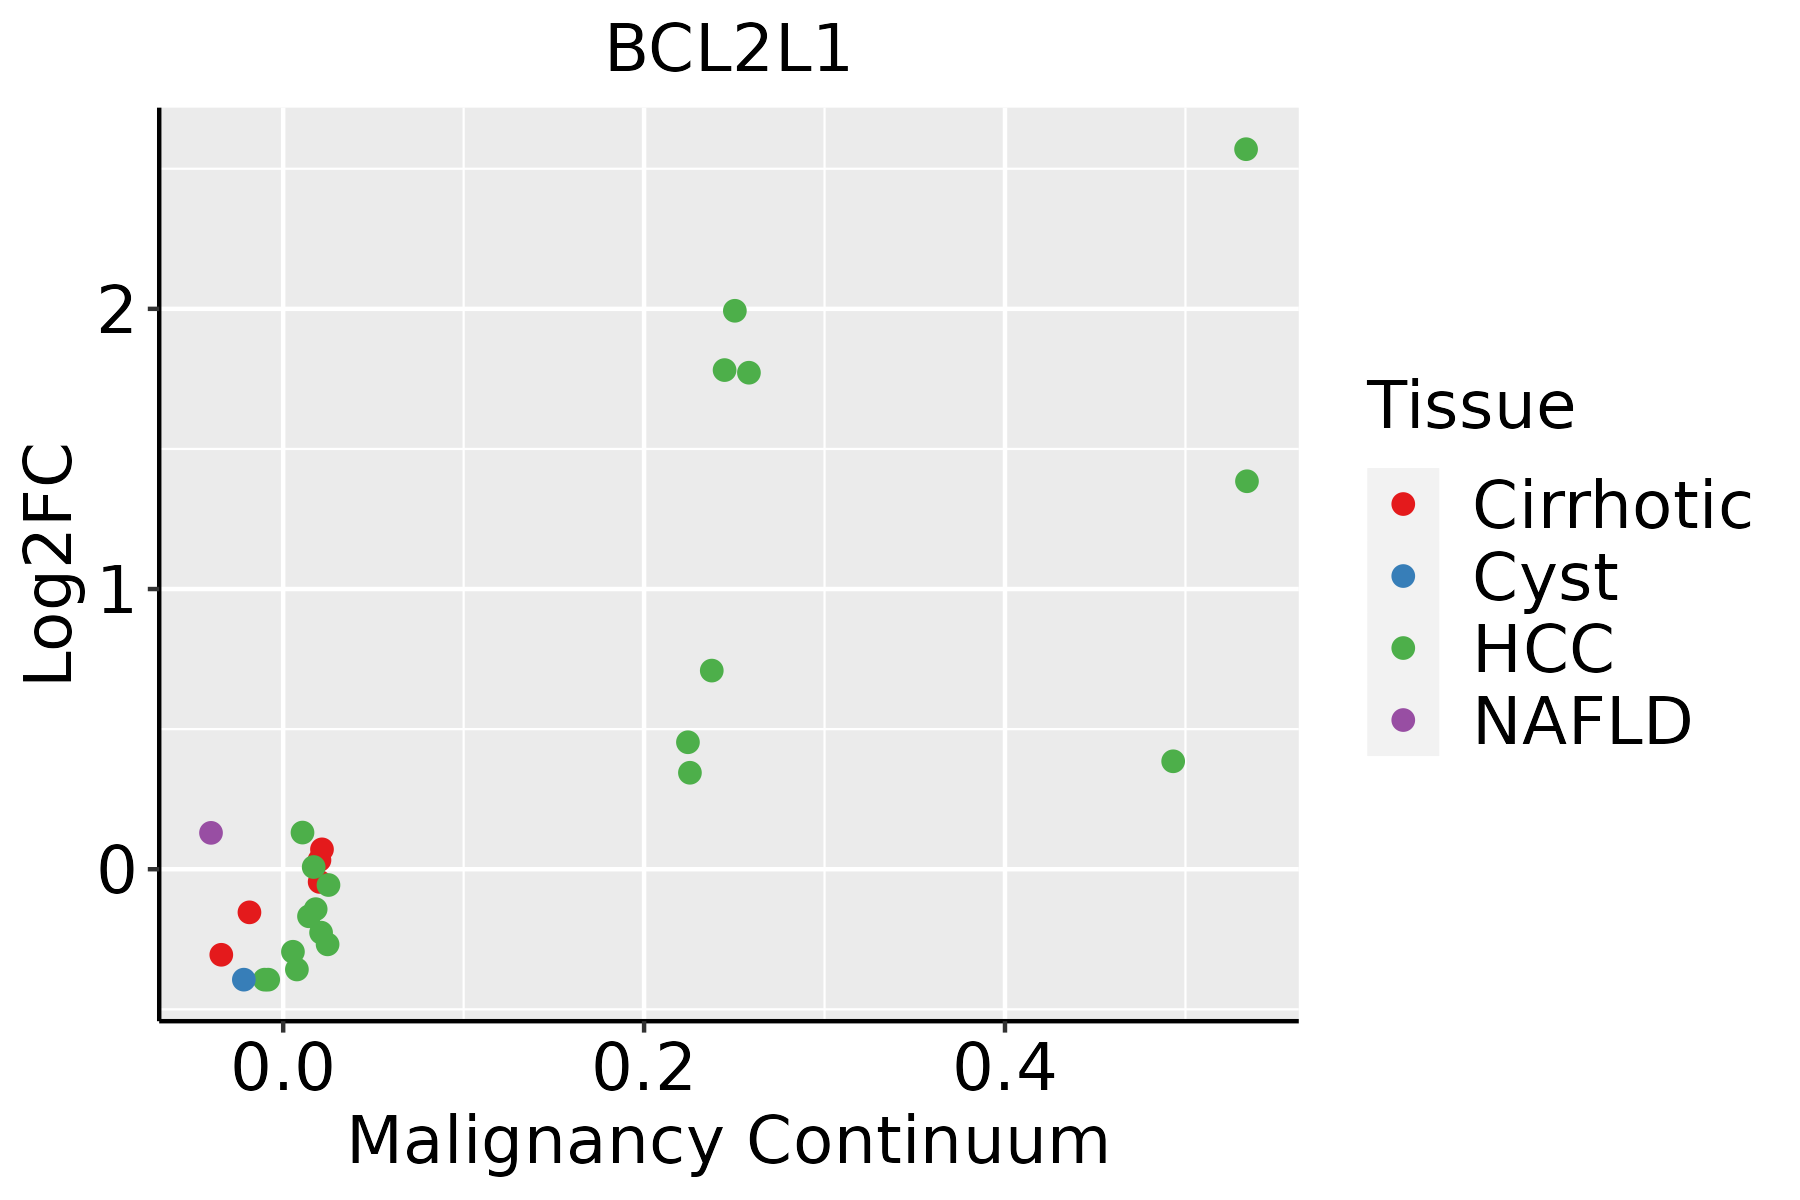 | HCC: Hepatocellular carcinoma |
| NAFLD: Non-alcoholic fatty liver disease | ||
| Lung | 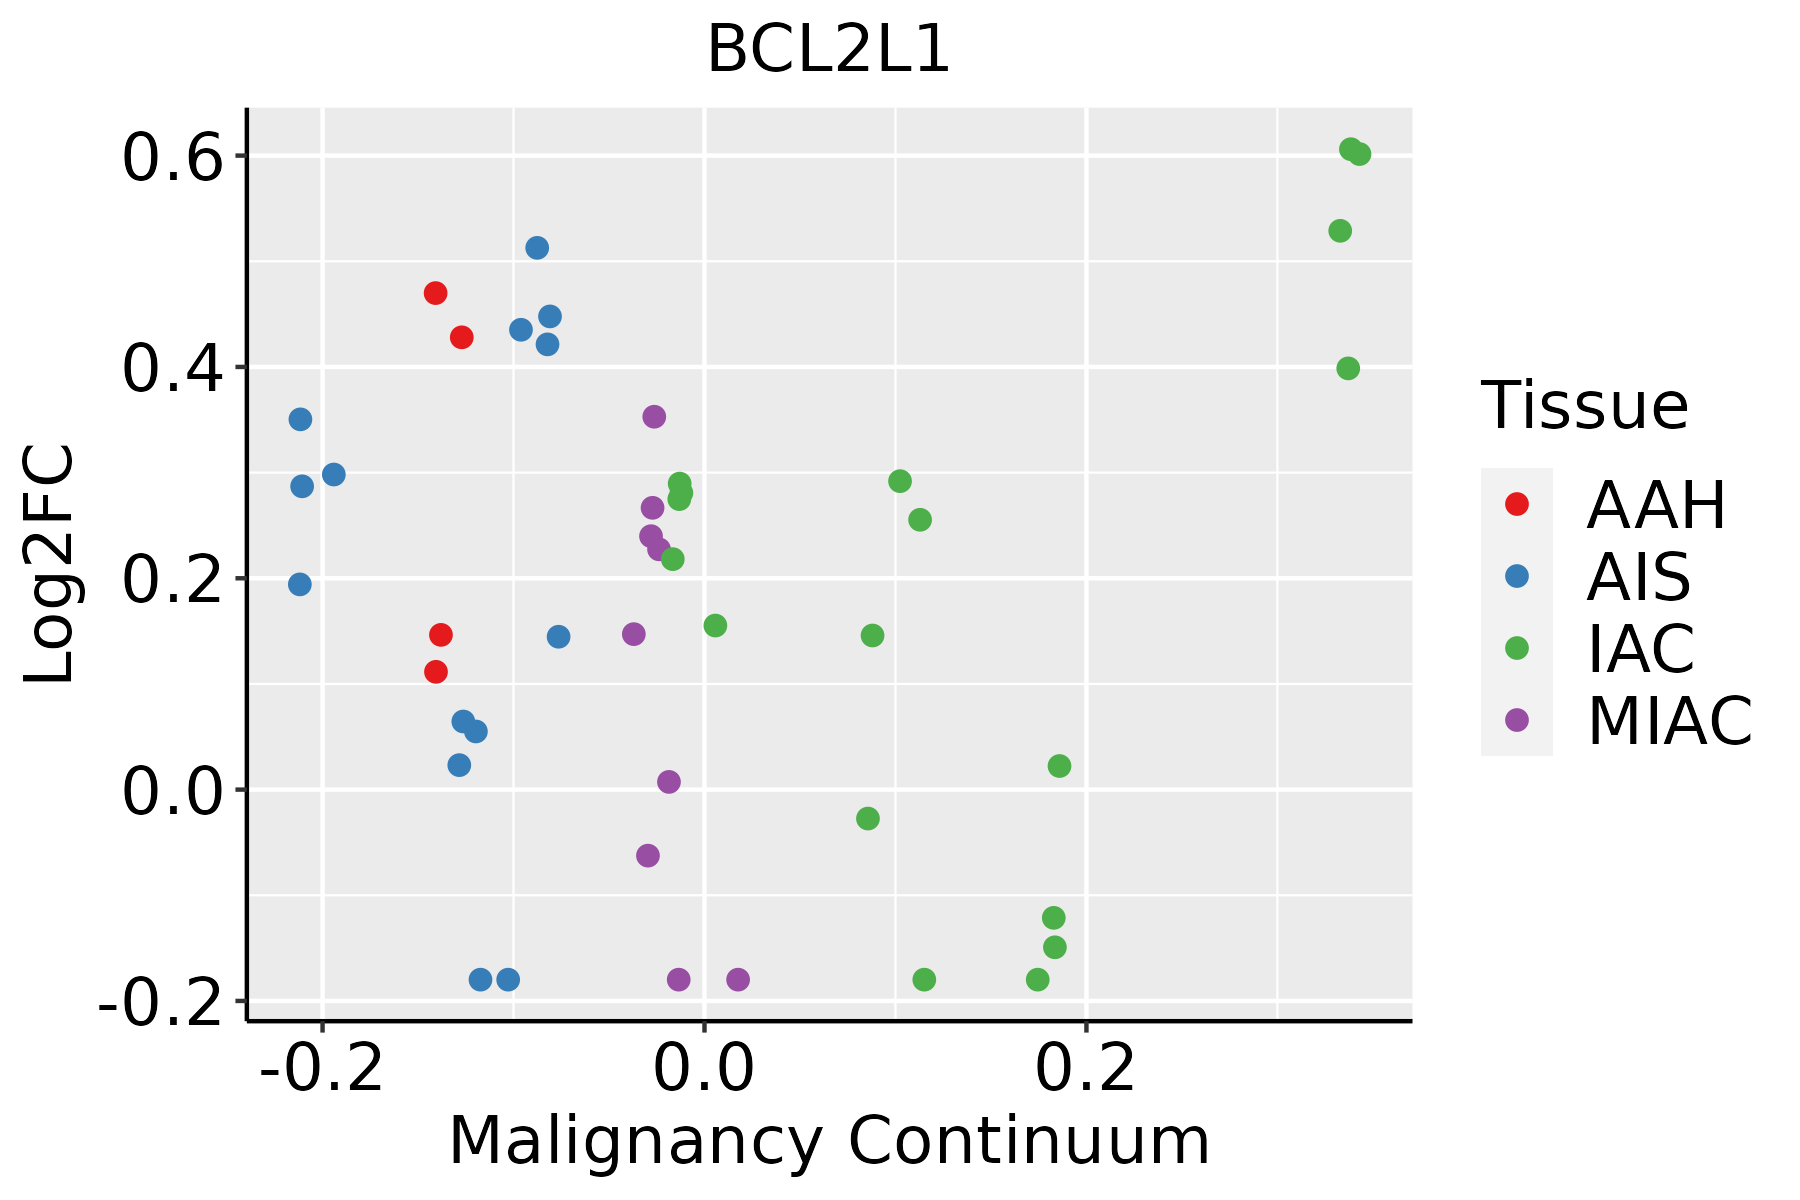 | AAH: Atypical adenomatous hyperplasia |
| AIS: Adenocarcinoma in situ | ||
| IAC: Invasive lung adenocarcinoma | ||
| MIA: Minimally invasive adenocarcinoma | ||
| Oral Cavity |  | EOLP: Erosive Oral lichen planus |
| LP: leukoplakia | ||
| NEOLP: Non-erosive oral lichen planus | ||
| OSCC: Oral squamous cell carcinoma | ||
| Thyroid | 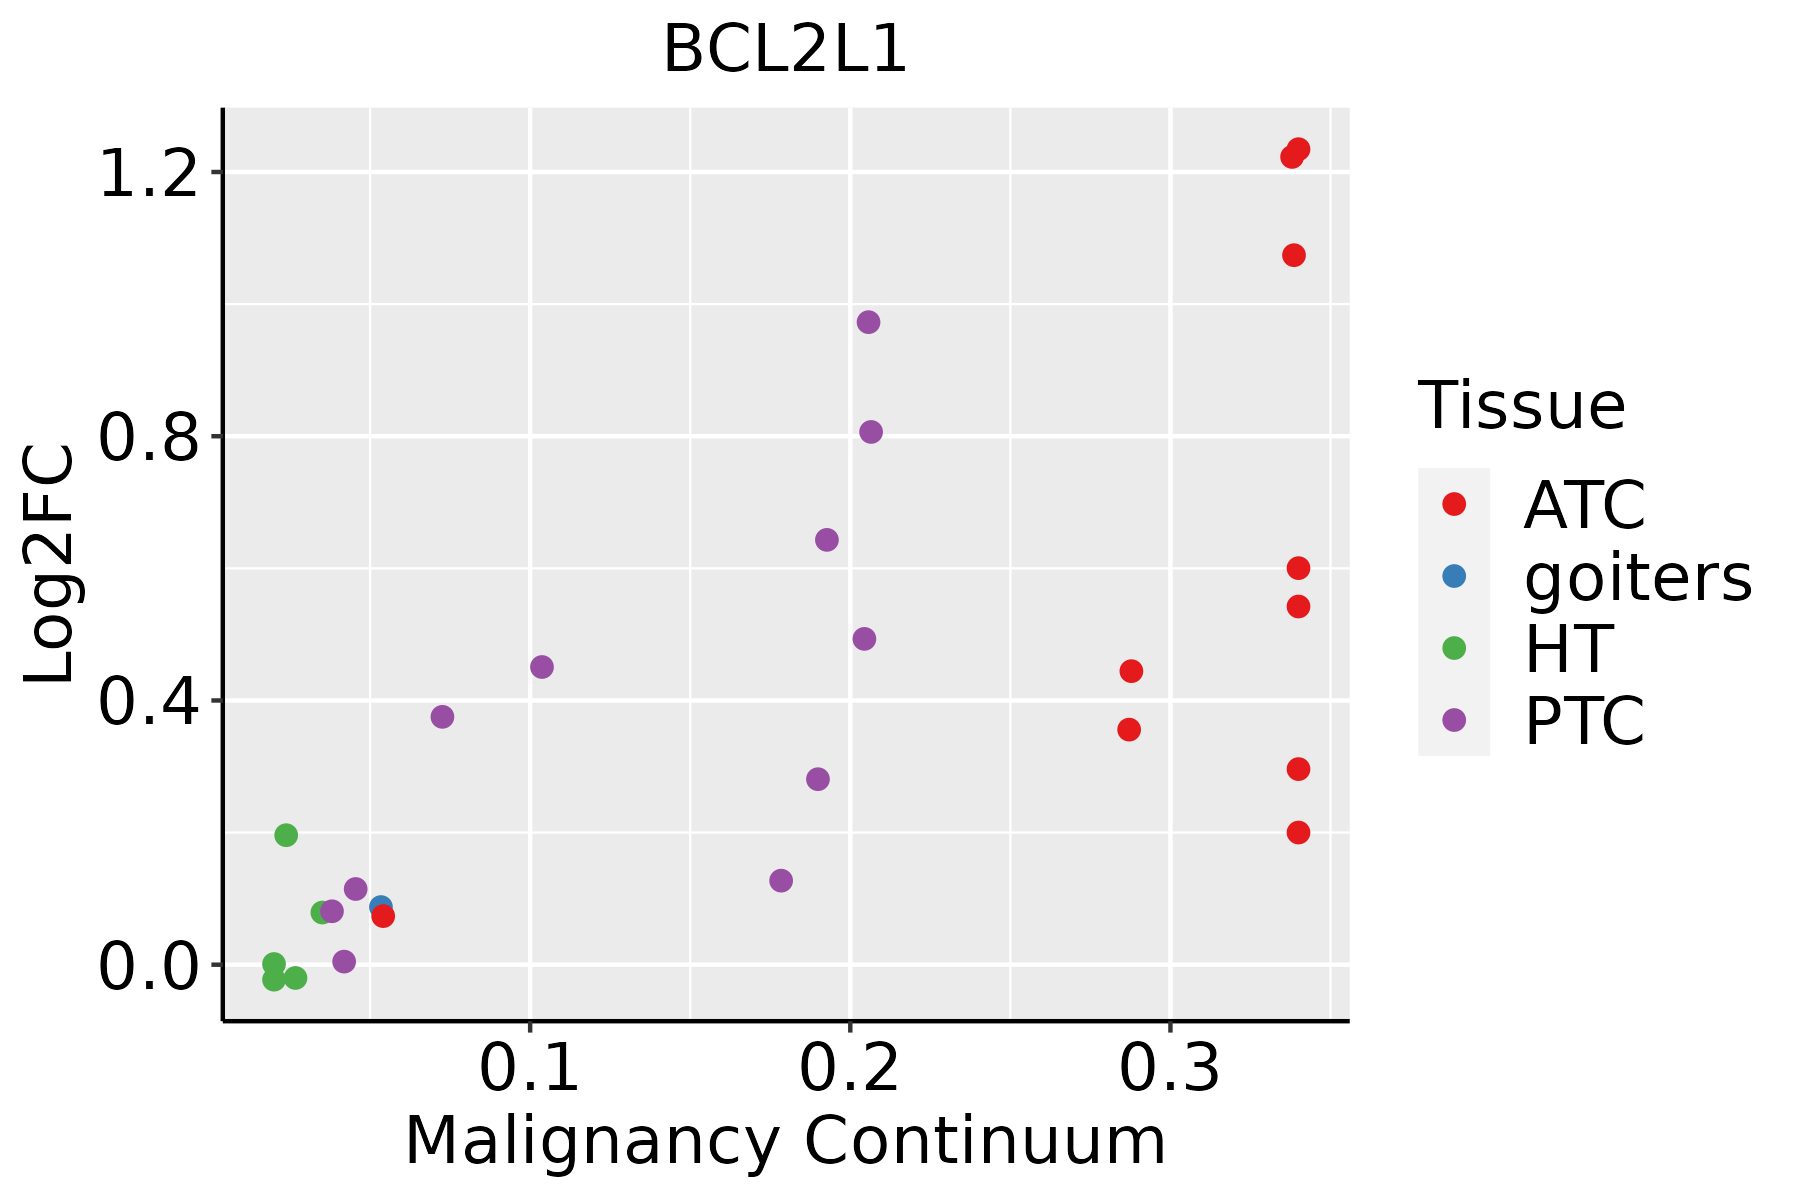 | ATC: Anaplastic thyroid cancer |
| HT: Hashimoto's thyroiditis | ||
| PTC: Papillary thyroid cancer |
| ∗log2FC in expression of this searched gene in stem-like cells from each diseased tissue sample relative to stem-like cells in normal samples in each tissue plotted against the malignancy continuum. Samples are colored based on if they are from different disease stage. |
Top |
Malignant transformation related pathway analysis |
| Find out the enriched GO biological processes and KEGG pathways involved in transition from healthy to precancer to cancer |
| Tissue | Disease Stage | Enriched GO biological Processes |
| Colorectum | AD |  |
| Colorectum | SER |  |
| Colorectum | MSS |  |
| Colorectum | MSI-H |  |
| Colorectum | FAP |  |
| ∗Top 15 enriched GO BP terms are showed in the bar plot of each disease state in each tissue. Each row represents a significant GO biological process which is colored according to the -log10(p.adjust). |
| Page: 1 2 3 4 5 6 7 8 9 |
| GO ID | Tissue | Disease Stage | Description | Gene Ratio | Bg Ratio | pvalue | p.adjust | Count |
| GO:19054763 | Liver | Cirrhotic | negative regulation of protein localization to membrane | 17/4634 | 32/18723 | 5.24e-04 | 4.14e-03 | 17 |
| GO:00432002 | Liver | Cirrhotic | response to amino acid | 45/4634 | 116/18723 | 5.54e-04 | 4.36e-03 | 45 |
| GO:00009105 | Liver | Cirrhotic | cytokinesis | 62/4634 | 173/18723 | 7.13e-04 | 5.33e-03 | 62 |
| GO:200102011 | Liver | Cirrhotic | regulation of response to DNA damage stimulus | 75/4634 | 219/18723 | 9.75e-04 | 6.89e-03 | 75 |
| GO:19020424 | Liver | Cirrhotic | negative regulation of extrinsic apoptotic signaling pathway via death domain receptors | 16/4634 | 31/18723 | 1.15e-03 | 7.83e-03 | 16 |
| GO:19043764 | Liver | Cirrhotic | negative regulation of protein localization to cell periphery | 14/4634 | 26/18723 | 1.37e-03 | 9.14e-03 | 14 |
| GO:009728411 | Liver | Cirrhotic | hepatocyte apoptotic process | 10/4634 | 16/18723 | 1.51e-03 | 9.91e-03 | 10 |
| GO:1903317 | Liver | Cirrhotic | regulation of protein maturation | 28/4634 | 67/18723 | 1.60e-03 | 1.04e-02 | 28 |
| GO:00108236 | Liver | Cirrhotic | negative regulation of mitochondrion organization | 22/4634 | 49/18723 | 1.64e-03 | 1.05e-02 | 22 |
| GO:001021211 | Liver | Cirrhotic | response to ionizing radiation | 53/4634 | 148/18723 | 1.70e-03 | 1.08e-02 | 53 |
| GO:00518815 | Liver | Cirrhotic | regulation of mitochondrial membrane potential | 30/4634 | 74/18723 | 1.97e-03 | 1.23e-02 | 30 |
| GO:00614585 | Liver | Cirrhotic | reproductive system development | 132/4634 | 427/18723 | 2.07e-03 | 1.28e-02 | 132 |
| GO:00486085 | Liver | Cirrhotic | reproductive structure development | 131/4634 | 424/18723 | 2.19e-03 | 1.34e-02 | 131 |
| GO:00069191 | Liver | Cirrhotic | activation of cysteine-type endopeptidase activity involved in apoptotic process | 31/4634 | 78/18723 | 2.43e-03 | 1.46e-02 | 31 |
| GO:19040191 | Liver | Cirrhotic | epithelial cell apoptotic process | 44/4634 | 121/18723 | 2.86e-03 | 1.65e-02 | 44 |
| GO:00435242 | Liver | Cirrhotic | negative regulation of neuron apoptotic process | 51/4634 | 145/18723 | 3.15e-03 | 1.78e-02 | 51 |
| GO:19022367 | Liver | Cirrhotic | negative regulation of endoplasmic reticulum stress-induced intrinsic apoptotic signaling pathway | 11/4634 | 20/18723 | 3.61e-03 | 1.99e-02 | 11 |
| GO:0071229 | Liver | Cirrhotic | cellular response to acid chemical | 31/4634 | 80/18723 | 3.83e-03 | 2.10e-02 | 31 |
| GO:0070613 | Liver | Cirrhotic | regulation of protein processing | 26/4634 | 65/18723 | 4.73e-03 | 2.48e-02 | 26 |
| GO:00018366 | Liver | Cirrhotic | release of cytochrome c from mitochondria | 24/4634 | 59/18723 | 5.06e-03 | 2.62e-02 | 24 |
| Page: 1 2 3 4 5 6 7 8 9 10 11 12 13 14 15 16 17 18 19 20 21 22 23 24 25 26 27 28 29 30 31 32 33 34 35 36 37 38 39 40 41 42 43 44 45 46 47 48 49 50 51 52 53 54 55 56 57 58 59 60 61 62 63 64 65 66 |
| Pathway ID | Tissue | Disease Stage | Description | Gene Ratio | Bg Ratio | pvalue | p.adjust | qvalue | Count |
| hsa05131 | Colorectum | AD | Shigellosis | 109/2092 | 247/8465 | 1.09e-11 | 2.44e-10 | 1.55e-10 | 109 |
| hsa05417 | Colorectum | AD | Lipid and atherosclerosis | 73/2092 | 215/8465 | 1.31e-03 | 8.27e-03 | 5.27e-03 | 73 |
| hsa05170 | Colorectum | AD | Human immunodeficiency virus 1 infection | 72/2092 | 212/8465 | 1.40e-03 | 8.46e-03 | 5.39e-03 | 72 |
| hsa05220 | Colorectum | AD | Chronic myeloid leukemia | 31/2092 | 76/8465 | 1.41e-03 | 8.46e-03 | 5.39e-03 | 31 |
| hsa05225 | Colorectum | AD | Hepatocellular carcinoma | 59/2092 | 168/8465 | 1.50e-03 | 8.69e-03 | 5.54e-03 | 59 |
| hsa04137 | Colorectum | AD | Mitophagy - animal | 29/2092 | 72/8465 | 2.49e-03 | 1.35e-02 | 8.59e-03 | 29 |
| hsa05166 | Colorectum | AD | Human T-cell leukemia virus 1 infection | 72/2092 | 222/8465 | 5.24e-03 | 2.44e-02 | 1.55e-02 | 72 |
| hsa01521 | Colorectum | AD | EGFR tyrosine kinase inhibitor resistance | 29/2092 | 79/8465 | 1.15e-02 | 4.24e-02 | 2.71e-02 | 29 |
| hsa051311 | Colorectum | AD | Shigellosis | 109/2092 | 247/8465 | 1.09e-11 | 2.44e-10 | 1.55e-10 | 109 |
| hsa054171 | Colorectum | AD | Lipid and atherosclerosis | 73/2092 | 215/8465 | 1.31e-03 | 8.27e-03 | 5.27e-03 | 73 |
| hsa051701 | Colorectum | AD | Human immunodeficiency virus 1 infection | 72/2092 | 212/8465 | 1.40e-03 | 8.46e-03 | 5.39e-03 | 72 |
| hsa052201 | Colorectum | AD | Chronic myeloid leukemia | 31/2092 | 76/8465 | 1.41e-03 | 8.46e-03 | 5.39e-03 | 31 |
| hsa052251 | Colorectum | AD | Hepatocellular carcinoma | 59/2092 | 168/8465 | 1.50e-03 | 8.69e-03 | 5.54e-03 | 59 |
| hsa041371 | Colorectum | AD | Mitophagy - animal | 29/2092 | 72/8465 | 2.49e-03 | 1.35e-02 | 8.59e-03 | 29 |
| hsa051661 | Colorectum | AD | Human T-cell leukemia virus 1 infection | 72/2092 | 222/8465 | 5.24e-03 | 2.44e-02 | 1.55e-02 | 72 |
| hsa015211 | Colorectum | AD | EGFR tyrosine kinase inhibitor resistance | 29/2092 | 79/8465 | 1.15e-02 | 4.24e-02 | 2.71e-02 | 29 |
| hsa050124 | Colorectum | MSS | Parkinson disease | 140/1875 | 266/8465 | 2.32e-28 | 7.79e-26 | 4.77e-26 | 140 |
| hsa050224 | Colorectum | MSS | Pathways of neurodegeneration - multiple diseases | 192/1875 | 476/8465 | 2.79e-20 | 1.04e-18 | 6.36e-19 | 192 |
| hsa050144 | Colorectum | MSS | Amyotrophic lateral sclerosis | 156/1875 | 364/8465 | 1.43e-19 | 4.62e-18 | 2.83e-18 | 156 |
| hsa051314 | Colorectum | MSS | Shigellosis | 94/1875 | 247/8465 | 6.82e-09 | 1.34e-07 | 8.23e-08 | 94 |
| Page: 1 2 3 4 5 6 7 8 9 10 11 12 13 14 15 16 17 18 19 20 |
Top |
Cell-cell communication analysis |
| Identification of potential cell-cell interactions between two cell types and their ligand-receptor pairs for different disease states |
| Ligand | Receptor | LRpair | Pathway | Tissue | Disease Stage |
| Page: 1 |
Top |
Single-cell gene regulatory network inference analysis |
| Find out the significant the regulons (TFs) and the target genes of each regulon across cell types for different disease states |
| TF | Cell Type | Tissue | Disease Stage | Target Gene | RSS | Regulon Activity |
| ∗The dot plots of a searched regulon are shown for all cell subpopulations in each disease state of each tissue based on the regulon specific score inferred using pySCENIC and by calculating the average expression. |
| Page: 1 |
Top |
Somatic mutation of malignant transformation related genes |
| Annotation of somatic variants for genes involved in malignant transformation |
| Hugo Symbol | Variant Class | Variant Classification | dbSNP RS | HGVSc | HGVSp | HGVSp Short | SWISSPROT | BIOTYPE | SIFT | PolyPhen | Tumor Sample Barcode | Tissue | Histology | Sex | Age | Stage | Therapy Types | Drugs | Outcome |
| BCL2L1 | SNV | Missense_Mutation | c.72N>C | p.Trp24Cys | p.W24C | Q07817 | protein_coding | tolerated(0.18) | benign(0.18) | TCGA-A2-A0CX-01 | Breast | breast invasive carcinoma | Female | <65 | I/II | Chemotherapy | adriamycin | SD | |
| BCL2L1 | SNV | Missense_Mutation | c.292G>A | p.Glu98Lys | p.E98K | Q07817 | protein_coding | deleterious(0) | probably_damaging(0.994) | TCGA-AC-A23H-01 | Breast | breast invasive carcinoma | Female | >=65 | I/II | Unknown | Unknown | PD | |
| BCL2L1 | SNV | Missense_Mutation | novel | c.132N>T | p.Glu44Asp | p.E44D | Q07817 | protein_coding | tolerated(0.41) | benign(0) | TCGA-AN-A046-01 | Breast | breast invasive carcinoma | Female | >=65 | I/II | Unknown | Unknown | SD |
| BCL2L1 | insertion | Frame_Shift_Ins | novel | c.537_538insAAAACTGTAGCCTATGTGTTCATTAAGTCCCAAA | p.Pro180LysfsTer70 | p.P180Kfs*70 | Q07817 | protein_coding | TCGA-AR-A0TY-01 | Breast | breast invasive carcinoma | Female | <65 | I/II | Unspecific | Paclitaxel | PD | ||
| BCL2L1 | insertion | Nonsense_Mutation | novel | c.441_442insAGTGTATTGTAAATCTTGGCGATAATGT | p.Gly148SerfsTer4 | p.G148Sfs*4 | Q07817 | protein_coding | TCGA-B6-A0I5-01 | Breast | breast invasive carcinoma | Female | <65 | I/II | Unknown | Unknown | SD | ||
| BCL2L1 | SNV | Missense_Mutation | novel | c.106N>C | p.Glu36Gln | p.E36Q | Q07817 | protein_coding | tolerated(0.33) | benign(0.245) | TCGA-HM-A4S6-01 | Cervix | cervical & endocervical cancer | Female | <65 | III/IV | Chemotherapy | cisplatin | CR |
| BCL2L1 | SNV | Missense_Mutation | novel | c.647N>T | p.Thr216Met | p.T216M | Q07817 | protein_coding | tolerated(0.29) | possibly_damaging(0.622) | TCGA-AA-3845-01 | Colorectum | colon adenocarcinoma | Female | >=65 | I/II | Unknown | Unknown | PD |
| BCL2L1 | SNV | Missense_Mutation | novel | c.205N>C | p.Thr69Pro | p.T69P | Q07817 | protein_coding | tolerated(0.45) | benign(0) | TCGA-AA-A01C-01 | Colorectum | colon adenocarcinoma | Male | >=65 | III/IV | Unknown | Unknown | SD |
| BCL2L1 | SNV | Missense_Mutation | novel | c.325A>G | p.Thr109Ala | p.T109A | Q07817 | protein_coding | tolerated(0.21) | benign(0.018) | TCGA-CM-5861-01 | Colorectum | colon adenocarcinoma | Female | <65 | I/II | Unknown | Unknown | PD |
| BCL2L1 | SNV | Missense_Mutation | c.362A>C | p.Gln121Pro | p.Q121P | Q07817 | protein_coding | deleterious(0) | benign(0.159) | TCGA-NH-A5IV-01 | Colorectum | colon adenocarcinoma | Female | >=65 | I/II | Unknown | Unknown | SD |
| Page: 1 2 3 |
Top |
Related drugs of malignant transformation related genes |
| Identification of chemicals and drugs interact with genes involved in malignant transfromation |
| (DGIdb 4.0) |
| Entrez ID | Symbol | Category | Interaction Types | Drug Claim Name | Drug Name | PMIDs |
| 598 | BCL2L1 | CLINICALLY ACTIONABLE, DRUGGABLE GENOME | Indole-based analog 2 | |||
| 598 | BCL2L1 | CLINICALLY ACTIONABLE, DRUGGABLE GENOME | NAVITOCLAX, ABT-263 | |||
| 598 | BCL2L1 | CLINICALLY ACTIONABLE, DRUGGABLE GENOME | antagonist | 252166532 | ABT 737 | |
| 598 | BCL2L1 | CLINICALLY ACTIONABLE, DRUGGABLE GENOME | PMID27744724-Compound-26 | |||
| 598 | BCL2L1 | CLINICALLY ACTIONABLE, DRUGGABLE GENOME | GOSSYPOL | GOSSYPOL | 19555126 | |
| 598 | BCL2L1 | CLINICALLY ACTIONABLE, DRUGGABLE GENOME | antagonist | 252166530 | VENETOCLAX | |
| 598 | BCL2L1 | CLINICALLY ACTIONABLE, DRUGGABLE GENOME | APG-1252 | |||
| 598 | BCL2L1 | CLINICALLY ACTIONABLE, DRUGGABLE GENOME | ABT-737 | ABT 737 | 22386982,22747598 | |
| 598 | BCL2L1 | CLINICALLY ACTIONABLE, DRUGGABLE GENOME | ABT-263 | NAVITOCLAX | ||
| 598 | BCL2L1 | CLINICALLY ACTIONABLE, DRUGGABLE GENOME | inhibitor | CHEMBL443684 | NAVITOCLAX |
| Page: 1 2 3 |

Copyright 2023-Present -The University of Texas Health Science Center at Houston |